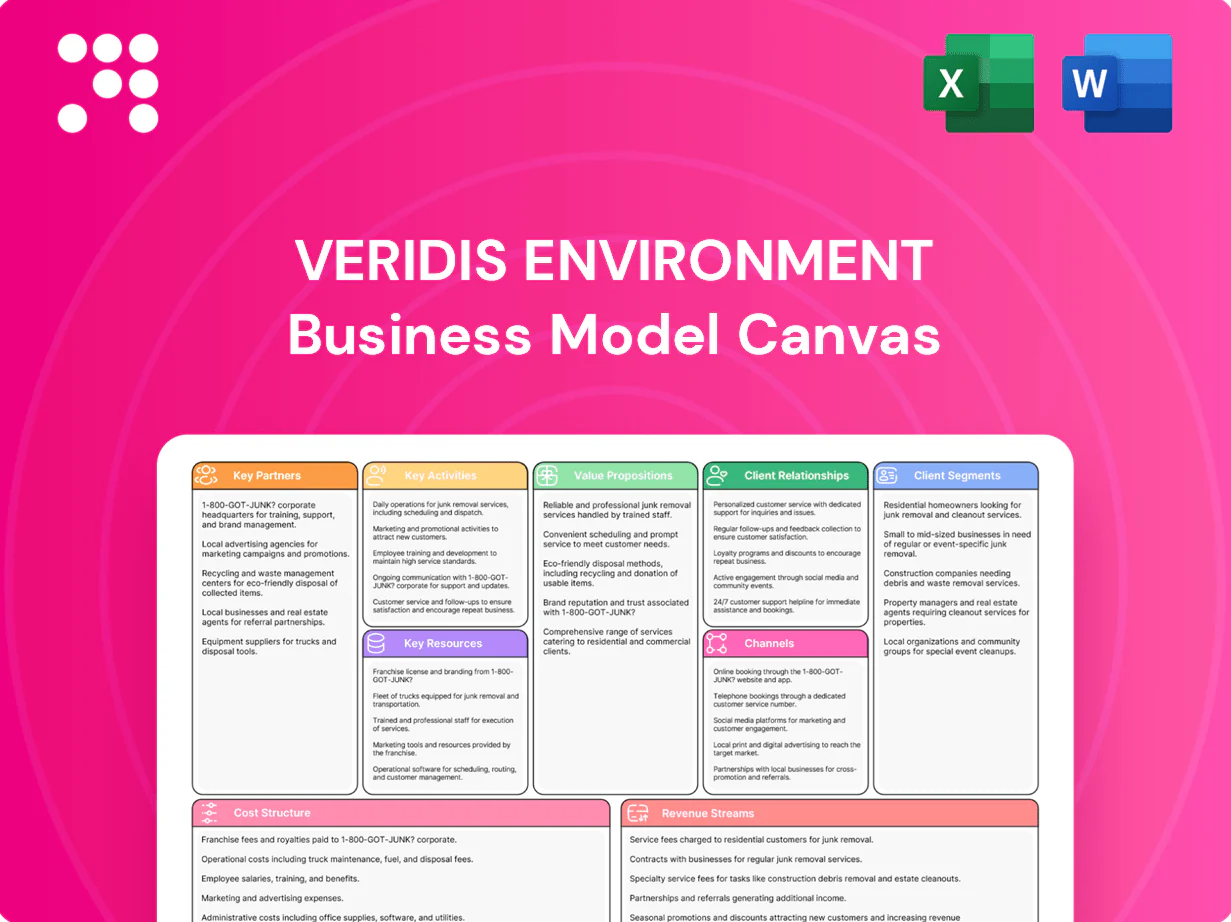
Veridis Environment Business Model Canvas

Business Model Canvas: Scalable, Investor-Ready Clean-Technology Strategy
Unlock the strategic blueprint behind Veridis Environment with our in-depth Business Model Canvas. This concise, editable file breaks down value propositions, key partners, revenue streams and cost structure to reveal how the company scales and wins market share. Ideal for investors, founders, and analysts—download the full Canvas in Word/Excel to apply insights and accelerate your strategy.
Partnerships

Municipalities and local authorities
Public-sector partners award concessions for collection, landfill operation and waste-to-energy plants, typically 10–25 year contracts; WtE CAPEX often ranges €150–400m per facility. Long-term service contracts secure >80% feedstock certainty and predictable revenue streams. Joint planning aligns projects with local sustainability targets, regulatory standards and can cut routing and collection costs up to 15%, improving community acceptance.
National regulators and environmental agencies
Partnerships with ministries and regulators secure permits and align Veridis with compliance frameworks such as the EU municipal waste recycling targets (55% by 2025, 60% by 2030, 65% by 2035) and evolving water reuse standards; continuous engagement helps anticipate policy shifts on waste diversion and water reuse. Joint working groups streamline monitoring and reporting requirements, improving compliance credibility and reducing project risk and financing costs.

Technology vendors and EPC contractors
Technology vendors supplying WtE boilers, anaerobic digestion, MRF automation, membranes and SCADA systems drive thermal and biochemical efficiency and, as of 2024, enable industrial-scale plants to target >95% operational availability; EPC partners deliver turnkey builds to schedule and budget, with multi-year service agreements (typically 5–15 years) keeping uptime high and lifecycle costs predictable, while co-development deals accelerate piloting of novel treatment and sorting technologies.

Financial institutions and infrastructure investors
- Project finance
- Green bonds
- PPP structures
- Risk & governance
- Sustainability-linked financing
Industrial and commercial waste generators
Anchor industrial and commercial clients secure steady waste volumes and wastewater loads, supporting predictable throughput and linking to a global C&I waste market estimated at about USD 300 billion in 2024; collaboration enables tailored pre-treatment, segregation, and pickup schedules that cut processing variability. Data-sharing with clients measurably improves diversion rates and cost visibility, while multi-year contracts stabilize revenues and operational planning.
- Anchor clients: steady feedstock, lower variability
- Collaboration: tailored pre-treatment and pickup
- Data-sharing: higher diversion, clearer costs
- Long-term contracts: revenue and planning stability
Public 10–25y concessions, WtE CAPEX €150–400m, ≥95% uptime, €500bn green bonds
Public partners provide 10–25y concessions; WtE CAPEX €150–400m/project and >80% feedstock certainty. Tech & EPC partners enable >95% availability (2024); financial partners supply project finance and green bonds (issuance €≈500bn 2023). Anchor C&I clients tap a global C&I waste market ≈USD300bn (2024) and secure multi‑year volumes.
| Partner | Key metric | Impact |
|---|---|---|
| Public | 10–25y concessions | Revenue certainty |
| Tech/EPC | ≥95% availability (2024) | Operational reliability |
| Finance | Green bonds €500bn (2023) | CAPEX funding |
| Anchor clients | USD300bn market (2024) | Stable feedstock |
What is included in the product
 Detailed Word Document
A comprehensive, pre-written Business Model Canvas for Veridis Environment, organized into the 9 classic BMC blocks with full narratives, value propositions, channels and customer segments, plus linked SWOT and competitive-advantage insights ideal for investor presentations and strategic analysis.

 Customizable Excel Spreadsheet
Editable one-page Business Model Canvas that condenses Veridis Environment’s strategy, eliminating tedious formatting, accelerating cross-team alignment, and enabling rapid scenario comparison for faster decision-making.
Activities

Operate waste-to-energy and recovery facilities
Daily operations target maximum throughput (300–3,000 t/day) and heat-rate efficiency, meeting 2024 benchmarks of 20–28% net electrical efficiency and CHP up to 60–80% when heat is utilized. Continuous emissions monitoring (CEMS) ensures regulatory compliance with EU/US limits and real-time reporting. Controlled ash handling (10–25% residual mass), optimized energy dispatch, and predictive maintenance reduce OPEX and maximize revenue. Performance analytics deliver year-on-year efficiency gains, typically 1–3% annually in modern plants.
Run recycling, MRFs, and organics processing
Sorting, baling, and contamination control raise material recovery—industry 2024 MRFs average ~75% recovery and contamination reduction to under 8% can boost usable yield by ~10–15%. Long-term offtake contracts (commonly 3–5 years) secure steady sales and stabilize revenue against 2024 recyclate price volatility. Organics are handled via composting or anaerobic digestion, with AD systems delivering biogas yields of 100–200 m3/ton wet feedstock. Rigorous quality assurance preserves market acceptance and pricing.

Manage landfills with advanced environmental controls
Leachate collection, gas capture and composite liner integrity are actively managed to prevent offsite migration and preserve asset value; engineered liners and collection systems typically achieve containment improvements measured in orders of magnitude. Gas-to-energy projects capture 60–90% of landfill methane, with flaring as a backup to reduce CO2-equivalent emissions. Strategic cell development and phased closure plans extend operational life and defer capital replacement. Continuous groundwater and air monitoring protects community health and regulatory compliance.

Operate water and wastewater treatment assets
Membrane, biological and advanced oxidation processes deliver compliance-grade effluent (typical targets: <1 mg/L TSS, >4-log pathogen reduction) while sludge management with anaerobic digestion and nutrient recovery cuts disposal costs and can offset ~30% of OPEX. Reuse schemes supply agriculture and industry, supporting reclaimed-water revenues; SCADA-driven control improves reliability and trims energy use by up to 20% in modern plants (2024 industry data).
- Processes: membrane | biological | AOP
- Sludge: digestion & resource recovery — ~30% OPEX offset
- Reuse: agriculture & industry supply, revenue generation
- Controls: SCADA — up to 20% energy reduction (2024)
Project development and stakeholder engagement
Identify, permit, and finance new facilities and upgrades with typical permitting timelines of 2–5 years and project finance structures using 60–80% debt leverage; capital needs often range in the tens of millions per facility. Community outreach builds social license, addressing concerns and reducing delays. Tendering and PPP negotiations secure 15–25 year revenue streams while ESG reporting and third‑party audits (2024: rising regulatory scrutiny) demonstrate impact and transparency.
- Permitting: 2–5 years
- Leverage: 60–80% debt
- PPP terms: 15–25 years
- ESG audits: 3rd‑party verified (2024 focus)
High-throughput waste-to-energy sites: 300-3,000 t/day, 20-28% elec eff, 60-80% CHP
Operate high-throughput facilities (300–3,000 t/day) targeting 20–28% net electrical efficiency or 60–80% CHP, with CEMS and predictive maintenance driving 1–3% annual gains. Material recovery facilities average ~75% recovery; contamination <8% and AD yields 100–200 m3/ton. Permitting 2–5 years, leverage 60–80%, project CAPEX typically tens of millions per site.
| Metric | 2024 Value |
|---|---|
| Throughput | 300–3,000 t/day |
| Net elec eff | 20–28% |
| CHP | 60–80% |
| MRF recovery | ~75% |
| AD biogas | 100–200 m3/ton |
| Permitting | 2–5 years |
| Leverage | 60–80% |
| CAPEX | Tens of millions |
Full Version Awaits
Business Model Canvas
The document previewed here is the exact Veridis Environment Business Model Canvas you will receive—no mockups or samples. Upon purchase you’ll get this same complete, editable file ready for presentation and implementation. What you see is what you’ll own.

Business Model Canvas: Scalable, Investor-Ready Clean-Technology Strategy
Unlock the strategic blueprint behind Veridis Environment with our in-depth Business Model Canvas. This concise, editable file breaks down value propositions, key partners, revenue streams and cost structure to reveal how the company scales and wins market share. Ideal for investors, founders, and analysts—download the full Canvas in Word/Excel to apply insights and accelerate your strategy.
Partnerships
Municipalities and local authorities
Public-sector partners award concessions for collection, landfill operation and waste-to-energy plants, typically 10–25 year contracts; WtE CAPEX often ranges €150–400m per facility. Long-term service contracts secure >80% feedstock certainty and predictable revenue streams. Joint planning aligns projects with local sustainability targets, regulatory standards and can cut routing and collection costs up to 15%, improving community acceptance.
National regulators and environmental agencies
Partnerships with ministries and regulators secure permits and align Veridis with compliance frameworks such as the EU municipal waste recycling targets (55% by 2025, 60% by 2030, 65% by 2035) and evolving water reuse standards; continuous engagement helps anticipate policy shifts on waste diversion and water reuse. Joint working groups streamline monitoring and reporting requirements, improving compliance credibility and reducing project risk and financing costs.
Technology vendors and EPC contractors
Technology vendors supplying WtE boilers, anaerobic digestion, MRF automation, membranes and SCADA systems drive thermal and biochemical efficiency and, as of 2024, enable industrial-scale plants to target >95% operational availability; EPC partners deliver turnkey builds to schedule and budget, with multi-year service agreements (typically 5–15 years) keeping uptime high and lifecycle costs predictable, while co-development deals accelerate piloting of novel treatment and sorting technologies.
Financial institutions and infrastructure investors
- Project finance
- Green bonds
- PPP structures
- Risk & governance
- Sustainability-linked financing
Industrial and commercial waste generators
Anchor industrial and commercial clients secure steady waste volumes and wastewater loads, supporting predictable throughput and linking to a global C&I waste market estimated at about USD 300 billion in 2024; collaboration enables tailored pre-treatment, segregation, and pickup schedules that cut processing variability. Data-sharing with clients measurably improves diversion rates and cost visibility, while multi-year contracts stabilize revenues and operational planning.
- Anchor clients: steady feedstock, lower variability
- Collaboration: tailored pre-treatment and pickup
- Data-sharing: higher diversion, clearer costs
- Long-term contracts: revenue and planning stability
Public 10–25y concessions, WtE CAPEX €150–400m, ≥95% uptime, €500bn green bonds
Public partners provide 10–25y concessions; WtE CAPEX €150–400m/project and >80% feedstock certainty. Tech & EPC partners enable >95% availability (2024); financial partners supply project finance and green bonds (issuance €≈500bn 2023). Anchor C&I clients tap a global C&I waste market ≈USD300bn (2024) and secure multi‑year volumes.
| Partner | Key metric | Impact |
|---|---|---|
| Public | 10–25y concessions | Revenue certainty |
| Tech/EPC | ≥95% availability (2024) | Operational reliability |
| Finance | Green bonds €500bn (2023) | CAPEX funding |
| Anchor clients | USD300bn market (2024) | Stable feedstock |
What is included in the product
Detailed Word Document
A comprehensive, pre-written Business Model Canvas for Veridis Environment, organized into the 9 classic BMC blocks with full narratives, value propositions, channels and customer segments, plus linked SWOT and competitive-advantage insights ideal for investor presentations and strategic analysis.
Customizable Excel Spreadsheet
Editable one-page Business Model Canvas that condenses Veridis Environment’s strategy, eliminating tedious formatting, accelerating cross-team alignment, and enabling rapid scenario comparison for faster decision-making.
Activities
Operate waste-to-energy and recovery facilities
Daily operations target maximum throughput (300–3,000 t/day) and heat-rate efficiency, meeting 2024 benchmarks of 20–28% net electrical efficiency and CHP up to 60–80% when heat is utilized. Continuous emissions monitoring (CEMS) ensures regulatory compliance with EU/US limits and real-time reporting. Controlled ash handling (10–25% residual mass), optimized energy dispatch, and predictive maintenance reduce OPEX and maximize revenue. Performance analytics deliver year-on-year efficiency gains, typically 1–3% annually in modern plants.
Run recycling, MRFs, and organics processing
Sorting, baling, and contamination control raise material recovery—industry 2024 MRFs average ~75% recovery and contamination reduction to under 8% can boost usable yield by ~10–15%. Long-term offtake contracts (commonly 3–5 years) secure steady sales and stabilize revenue against 2024 recyclate price volatility. Organics are handled via composting or anaerobic digestion, with AD systems delivering biogas yields of 100–200 m3/ton wet feedstock. Rigorous quality assurance preserves market acceptance and pricing.
Manage landfills with advanced environmental controls
Leachate collection, gas capture and composite liner integrity are actively managed to prevent offsite migration and preserve asset value; engineered liners and collection systems typically achieve containment improvements measured in orders of magnitude. Gas-to-energy projects capture 60–90% of landfill methane, with flaring as a backup to reduce CO2-equivalent emissions. Strategic cell development and phased closure plans extend operational life and defer capital replacement. Continuous groundwater and air monitoring protects community health and regulatory compliance.
Operate water and wastewater treatment assets
Membrane, biological and advanced oxidation processes deliver compliance-grade effluent (typical targets: <1 mg/L TSS, >4-log pathogen reduction) while sludge management with anaerobic digestion and nutrient recovery cuts disposal costs and can offset ~30% of OPEX. Reuse schemes supply agriculture and industry, supporting reclaimed-water revenues; SCADA-driven control improves reliability and trims energy use by up to 20% in modern plants (2024 industry data).
- Processes: membrane | biological | AOP
- Sludge: digestion & resource recovery — ~30% OPEX offset
- Reuse: agriculture & industry supply, revenue generation
- Controls: SCADA — up to 20% energy reduction (2024)
Project development and stakeholder engagement
Identify, permit, and finance new facilities and upgrades with typical permitting timelines of 2–5 years and project finance structures using 60–80% debt leverage; capital needs often range in the tens of millions per facility. Community outreach builds social license, addressing concerns and reducing delays. Tendering and PPP negotiations secure 15–25 year revenue streams while ESG reporting and third‑party audits (2024: rising regulatory scrutiny) demonstrate impact and transparency.
- Permitting: 2–5 years
- Leverage: 60–80% debt
- PPP terms: 15–25 years
- ESG audits: 3rd‑party verified (2024 focus)
High-throughput waste-to-energy sites: 300-3,000 t/day, 20-28% elec eff, 60-80% CHP
Operate high-throughput facilities (300–3,000 t/day) targeting 20–28% net electrical efficiency or 60–80% CHP, with CEMS and predictive maintenance driving 1–3% annual gains. Material recovery facilities average ~75% recovery; contamination <8% and AD yields 100–200 m3/ton. Permitting 2–5 years, leverage 60–80%, project CAPEX typically tens of millions per site.
| Metric | 2024 Value |
|---|---|
| Throughput | 300–3,000 t/day |
| Net elec eff | 20–28% |
| CHP | 60–80% |
| MRF recovery | ~75% |
| AD biogas | 100–200 m3/ton |
| Permitting | 2–5 years |
| Leverage | 60–80% |
| CAPEX | Tens of millions |
Full Version Awaits
Business Model Canvas
The document previewed here is the exact Veridis Environment Business Model Canvas you will receive—no mockups or samples. Upon purchase you’ll get this same complete, editable file ready for presentation and implementation. What you see is what you’ll own.
Description
Business Model Canvas: Scalable, Investor-Ready Clean-Technology Strategy
Unlock the strategic blueprint behind Veridis Environment with our in-depth Business Model Canvas. This concise, editable file breaks down value propositions, key partners, revenue streams and cost structure to reveal how the company scales and wins market share. Ideal for investors, founders, and analysts—download the full Canvas in Word/Excel to apply insights and accelerate your strategy.
Partnerships
Municipalities and local authorities
Public-sector partners award concessions for collection, landfill operation and waste-to-energy plants, typically 10–25 year contracts; WtE CAPEX often ranges €150–400m per facility. Long-term service contracts secure >80% feedstock certainty and predictable revenue streams. Joint planning aligns projects with local sustainability targets, regulatory standards and can cut routing and collection costs up to 15%, improving community acceptance.
National regulators and environmental agencies
Partnerships with ministries and regulators secure permits and align Veridis with compliance frameworks such as the EU municipal waste recycling targets (55% by 2025, 60% by 2030, 65% by 2035) and evolving water reuse standards; continuous engagement helps anticipate policy shifts on waste diversion and water reuse. Joint working groups streamline monitoring and reporting requirements, improving compliance credibility and reducing project risk and financing costs.
Technology vendors and EPC contractors
Technology vendors supplying WtE boilers, anaerobic digestion, MRF automation, membranes and SCADA systems drive thermal and biochemical efficiency and, as of 2024, enable industrial-scale plants to target >95% operational availability; EPC partners deliver turnkey builds to schedule and budget, with multi-year service agreements (typically 5–15 years) keeping uptime high and lifecycle costs predictable, while co-development deals accelerate piloting of novel treatment and sorting technologies.
Financial institutions and infrastructure investors
- Project finance
- Green bonds
- PPP structures
- Risk & governance
- Sustainability-linked financing
Industrial and commercial waste generators
Anchor industrial and commercial clients secure steady waste volumes and wastewater loads, supporting predictable throughput and linking to a global C&I waste market estimated at about USD 300 billion in 2024; collaboration enables tailored pre-treatment, segregation, and pickup schedules that cut processing variability. Data-sharing with clients measurably improves diversion rates and cost visibility, while multi-year contracts stabilize revenues and operational planning.
- Anchor clients: steady feedstock, lower variability
- Collaboration: tailored pre-treatment and pickup
- Data-sharing: higher diversion, clearer costs
- Long-term contracts: revenue and planning stability
Public 10–25y concessions, WtE CAPEX €150–400m, ≥95% uptime, €500bn green bonds
Public partners provide 10–25y concessions; WtE CAPEX €150–400m/project and >80% feedstock certainty. Tech & EPC partners enable >95% availability (2024); financial partners supply project finance and green bonds (issuance €≈500bn 2023). Anchor C&I clients tap a global C&I waste market ≈USD300bn (2024) and secure multi‑year volumes.
| Partner | Key metric | Impact |
|---|---|---|
| Public | 10–25y concessions | Revenue certainty |
| Tech/EPC | ≥95% availability (2024) | Operational reliability |
| Finance | Green bonds €500bn (2023) | CAPEX funding |
| Anchor clients | USD300bn market (2024) | Stable feedstock |
What is included in the product
Detailed Word Document
A comprehensive, pre-written Business Model Canvas for Veridis Environment, organized into the 9 classic BMC blocks with full narratives, value propositions, channels and customer segments, plus linked SWOT and competitive-advantage insights ideal for investor presentations and strategic analysis.
Customizable Excel Spreadsheet
Editable one-page Business Model Canvas that condenses Veridis Environment’s strategy, eliminating tedious formatting, accelerating cross-team alignment, and enabling rapid scenario comparison for faster decision-making.
Activities
Operate waste-to-energy and recovery facilities
Daily operations target maximum throughput (300–3,000 t/day) and heat-rate efficiency, meeting 2024 benchmarks of 20–28% net electrical efficiency and CHP up to 60–80% when heat is utilized. Continuous emissions monitoring (CEMS) ensures regulatory compliance with EU/US limits and real-time reporting. Controlled ash handling (10–25% residual mass), optimized energy dispatch, and predictive maintenance reduce OPEX and maximize revenue. Performance analytics deliver year-on-year efficiency gains, typically 1–3% annually in modern plants.
Run recycling, MRFs, and organics processing
Sorting, baling, and contamination control raise material recovery—industry 2024 MRFs average ~75% recovery and contamination reduction to under 8% can boost usable yield by ~10–15%. Long-term offtake contracts (commonly 3–5 years) secure steady sales and stabilize revenue against 2024 recyclate price volatility. Organics are handled via composting or anaerobic digestion, with AD systems delivering biogas yields of 100–200 m3/ton wet feedstock. Rigorous quality assurance preserves market acceptance and pricing.
Manage landfills with advanced environmental controls
Leachate collection, gas capture and composite liner integrity are actively managed to prevent offsite migration and preserve asset value; engineered liners and collection systems typically achieve containment improvements measured in orders of magnitude. Gas-to-energy projects capture 60–90% of landfill methane, with flaring as a backup to reduce CO2-equivalent emissions. Strategic cell development and phased closure plans extend operational life and defer capital replacement. Continuous groundwater and air monitoring protects community health and regulatory compliance.
Operate water and wastewater treatment assets
Membrane, biological and advanced oxidation processes deliver compliance-grade effluent (typical targets: <1 mg/L TSS, >4-log pathogen reduction) while sludge management with anaerobic digestion and nutrient recovery cuts disposal costs and can offset ~30% of OPEX. Reuse schemes supply agriculture and industry, supporting reclaimed-water revenues; SCADA-driven control improves reliability and trims energy use by up to 20% in modern plants (2024 industry data).
- Processes: membrane | biological | AOP
- Sludge: digestion & resource recovery — ~30% OPEX offset
- Reuse: agriculture & industry supply, revenue generation
- Controls: SCADA — up to 20% energy reduction (2024)
Project development and stakeholder engagement
Identify, permit, and finance new facilities and upgrades with typical permitting timelines of 2–5 years and project finance structures using 60–80% debt leverage; capital needs often range in the tens of millions per facility. Community outreach builds social license, addressing concerns and reducing delays. Tendering and PPP negotiations secure 15–25 year revenue streams while ESG reporting and third‑party audits (2024: rising regulatory scrutiny) demonstrate impact and transparency.
- Permitting: 2–5 years
- Leverage: 60–80% debt
- PPP terms: 15–25 years
- ESG audits: 3rd‑party verified (2024 focus)
High-throughput waste-to-energy sites: 300-3,000 t/day, 20-28% elec eff, 60-80% CHP
Operate high-throughput facilities (300–3,000 t/day) targeting 20–28% net electrical efficiency or 60–80% CHP, with CEMS and predictive maintenance driving 1–3% annual gains. Material recovery facilities average ~75% recovery; contamination <8% and AD yields 100–200 m3/ton. Permitting 2–5 years, leverage 60–80%, project CAPEX typically tens of millions per site.
| Metric | 2024 Value |
|---|---|
| Throughput | 300–3,000 t/day |
| Net elec eff | 20–28% |
| CHP | 60–80% |
| MRF recovery | ~75% |
| AD biogas | 100–200 m3/ton |
| Permitting | 2–5 years |
| Leverage | 60–80% |
| CAPEX | Tens of millions |
Full Version Awaits
Business Model Canvas
The document previewed here is the exact Veridis Environment Business Model Canvas you will receive—no mockups or samples. Upon purchase you’ll get this same complete, editable file ready for presentation and implementation. What you see is what you’ll own.











