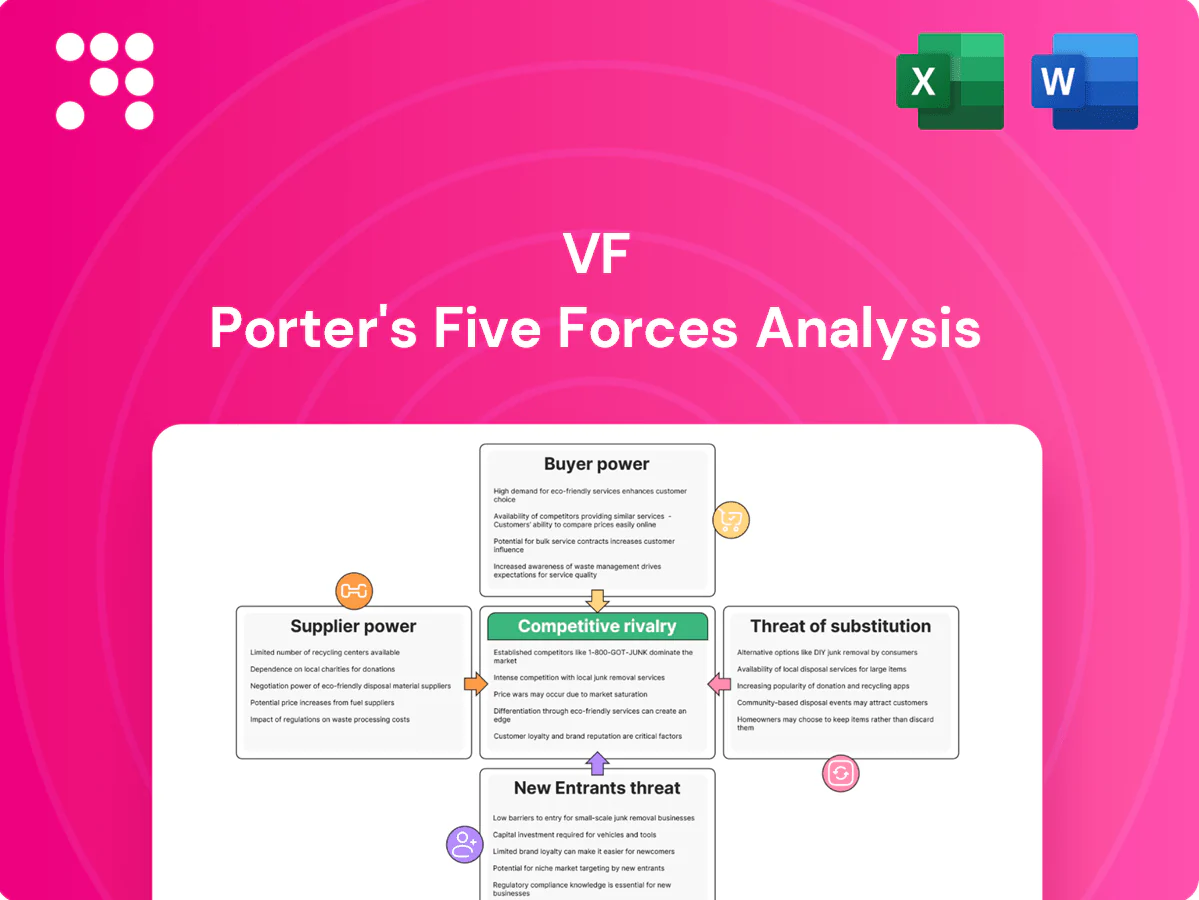
VF Porter's Five Forces Analysis

Elevate Your Analysis with the Complete Porter's Five Forces Analysis
VF's Porter's Five Forces snapshot highlights competitive rivalry, supplier and buyer pressures, substitute threats, and barriers to entry shaping its apparel and outdoor segments. The summary reveals strengths and vulnerabilities across VF’s brand portfolio and distribution channels. Ready to move beyond the basics? Unlock the full Porter's Five Forces Analysis to explore VF’s competitive dynamics, market pressures, and strategic advantages in detail.
Suppliers Bargaining Power

Diversified sourcing dampens leverage
With a broad, global supplier base across apparel, footwear and accessories, VF leverages multi-sourcing to reduce single-vendor dependence and enable competitive bidding; the company operates in more than 170 countries (FY2024 footprint) which supports regional risk balancing.
Input cost volatility raises pressure
Input cost volatility — from cotton and synthetics to leather and energy — has increased suppliers’ ability to pass through price rises; freight cost normalization after 2022 still saw Drewry’s World Container Index decline over 70% from peak to 2024, while commodity swings remain material. Currency fluctuations and higher freight fuel uncertainty, forcing VF to hedge, redesign products, or re-engineer sourcing. Short-term spikes can shift margin share to suppliers, compressing VF’s gross margins until costs normalize.

Specialized materials create pockets of power
Performance textiles, proprietary trims, and technical footwear components are often concentrated among a few specialists (for example, membrane tech used in VF brands like The North Face FUTURELIGHT), creating supplier pockets of power. Unique capabilities such as waterproof membranes and custom midsoles raise switching costs and dependency. Co-development agreements frequently lock in volumes and pricing floors, reinforcing supplier leverage. This dynamic elevates supplier bargaining power in VF’s innovation-led lines.

Capacity and lead-time constraints
Tight labor markets (US unemployment ~4.0% in mid-2024) and peak-season factory utilization often exceeding 85–95% in Asia give suppliers leverage over schedules and minimums, forcing brands into longer production queues and higher MOQs.
Footwear and tooling lead times commonly run 8–16 weeks, limiting rapid vendor changes; priority allocation during spikes often demands price concessions, increasing speed-to-market delays and inventory risk.
- High factory utilization: 85–95%
- Tooling/lead times: 8–16 weeks
- Labor tightness: US ~4.0% (mid-2024)
- Effects: higher MOQs, price concessions, inventory timing risk
Compliance and nearshoring trade-offs
- ESG squeeze: smaller pool, higher supplier leverage
- Premiums: certified suppliers +5–10%
- Nearshoring: agility vs unit cost +10–25%
- VF strategy: balance ethics, cost, resilience
Multi-source supply (>170 countries) cuts single-vendor risk; suppliers extract +5-25% premiums
VF’s global multi-sourcing across >170 countries (FY2024) reduces single-vendor risk but does not eliminate supplier leverage.
Input cost volatility and freight normalization (Drewry WCI down >70% peak→2024) allow suppliers to pass through price rises, squeezing gross margins.
Specialized tech (membranes, midsoles) and long lead times (8–16 weeks) raise switching costs; factory utilization often 85–95%.
ESG compliance shrinks supplier pool; certified vendors command +5–10% premiums while nearshoring can add +10–25% unit cost.
| Metric | 2024 Value |
|---|---|
| Global footprint | >170 countries |
| Factory utilization | 85–95% |
| Lead times | 8–16 weeks |
| Certified premium | +5–10% |
| Nearshore cost | +10–25% |
What is included in the product
 Detailed Word Document
Comprehensive Porter's Five Forces analysis tailored to VF, revealing competitive intensity, supplier and buyer power, threat of substitutes and new entrants, and strategic barriers that shape its pricing, margins, and long-term market positioning.

 Customizable Excel Spreadsheet
A single-sheet VF Porter's Five Forces summary highlighting supplier, buyer, competitor, substitute and entrant pressures—ideal for rapid strategy checks. Editable pressure sliders and an instant radar chart let you model scenarios without formulas, ready to paste into decks or reports.
Customers Bargaining Power

Wholesale partners exert scale leverage
Large retailers and sporting chains negotiate pricing, terms and shelf placement, with VF's wholesale channel accounting for about 35% of FY2024 revenue and the top 10 wholesale customers representing roughly 28% of sales, concentrating negotiating power. Their volume leverage pressures margins and often requires incremental marketing support and co-op spend equal to several percentage points of wholesale revenue. Chargebacks and returns policies add direct costs and margin erosion, especially in apparel categories. Dependence on wholesale varies by region and brand category.
DTC reduces intermediary power
VF’s owned e-commerce and retail footprint gives greater pricing control and richer customer data, with DTC accounting for roughly half of revenue in 2024. Direct channels weaken wholesale bargaining power and enable rapid test-and-learn assortments to lift margins. VF’s DTC push required significant investment, with capex near $300 million in 2024 for traffic acquisition and fulfillment upgrades.

Brand equity tempers price sensitivity
Iconic VF labels — Vans, The North Face, Timberland — command premiums via loyal communities; Vans alone made roughly one-third of VF’s FY2024 revenue, underscoring brand-led pricing power. Distinct design and storytelling reduce direct comparability, lowering switching for signature products, while limited drops and scarcity strategies preserve price realization and protect margins.

Promo culture heightens deal-seeking
Promo culture trains consumers to wait for sales, with VF reporting roughly $11 billion revenue in 2024 and persistent markdown activity pressuring sell-through. Marketplace transparency accelerates price comparison via platforms, amplifying customer leverage. Wholesale partners use promotions to move volume, increasing margin-dilution risk in soft demand periods.
- Promo-driven buying
- Platform price transparency
- Wholesale volume tactics
- Margin dilution risk
Omnichannel expectations raise demands
Omnichannel expectations force VF to meet rapid replenishment, deep size assortments, and seamless returns; 2024 retail contracts increasingly tied to service-level metrics as VF reported about $11.3 billion revenue in FY2024, where distribution performance directly affects shelf access. Missed SLAs can trigger penalties or lost slot allocations, boosting buyer leverage on operational terms.
- Higher buyer power: SLAs used in negotiation
- Penalties: lost slots/chargebacks reduce margin
- Operational focus: fill rates, return speed, size depth
Wholesale leverage vs DTC resilience — 50% DTC, $11.3B revenue
Wholesale concentration (35% of FY2024 revenue; top 10 ≈28%) gives buyers strong pricing/slot leverage and drives co-op spend/chargebacks. DTC (~50% of 2024 revenue) and brand premiums (Vans ≈33%) restore pricing power. $11.3B revenue and $300M capex sustain omnichannel SLAs that keep buyer pressure.
| Metric | 2024 |
|---|---|
| Wholesale | 35% |
| DTC | 50% |
| Revenue | $11.3B |
Preview the Actual Deliverable
VF Porter's Five Forces Analysis
This preview shows the exact VF Porter's Five Forces Analysis you'll receive immediately after purchase—no placeholders or mockups. The full, professionally formatted document displayed here is ready for download and use the moment you buy. You’re viewing the final deliverable and will get instant access to this identical file upon payment.

Elevate Your Analysis with the Complete Porter's Five Forces Analysis
VF's Porter's Five Forces snapshot highlights competitive rivalry, supplier and buyer pressures, substitute threats, and barriers to entry shaping its apparel and outdoor segments. The summary reveals strengths and vulnerabilities across VF’s brand portfolio and distribution channels. Ready to move beyond the basics? Unlock the full Porter's Five Forces Analysis to explore VF’s competitive dynamics, market pressures, and strategic advantages in detail.
Suppliers Bargaining Power
Diversified sourcing dampens leverage
With a broad, global supplier base across apparel, footwear and accessories, VF leverages multi-sourcing to reduce single-vendor dependence and enable competitive bidding; the company operates in more than 170 countries (FY2024 footprint) which supports regional risk balancing.
Input cost volatility raises pressure
Input cost volatility — from cotton and synthetics to leather and energy — has increased suppliers’ ability to pass through price rises; freight cost normalization after 2022 still saw Drewry’s World Container Index decline over 70% from peak to 2024, while commodity swings remain material. Currency fluctuations and higher freight fuel uncertainty, forcing VF to hedge, redesign products, or re-engineer sourcing. Short-term spikes can shift margin share to suppliers, compressing VF’s gross margins until costs normalize.
Specialized materials create pockets of power
Performance textiles, proprietary trims, and technical footwear components are often concentrated among a few specialists (for example, membrane tech used in VF brands like The North Face FUTURELIGHT), creating supplier pockets of power. Unique capabilities such as waterproof membranes and custom midsoles raise switching costs and dependency. Co-development agreements frequently lock in volumes and pricing floors, reinforcing supplier leverage. This dynamic elevates supplier bargaining power in VF’s innovation-led lines.
Capacity and lead-time constraints
Tight labor markets (US unemployment ~4.0% in mid-2024) and peak-season factory utilization often exceeding 85–95% in Asia give suppliers leverage over schedules and minimums, forcing brands into longer production queues and higher MOQs.
Footwear and tooling lead times commonly run 8–16 weeks, limiting rapid vendor changes; priority allocation during spikes often demands price concessions, increasing speed-to-market delays and inventory risk.
- High factory utilization: 85–95%
- Tooling/lead times: 8–16 weeks
- Labor tightness: US ~4.0% (mid-2024)
- Effects: higher MOQs, price concessions, inventory timing risk
Compliance and nearshoring trade-offs
- ESG squeeze: smaller pool, higher supplier leverage
- Premiums: certified suppliers +5–10%
- Nearshoring: agility vs unit cost +10–25%
- VF strategy: balance ethics, cost, resilience
Multi-source supply (>170 countries) cuts single-vendor risk; suppliers extract +5-25% premiums
VF’s global multi-sourcing across >170 countries (FY2024) reduces single-vendor risk but does not eliminate supplier leverage.
Input cost volatility and freight normalization (Drewry WCI down >70% peak→2024) allow suppliers to pass through price rises, squeezing gross margins.
Specialized tech (membranes, midsoles) and long lead times (8–16 weeks) raise switching costs; factory utilization often 85–95%.
ESG compliance shrinks supplier pool; certified vendors command +5–10% premiums while nearshoring can add +10–25% unit cost.
| Metric | 2024 Value |
|---|---|
| Global footprint | >170 countries |
| Factory utilization | 85–95% |
| Lead times | 8–16 weeks |
| Certified premium | +5–10% |
| Nearshore cost | +10–25% |
What is included in the product
Detailed Word Document
Comprehensive Porter's Five Forces analysis tailored to VF, revealing competitive intensity, supplier and buyer power, threat of substitutes and new entrants, and strategic barriers that shape its pricing, margins, and long-term market positioning.
Customizable Excel Spreadsheet
A single-sheet VF Porter's Five Forces summary highlighting supplier, buyer, competitor, substitute and entrant pressures—ideal for rapid strategy checks. Editable pressure sliders and an instant radar chart let you model scenarios without formulas, ready to paste into decks or reports.
Customers Bargaining Power
Wholesale partners exert scale leverage
Large retailers and sporting chains negotiate pricing, terms and shelf placement, with VF's wholesale channel accounting for about 35% of FY2024 revenue and the top 10 wholesale customers representing roughly 28% of sales, concentrating negotiating power. Their volume leverage pressures margins and often requires incremental marketing support and co-op spend equal to several percentage points of wholesale revenue. Chargebacks and returns policies add direct costs and margin erosion, especially in apparel categories. Dependence on wholesale varies by region and brand category.
DTC reduces intermediary power
VF’s owned e-commerce and retail footprint gives greater pricing control and richer customer data, with DTC accounting for roughly half of revenue in 2024. Direct channels weaken wholesale bargaining power and enable rapid test-and-learn assortments to lift margins. VF’s DTC push required significant investment, with capex near $300 million in 2024 for traffic acquisition and fulfillment upgrades.
Brand equity tempers price sensitivity
Iconic VF labels — Vans, The North Face, Timberland — command premiums via loyal communities; Vans alone made roughly one-third of VF’s FY2024 revenue, underscoring brand-led pricing power. Distinct design and storytelling reduce direct comparability, lowering switching for signature products, while limited drops and scarcity strategies preserve price realization and protect margins.
Promo culture heightens deal-seeking
Promo culture trains consumers to wait for sales, with VF reporting roughly $11 billion revenue in 2024 and persistent markdown activity pressuring sell-through. Marketplace transparency accelerates price comparison via platforms, amplifying customer leverage. Wholesale partners use promotions to move volume, increasing margin-dilution risk in soft demand periods.
- Promo-driven buying
- Platform price transparency
- Wholesale volume tactics
- Margin dilution risk
Omnichannel expectations raise demands
Omnichannel expectations force VF to meet rapid replenishment, deep size assortments, and seamless returns; 2024 retail contracts increasingly tied to service-level metrics as VF reported about $11.3 billion revenue in FY2024, where distribution performance directly affects shelf access. Missed SLAs can trigger penalties or lost slot allocations, boosting buyer leverage on operational terms.
- Higher buyer power: SLAs used in negotiation
- Penalties: lost slots/chargebacks reduce margin
- Operational focus: fill rates, return speed, size depth
Wholesale leverage vs DTC resilience — 50% DTC, $11.3B revenue
Wholesale concentration (35% of FY2024 revenue; top 10 ≈28%) gives buyers strong pricing/slot leverage and drives co-op spend/chargebacks. DTC (~50% of 2024 revenue) and brand premiums (Vans ≈33%) restore pricing power. $11.3B revenue and $300M capex sustain omnichannel SLAs that keep buyer pressure.
| Metric | 2024 |
|---|---|
| Wholesale | 35% |
| DTC | 50% |
| Revenue | $11.3B |
Preview the Actual Deliverable
VF Porter's Five Forces Analysis
This preview shows the exact VF Porter's Five Forces Analysis you'll receive immediately after purchase—no placeholders or mockups. The full, professionally formatted document displayed here is ready for download and use the moment you buy. You’re viewing the final deliverable and will get instant access to this identical file upon payment.
Original: $10.00
-65%$10.00
$3.50Description
Elevate Your Analysis with the Complete Porter's Five Forces Analysis
VF's Porter's Five Forces snapshot highlights competitive rivalry, supplier and buyer pressures, substitute threats, and barriers to entry shaping its apparel and outdoor segments. The summary reveals strengths and vulnerabilities across VF’s brand portfolio and distribution channels. Ready to move beyond the basics? Unlock the full Porter's Five Forces Analysis to explore VF’s competitive dynamics, market pressures, and strategic advantages in detail.
Suppliers Bargaining Power
Diversified sourcing dampens leverage
With a broad, global supplier base across apparel, footwear and accessories, VF leverages multi-sourcing to reduce single-vendor dependence and enable competitive bidding; the company operates in more than 170 countries (FY2024 footprint) which supports regional risk balancing.
Input cost volatility raises pressure
Input cost volatility — from cotton and synthetics to leather and energy — has increased suppliers’ ability to pass through price rises; freight cost normalization after 2022 still saw Drewry’s World Container Index decline over 70% from peak to 2024, while commodity swings remain material. Currency fluctuations and higher freight fuel uncertainty, forcing VF to hedge, redesign products, or re-engineer sourcing. Short-term spikes can shift margin share to suppliers, compressing VF’s gross margins until costs normalize.
Specialized materials create pockets of power
Performance textiles, proprietary trims, and technical footwear components are often concentrated among a few specialists (for example, membrane tech used in VF brands like The North Face FUTURELIGHT), creating supplier pockets of power. Unique capabilities such as waterproof membranes and custom midsoles raise switching costs and dependency. Co-development agreements frequently lock in volumes and pricing floors, reinforcing supplier leverage. This dynamic elevates supplier bargaining power in VF’s innovation-led lines.
Capacity and lead-time constraints
Tight labor markets (US unemployment ~4.0% in mid-2024) and peak-season factory utilization often exceeding 85–95% in Asia give suppliers leverage over schedules and minimums, forcing brands into longer production queues and higher MOQs.
Footwear and tooling lead times commonly run 8–16 weeks, limiting rapid vendor changes; priority allocation during spikes often demands price concessions, increasing speed-to-market delays and inventory risk.
- High factory utilization: 85–95%
- Tooling/lead times: 8–16 weeks
- Labor tightness: US ~4.0% (mid-2024)
- Effects: higher MOQs, price concessions, inventory timing risk
Compliance and nearshoring trade-offs
- ESG squeeze: smaller pool, higher supplier leverage
- Premiums: certified suppliers +5–10%
- Nearshoring: agility vs unit cost +10–25%
- VF strategy: balance ethics, cost, resilience
Multi-source supply (>170 countries) cuts single-vendor risk; suppliers extract +5-25% premiums
VF’s global multi-sourcing across >170 countries (FY2024) reduces single-vendor risk but does not eliminate supplier leverage.
Input cost volatility and freight normalization (Drewry WCI down >70% peak→2024) allow suppliers to pass through price rises, squeezing gross margins.
Specialized tech (membranes, midsoles) and long lead times (8–16 weeks) raise switching costs; factory utilization often 85–95%.
ESG compliance shrinks supplier pool; certified vendors command +5–10% premiums while nearshoring can add +10–25% unit cost.
| Metric | 2024 Value |
|---|---|
| Global footprint | >170 countries |
| Factory utilization | 85–95% |
| Lead times | 8–16 weeks |
| Certified premium | +5–10% |
| Nearshore cost | +10–25% |
What is included in the product
Detailed Word Document
Comprehensive Porter's Five Forces analysis tailored to VF, revealing competitive intensity, supplier and buyer power, threat of substitutes and new entrants, and strategic barriers that shape its pricing, margins, and long-term market positioning.
Customizable Excel Spreadsheet
A single-sheet VF Porter's Five Forces summary highlighting supplier, buyer, competitor, substitute and entrant pressures—ideal for rapid strategy checks. Editable pressure sliders and an instant radar chart let you model scenarios without formulas, ready to paste into decks or reports.
Customers Bargaining Power
Wholesale partners exert scale leverage
Large retailers and sporting chains negotiate pricing, terms and shelf placement, with VF's wholesale channel accounting for about 35% of FY2024 revenue and the top 10 wholesale customers representing roughly 28% of sales, concentrating negotiating power. Their volume leverage pressures margins and often requires incremental marketing support and co-op spend equal to several percentage points of wholesale revenue. Chargebacks and returns policies add direct costs and margin erosion, especially in apparel categories. Dependence on wholesale varies by region and brand category.
DTC reduces intermediary power
VF’s owned e-commerce and retail footprint gives greater pricing control and richer customer data, with DTC accounting for roughly half of revenue in 2024. Direct channels weaken wholesale bargaining power and enable rapid test-and-learn assortments to lift margins. VF’s DTC push required significant investment, with capex near $300 million in 2024 for traffic acquisition and fulfillment upgrades.
Brand equity tempers price sensitivity
Iconic VF labels — Vans, The North Face, Timberland — command premiums via loyal communities; Vans alone made roughly one-third of VF’s FY2024 revenue, underscoring brand-led pricing power. Distinct design and storytelling reduce direct comparability, lowering switching for signature products, while limited drops and scarcity strategies preserve price realization and protect margins.
Promo culture heightens deal-seeking
Promo culture trains consumers to wait for sales, with VF reporting roughly $11 billion revenue in 2024 and persistent markdown activity pressuring sell-through. Marketplace transparency accelerates price comparison via platforms, amplifying customer leverage. Wholesale partners use promotions to move volume, increasing margin-dilution risk in soft demand periods.
- Promo-driven buying
- Platform price transparency
- Wholesale volume tactics
- Margin dilution risk
Omnichannel expectations raise demands
Omnichannel expectations force VF to meet rapid replenishment, deep size assortments, and seamless returns; 2024 retail contracts increasingly tied to service-level metrics as VF reported about $11.3 billion revenue in FY2024, where distribution performance directly affects shelf access. Missed SLAs can trigger penalties or lost slot allocations, boosting buyer leverage on operational terms.
- Higher buyer power: SLAs used in negotiation
- Penalties: lost slots/chargebacks reduce margin
- Operational focus: fill rates, return speed, size depth
Wholesale leverage vs DTC resilience — 50% DTC, $11.3B revenue
Wholesale concentration (35% of FY2024 revenue; top 10 ≈28%) gives buyers strong pricing/slot leverage and drives co-op spend/chargebacks. DTC (~50% of 2024 revenue) and brand premiums (Vans ≈33%) restore pricing power. $11.3B revenue and $300M capex sustain omnichannel SLAs that keep buyer pressure.
| Metric | 2024 |
|---|---|
| Wholesale | 35% |
| DTC | 50% |
| Revenue | $11.3B |
Preview the Actual Deliverable
VF Porter's Five Forces Analysis
This preview shows the exact VF Porter's Five Forces Analysis you'll receive immediately after purchase—no placeholders or mockups. The full, professionally formatted document displayed here is ready for download and use the moment you buy. You’re viewing the final deliverable and will get instant access to this identical file upon payment.











