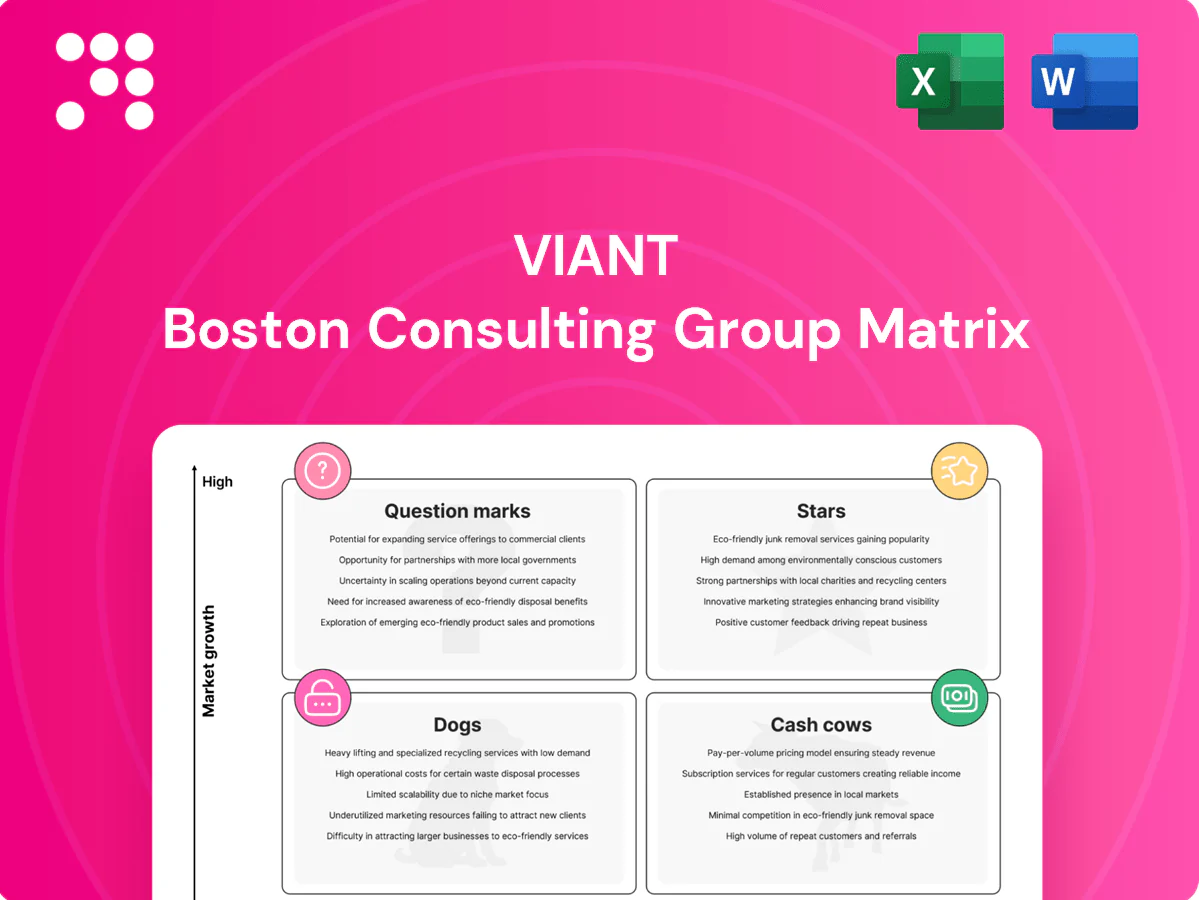
Viant Boston Consulting Group Matrix

Download Your Competitive Advantage
This Viant BCG Matrix preview shows the headlines — who’s winning, who’s bleeding cash, and where the upside hides — but it’s just the map’s outline. Buy the full report to see each product’s quadrant placement, supporting data, and clear, prioritized moves you can act on. You’ll get a ready-to-use Word report plus an Excel summary for board decks and budget decisions. Grab the full matrix and stop guessing—start allocating capital with confidence.
Stars

Adelphic omnichannel DSP
Adelphic omnichannel DSP holds high agency share and rides the >80% programmatic penetration of US digital display in 2024, planning, buying and measuring across CTV, mobile and desktop from a single login for full-funnel attribution. Continued product velocity and integrations are prioritized to defend share; sustaining growth can graduate Adelphic into Viant's primary cash engine.
CTV and premium video buying
Connected TV remains the fastest-growing video channel, with CTV ad spend up about 20% year-over-year in 2024 and Adelphic embedded in that flow; its household-level reach and strong performance give an edge on frequency control and measurable outcomes. It soaks up investment but delivers wins on large brand briefs; retaining premium supply and transparent measurement keeps it a Star in Viant’s BCG matrix.

Household-based identity graph
Cookieless targeting that actually works is scarce — Viant’s household-based identity graph is its signature, mapping at household resolution across roughly 129 million U.S. households to preserve reach and planning as third-party cookies decline.
Household resolution drives planning, reach, and attribution in a privacy-first world, helping recover up to ~30 percent of attribution loss seen in cookieless shifts; it’s defensible and differentiating but requires continuous data stewardship.
Keeping accuracy high via ongoing refreshes and governance powers Viant’s platform, sustaining measurement, eCPM performance, and cross-device reach in 2024 market conditions.

Measurement and closed-loop attribution
Marketers demand proof beyond impressions, prioritizing sales lift, reach, and incrementality tools to justify ad spend and secure renewals; closed-loop attribution ties campaigns to onsite conversions and CRM outcomes. Maintaining methodologies and vendor partnerships requires dedicated analytics teams and tech spend, but yields stickier clients and larger share of wallet through demonstrable ROI.
- Proof over impressions: closed-loop ties ads to conversions
- Retention lever: sales lift & incrementality lock budgets
- Cost: ongoing methodological and partnership resources
- Payoff: higher client stickiness and expanded wallet share
Omnichannel planning and frequency management
Unified pacing and frequency across screens eliminates redundant impressions and, when implemented well, drives measurable media efficiency—2024 industry benchmarks show median CPM reductions near 18% and ROAS uplifts around 20% for coordinated campaigns. Adoption at Viant is strongest in growth accounts and enterprise clients, with automation and UX improvements cited as key retention levers.
- Benefit: ~18% CPM reduction (2024 benchmarks)
- Outcome: ~20% ROAS uplift (2024 benchmarks)
- Adoption: high among growth & enterprise accounts
- Priority: enhance UX and automation to widen moat
>80% reach, -18% CPM, +20%
Adelphic is a Star: high agency share leveraging >80% US programmatic display penetration in 2024, with CTV spend +20% YoY and unified cross-screen planning. Viant’s household graph covers ~129 million US households, recovering ~30% of cookieless attribution loss and sustaining eCPM/ROAS gains. Unified pacing drives ~18% CPM reduction and ~20% ROAS uplift, making product velocity key to defending growth.
| Metric | 2024 Value |
|---|---|
| Programmatic penetration (US display) | >80% |
| CTV ad spend YoY | +20% |
| Households in graph | ~129M |
| Attribution recovery (cookieless) | ~30% |
| CPM reduction (coord. campaigns) | ~18% |
| ROAS uplift | ~20% |
What is included in the product
 Detailed Word Document
Viant BCG Matrix: concise evaluation of each unit across Stars, Cash Cows, Question Marks, and Dogs with clear invest/exit guidance.

 Customizable Excel Spreadsheet
One-page Viant BCG Matrix placing units by growth/share — clean, export-ready, C-suite friendly for fast decision-making
Cash Cows

Display and mobile programmatic spend
Display and mobile programmatic spend represents large, steady budgets—programmatic bought roughly 80% of digital display and mobile inventory in 2024—delivering dependable throughput despite slower category growth. Mature features and stable margins make it a reliable cash cow for Viant, with renewals and trading support sufficient to sustain revenue. Minimal promotional spend is required; focus on optimizing infrastructure and operations to keep take-rates healthy.
Self-serve platform fees
Self-serve platform fees deliver predictable, high-margin license and usage revenue; in 2024 SaaS platforms averaged roughly 75% gross margins, making these cash flows valuable. Once teams are trained churn typically falls and operating cost per client declines, improving unit economics. Light upgrades and enablement sustain productivity; prioritize milking the base while nudging targeted upsells.

Data marketplace integrations
Data marketplace integrations deliver high-margin third-party and curated data add-ons that drive incremental margin for Viant; in 2024 these offerings showed steady monetization across accounts. Growth remains modest but attach rates are strong in enterprise clients, reinforcing predictable recurring revenue. Post-integration maintenance requires limited investment provided quality controls are upheld and bundles are structured to maximize ARPU.

Always-on retargeting and CRM activation
Always-on retargeting and CRM activation are repeatable, evergreen tactics that sustain spend when brands pause big bets; in 2024 they accounted for ~35% of sustained digital conversions and delivered median CRM ROAS ~4x. Low lift to manage and easy to automate, with platform automation cutting manual ops ~60%. Margins rise ~15% with better identity matching, keeping the channel efficient and dependable.
- Repeatable: steady conversion share ~35%
- Low lift: automation reduces ops ~60%
- High ROI: CRM ROAS ~4x (2024)
- Margin uplift: identity match +15%
Agency trading desk relationships
Agency trading desk relationships are cash cows: embedded workflows drive recurring briefs and steady volume, with procurement and terms already set so focus shifts to throughput and service. Light-touch support keeps the pipe warm while QBRs, performance proof and roadmap peeks protect retention and upsell opportunities.
- Embedded workflows = recurring briefs
- Procurement done; focus on throughput
- Light-touch support sustains volume
- Protect via QBRs, performance proof, roadmap
Programmatic drives ~80% spend; CRM retargeting low-lift, ROAS ~4x
Viant cash cows: programmatic display/mobile drove stable throughput (programmatic ~80% of digital display/mobile spend in 2024) with steady margins; self-serve fees show ~75% gross margins (2024) and low churn; data marketplace and agency trading desks provide high-margin attach rates; always-on retargeting/CRM (~35% conversion share, CRM ROAS ~4x) is low‑lift and automatable.
| Segment | 2024 Metric | Impact |
|---|---|---|
| Programmatic | ~80% spend | Stable throughput |
| SaaS fees | ~75% gross margin | High margin |
| Retargeting/CRM | ~35% conv; ROAS ~4x | Low lift |
What You See Is What You Get
Viant BCG Matrix
The Viant BCG Matrix you're previewing on this page is the exact file you'll receive after purchase—no watermarks, no placeholders, just the finished report. It’s crafted for clarity and strategic use, ready to download, edit, or present. Buy once and get the fully formatted document delivered instantly to your inbox—no surprises, no extra steps. Use it straight away in planning, pitches, or stakeholder reviews.

Download Your Competitive Advantage
This Viant BCG Matrix preview shows the headlines — who’s winning, who’s bleeding cash, and where the upside hides — but it’s just the map’s outline. Buy the full report to see each product’s quadrant placement, supporting data, and clear, prioritized moves you can act on. You’ll get a ready-to-use Word report plus an Excel summary for board decks and budget decisions. Grab the full matrix and stop guessing—start allocating capital with confidence.
Stars
Adelphic omnichannel DSP
Adelphic omnichannel DSP holds high agency share and rides the >80% programmatic penetration of US digital display in 2024, planning, buying and measuring across CTV, mobile and desktop from a single login for full-funnel attribution. Continued product velocity and integrations are prioritized to defend share; sustaining growth can graduate Adelphic into Viant's primary cash engine.
CTV and premium video buying
Connected TV remains the fastest-growing video channel, with CTV ad spend up about 20% year-over-year in 2024 and Adelphic embedded in that flow; its household-level reach and strong performance give an edge on frequency control and measurable outcomes. It soaks up investment but delivers wins on large brand briefs; retaining premium supply and transparent measurement keeps it a Star in Viant’s BCG matrix.
Household-based identity graph
Cookieless targeting that actually works is scarce — Viant’s household-based identity graph is its signature, mapping at household resolution across roughly 129 million U.S. households to preserve reach and planning as third-party cookies decline.
Household resolution drives planning, reach, and attribution in a privacy-first world, helping recover up to ~30 percent of attribution loss seen in cookieless shifts; it’s defensible and differentiating but requires continuous data stewardship.
Keeping accuracy high via ongoing refreshes and governance powers Viant’s platform, sustaining measurement, eCPM performance, and cross-device reach in 2024 market conditions.
Measurement and closed-loop attribution
Marketers demand proof beyond impressions, prioritizing sales lift, reach, and incrementality tools to justify ad spend and secure renewals; closed-loop attribution ties campaigns to onsite conversions and CRM outcomes. Maintaining methodologies and vendor partnerships requires dedicated analytics teams and tech spend, but yields stickier clients and larger share of wallet through demonstrable ROI.
- Proof over impressions: closed-loop ties ads to conversions
- Retention lever: sales lift & incrementality lock budgets
- Cost: ongoing methodological and partnership resources
- Payoff: higher client stickiness and expanded wallet share
Omnichannel planning and frequency management
Unified pacing and frequency across screens eliminates redundant impressions and, when implemented well, drives measurable media efficiency—2024 industry benchmarks show median CPM reductions near 18% and ROAS uplifts around 20% for coordinated campaigns. Adoption at Viant is strongest in growth accounts and enterprise clients, with automation and UX improvements cited as key retention levers.
- Benefit: ~18% CPM reduction (2024 benchmarks)
- Outcome: ~20% ROAS uplift (2024 benchmarks)
- Adoption: high among growth & enterprise accounts
- Priority: enhance UX and automation to widen moat
>80% reach, -18% CPM, +20%
Adelphic is a Star: high agency share leveraging >80% US programmatic display penetration in 2024, with CTV spend +20% YoY and unified cross-screen planning. Viant’s household graph covers ~129 million US households, recovering ~30% of cookieless attribution loss and sustaining eCPM/ROAS gains. Unified pacing drives ~18% CPM reduction and ~20% ROAS uplift, making product velocity key to defending growth.
| Metric | 2024 Value |
|---|---|
| Programmatic penetration (US display) | >80% |
| CTV ad spend YoY | +20% |
| Households in graph | ~129M |
| Attribution recovery (cookieless) | ~30% |
| CPM reduction (coord. campaigns) | ~18% |
| ROAS uplift | ~20% |
What is included in the product
Detailed Word Document
Viant BCG Matrix: concise evaluation of each unit across Stars, Cash Cows, Question Marks, and Dogs with clear invest/exit guidance.
Customizable Excel Spreadsheet
One-page Viant BCG Matrix placing units by growth/share — clean, export-ready, C-suite friendly for fast decision-making
Cash Cows
Display and mobile programmatic spend
Display and mobile programmatic spend represents large, steady budgets—programmatic bought roughly 80% of digital display and mobile inventory in 2024—delivering dependable throughput despite slower category growth. Mature features and stable margins make it a reliable cash cow for Viant, with renewals and trading support sufficient to sustain revenue. Minimal promotional spend is required; focus on optimizing infrastructure and operations to keep take-rates healthy.
Self-serve platform fees
Self-serve platform fees deliver predictable, high-margin license and usage revenue; in 2024 SaaS platforms averaged roughly 75% gross margins, making these cash flows valuable. Once teams are trained churn typically falls and operating cost per client declines, improving unit economics. Light upgrades and enablement sustain productivity; prioritize milking the base while nudging targeted upsells.
Data marketplace integrations
Data marketplace integrations deliver high-margin third-party and curated data add-ons that drive incremental margin for Viant; in 2024 these offerings showed steady monetization across accounts. Growth remains modest but attach rates are strong in enterprise clients, reinforcing predictable recurring revenue. Post-integration maintenance requires limited investment provided quality controls are upheld and bundles are structured to maximize ARPU.
Always-on retargeting and CRM activation
Always-on retargeting and CRM activation are repeatable, evergreen tactics that sustain spend when brands pause big bets; in 2024 they accounted for ~35% of sustained digital conversions and delivered median CRM ROAS ~4x. Low lift to manage and easy to automate, with platform automation cutting manual ops ~60%. Margins rise ~15% with better identity matching, keeping the channel efficient and dependable.
- Repeatable: steady conversion share ~35%
- Low lift: automation reduces ops ~60%
- High ROI: CRM ROAS ~4x (2024)
- Margin uplift: identity match +15%
Agency trading desk relationships
Agency trading desk relationships are cash cows: embedded workflows drive recurring briefs and steady volume, with procurement and terms already set so focus shifts to throughput and service. Light-touch support keeps the pipe warm while QBRs, performance proof and roadmap peeks protect retention and upsell opportunities.
- Embedded workflows = recurring briefs
- Procurement done; focus on throughput
- Light-touch support sustains volume
- Protect via QBRs, performance proof, roadmap
Programmatic drives ~80% spend; CRM retargeting low-lift, ROAS ~4x
Viant cash cows: programmatic display/mobile drove stable throughput (programmatic ~80% of digital display/mobile spend in 2024) with steady margins; self-serve fees show ~75% gross margins (2024) and low churn; data marketplace and agency trading desks provide high-margin attach rates; always-on retargeting/CRM (~35% conversion share, CRM ROAS ~4x) is low‑lift and automatable.
| Segment | 2024 Metric | Impact |
|---|---|---|
| Programmatic | ~80% spend | Stable throughput |
| SaaS fees | ~75% gross margin | High margin |
| Retargeting/CRM | ~35% conv; ROAS ~4x | Low lift |
What You See Is What You Get
Viant BCG Matrix
The Viant BCG Matrix you're previewing on this page is the exact file you'll receive after purchase—no watermarks, no placeholders, just the finished report. It’s crafted for clarity and strategic use, ready to download, edit, or present. Buy once and get the fully formatted document delivered instantly to your inbox—no surprises, no extra steps. Use it straight away in planning, pitches, or stakeholder reviews.
Description
Download Your Competitive Advantage
This Viant BCG Matrix preview shows the headlines — who’s winning, who’s bleeding cash, and where the upside hides — but it’s just the map’s outline. Buy the full report to see each product’s quadrant placement, supporting data, and clear, prioritized moves you can act on. You’ll get a ready-to-use Word report plus an Excel summary for board decks and budget decisions. Grab the full matrix and stop guessing—start allocating capital with confidence.
Stars
Adelphic omnichannel DSP
Adelphic omnichannel DSP holds high agency share and rides the >80% programmatic penetration of US digital display in 2024, planning, buying and measuring across CTV, mobile and desktop from a single login for full-funnel attribution. Continued product velocity and integrations are prioritized to defend share; sustaining growth can graduate Adelphic into Viant's primary cash engine.
CTV and premium video buying
Connected TV remains the fastest-growing video channel, with CTV ad spend up about 20% year-over-year in 2024 and Adelphic embedded in that flow; its household-level reach and strong performance give an edge on frequency control and measurable outcomes. It soaks up investment but delivers wins on large brand briefs; retaining premium supply and transparent measurement keeps it a Star in Viant’s BCG matrix.
Household-based identity graph
Cookieless targeting that actually works is scarce — Viant’s household-based identity graph is its signature, mapping at household resolution across roughly 129 million U.S. households to preserve reach and planning as third-party cookies decline.
Household resolution drives planning, reach, and attribution in a privacy-first world, helping recover up to ~30 percent of attribution loss seen in cookieless shifts; it’s defensible and differentiating but requires continuous data stewardship.
Keeping accuracy high via ongoing refreshes and governance powers Viant’s platform, sustaining measurement, eCPM performance, and cross-device reach in 2024 market conditions.
Measurement and closed-loop attribution
Marketers demand proof beyond impressions, prioritizing sales lift, reach, and incrementality tools to justify ad spend and secure renewals; closed-loop attribution ties campaigns to onsite conversions and CRM outcomes. Maintaining methodologies and vendor partnerships requires dedicated analytics teams and tech spend, but yields stickier clients and larger share of wallet through demonstrable ROI.
- Proof over impressions: closed-loop ties ads to conversions
- Retention lever: sales lift & incrementality lock budgets
- Cost: ongoing methodological and partnership resources
- Payoff: higher client stickiness and expanded wallet share
Omnichannel planning and frequency management
Unified pacing and frequency across screens eliminates redundant impressions and, when implemented well, drives measurable media efficiency—2024 industry benchmarks show median CPM reductions near 18% and ROAS uplifts around 20% for coordinated campaigns. Adoption at Viant is strongest in growth accounts and enterprise clients, with automation and UX improvements cited as key retention levers.
- Benefit: ~18% CPM reduction (2024 benchmarks)
- Outcome: ~20% ROAS uplift (2024 benchmarks)
- Adoption: high among growth & enterprise accounts
- Priority: enhance UX and automation to widen moat
>80% reach, -18% CPM, +20%
Adelphic is a Star: high agency share leveraging >80% US programmatic display penetration in 2024, with CTV spend +20% YoY and unified cross-screen planning. Viant’s household graph covers ~129 million US households, recovering ~30% of cookieless attribution loss and sustaining eCPM/ROAS gains. Unified pacing drives ~18% CPM reduction and ~20% ROAS uplift, making product velocity key to defending growth.
| Metric | 2024 Value |
|---|---|
| Programmatic penetration (US display) | >80% |
| CTV ad spend YoY | +20% |
| Households in graph | ~129M |
| Attribution recovery (cookieless) | ~30% |
| CPM reduction (coord. campaigns) | ~18% |
| ROAS uplift | ~20% |
What is included in the product
Detailed Word Document
Viant BCG Matrix: concise evaluation of each unit across Stars, Cash Cows, Question Marks, and Dogs with clear invest/exit guidance.
Customizable Excel Spreadsheet
One-page Viant BCG Matrix placing units by growth/share — clean, export-ready, C-suite friendly for fast decision-making
Cash Cows
Display and mobile programmatic spend
Display and mobile programmatic spend represents large, steady budgets—programmatic bought roughly 80% of digital display and mobile inventory in 2024—delivering dependable throughput despite slower category growth. Mature features and stable margins make it a reliable cash cow for Viant, with renewals and trading support sufficient to sustain revenue. Minimal promotional spend is required; focus on optimizing infrastructure and operations to keep take-rates healthy.
Self-serve platform fees
Self-serve platform fees deliver predictable, high-margin license and usage revenue; in 2024 SaaS platforms averaged roughly 75% gross margins, making these cash flows valuable. Once teams are trained churn typically falls and operating cost per client declines, improving unit economics. Light upgrades and enablement sustain productivity; prioritize milking the base while nudging targeted upsells.
Data marketplace integrations
Data marketplace integrations deliver high-margin third-party and curated data add-ons that drive incremental margin for Viant; in 2024 these offerings showed steady monetization across accounts. Growth remains modest but attach rates are strong in enterprise clients, reinforcing predictable recurring revenue. Post-integration maintenance requires limited investment provided quality controls are upheld and bundles are structured to maximize ARPU.
Always-on retargeting and CRM activation
Always-on retargeting and CRM activation are repeatable, evergreen tactics that sustain spend when brands pause big bets; in 2024 they accounted for ~35% of sustained digital conversions and delivered median CRM ROAS ~4x. Low lift to manage and easy to automate, with platform automation cutting manual ops ~60%. Margins rise ~15% with better identity matching, keeping the channel efficient and dependable.
- Repeatable: steady conversion share ~35%
- Low lift: automation reduces ops ~60%
- High ROI: CRM ROAS ~4x (2024)
- Margin uplift: identity match +15%
Agency trading desk relationships
Agency trading desk relationships are cash cows: embedded workflows drive recurring briefs and steady volume, with procurement and terms already set so focus shifts to throughput and service. Light-touch support keeps the pipe warm while QBRs, performance proof and roadmap peeks protect retention and upsell opportunities.
- Embedded workflows = recurring briefs
- Procurement done; focus on throughput
- Light-touch support sustains volume
- Protect via QBRs, performance proof, roadmap
Programmatic drives ~80% spend; CRM retargeting low-lift, ROAS ~4x
Viant cash cows: programmatic display/mobile drove stable throughput (programmatic ~80% of digital display/mobile spend in 2024) with steady margins; self-serve fees show ~75% gross margins (2024) and low churn; data marketplace and agency trading desks provide high-margin attach rates; always-on retargeting/CRM (~35% conversion share, CRM ROAS ~4x) is low‑lift and automatable.
| Segment | 2024 Metric | Impact |
|---|---|---|
| Programmatic | ~80% spend | Stable throughput |
| SaaS fees | ~75% gross margin | High margin |
| Retargeting/CRM | ~35% conv; ROAS ~4x | Low lift |
What You See Is What You Get
Viant BCG Matrix
The Viant BCG Matrix you're previewing on this page is the exact file you'll receive after purchase—no watermarks, no placeholders, just the finished report. It’s crafted for clarity and strategic use, ready to download, edit, or present. Buy once and get the fully formatted document delivered instantly to your inbox—no surprises, no extra steps. Use it straight away in planning, pitches, or stakeholder reviews.











