VIA Technologies Porter's Five Forces Analysis

Go Beyond the Preview—Access the Full Strategic Report
VIA Technologies faces intense competitive pressures from larger SoC rivals, niche chipset specialists, and evolving customer demands that squeeze margins and innovation cycles. Supplier concentration for legacy process nodes and the rise of low-cost ARM alternatives elevate strategic risk while moderate buyer power forces product differentiation. This brief snapshot only scratches the surface—unlock the full Porter's Five Forces Analysis to explore VIA Technologies’s competitive dynamics, market pressures, and strategic advantages in detail.
Suppliers Bargaining Power

Concentrated foundry dependence
As a fabless designer VIA depends on a few leading foundries, with TSMC holding about 53% of global foundry revenue in 2024 and the top three foundries controlling over 75% of capacity, giving them pricing and allocation leverage. Foundry utilization ran above 90% in 2024, so yield or node tightness can delay product launches and raise wafer costs. Multi-sourcing on mature nodes (28nm and above) can partially mitigate this supplier power.
Critical IP and EDA vendors
Critical IP and EDA vendors concentrate power: the 2024 EDA market is about $13B with Synopsys, Cadence and Siemens holding ~70% share, while ARM architecture powers over 90% of smartphones, making ARM cores, interface IP and EDA tools hard to substitute. Licensing fees, royalties and tool lock-in raise supplier leverage; switching triggers months-long re‑verification and multi‑million dollar costs. Long-term contracts temper price swings but cut strategic flexibility.

OSAT and substrate constraints
Advanced packaging, test and ABF substrate bottlenecks gave OSATs outsized leverage in 2024, with lead times stretching 12–20 weeks and priority queues determining delivery timing. Top OSATs such as ASE, Amkor and JCET control the majority of advanced-pack capacity and can influence pricing and allocation. Packaging choices (fan-out vs. traditional) materially affect thermal and performance targets for embedded and AI edge products, so building preferred-partner status is key to securing capacity.

Specialized components and memories
DDR, LPDDR and high-speed interfaces rely on a few qualified vendors (top 3 control ~80% of DRAM supply), so 2024 tightness can swing BOM costs and delivery timelines; sudden demand spikes have moved component costs ~20% intra-year. Qualification cycles of 6–12 months make rapid vendor switches risky, while strategic buffer inventory and broader AVL materially reduce disruption risk.
- Market concentration: top 3 ≈80%
- Qualification: 6–12 months
- Mitigation: 3–6 months buffer, 4+ AVL manufacturers
Geopolitical and logistics risk
Regional concentration in Taiwan and East Asia—Taiwan alone held about 54% of global wafer foundry revenue in 2024—amplifies supplier leverage during geopolitical or natural disruptions. US export controls since 2023 and sanctions can block access to EUV tools and IP, forcing longer lead times and 10–30% expedite premiums for scarce parts. Diversified sourcing and design-for-alternates materially reduce this exposure.
- Taiwan 54% foundry revenue (2024)
- US export controls 2023 restrict advanced tools
- Lead-time shocks → 10–30% expedite premiums
- Hedge: supply diversification, design-for-alternates
Foundry & IP squeeze — TSMC 53% (top-3 >75%), EDA $13B, ARM >90%, OSAT delays
VIA's fabless model faces strong foundry power: TSMC ~53% of revenue and top‑3 >75% (2024), utilization >90% raising wafer costs and delays. EDA/IP concentration: $13B EDA market with Synopsys/Cadence/Siemens ~70% and ARM >90% smartphone ISA share, causing high switching costs. OSAT/DRAM bottlenecks (OSAT lead times 12–20wks; DRAM top‑3 ~80%) yield 10–30% expedite premiums.
| Metric | 2024 Value |
|---|---|
| TSMC share | 53% |
| Top‑3 foundries | >75% |
| Foundry utilization | >90% |
| EDA market | $13B |
| Top EDA vendors | ~70% |
| ARM smartphone share | >90% |
| OSAT lead times | 12–20 wks |
| DRAM top‑3 | ~80% |
| Taiwan foundry rev | 54% |
| Expedite premium | 10–30% |
What is included in the product
 Detailed Word Document
Uncovers competitive drivers, supplier and buyer power, entry barriers, and substitute threats shaping VIA Technologies' profitability, delivering tailored strategic insights on disruptive risks and defensive levers.

 Customizable Excel Spreadsheet
A concise Porter's Five Forces one-sheet for VIA Technologies — instantly highlights chipset market threats, supplier/customer bargaining power and substitute risks to relieve strategic uncertainty. Customizable pressure levels and a ready-to-use radar chart make it slide-ready, no macros required.
Customers Bargaining Power

Fragmented but savvy OEM base
Industrial, transport and IoT OEMs are fragmented but technically sophisticated, routinely benchmarking VIA against NXP, Renesas, Intel, AMD and Qualcomm; many OEMs treat feature-for-price comparisons as procurement standard, increasing buyer leverage. Multi-year longevity commitments (commonly 7–10 years) and embedded software stacks materially reduce price sensitivity, while value-added services and certified reference designs shift negotiations toward total cost of ownership.
Design-win stickiness vs. upfront concessions
Once VIA silicon is designed into a system, switching costs rise as validation and safety certifications create multi-year barriers to change, and embedded product lifecycles frequently exceed five years.
Buyers press for NRE support, roadmap visibility and volume discounts before committing, forcing VIA to subsidize early development and accept lower margins to secure design wins in automotive, industrial and IoT verticals.
VIA’s short-term margin tradeoffs for lock-in are offset over long product lifecycles when stable production volumes and certification amortization restore pricing power.

Alternative platforms abound
As of 2024 customers can switch among NVIDIA Jetson, ARM MCUs, and Google Edge TPU for many AI/edge workloads, and the availability of hundreds of off-the-shelf modules and reference designs raises substitution ease. This abundance strengthens buyer negotiation power, though differences in power efficiency and mature SDKs — often decisive in procurement — help vendors defend against switching.

Service-level and longevity demands
Industrial buyers demand 7–10+ years of availability and strict SLAs for embedded platforms; inability to guarantee longevity shifts pricing and contract leverage to buyers. Extended support, security updates and certified migration paths serve as negotiation levers, and VIA can reclaim margin by bundling long-term support, warranties and managed services into higher-value offerings.
- 7–10+ years availability
- Strict SLAs shift leverage to buyers
- Support/security updates as bargaining chips
- Bundle services to reclaim value
Global pricing transparency
Global pricing transparency forces VIA to show ASPs and common discounts across channel distribution and online benchmarks, with e-commerce representing about 22% of global retail in 2024 which amplifies visibility. Buyers use that visibility to extract better terms, making volume-tier pricing and rebates standard expectations; region-specific bundles help protect margins while meeting targets.
- Channel exposure: public ASPs and discounts
- Buyer leverage: exploit visibility for better terms
- Pricing norms: volume tiers and rebates expected
- Margin defense: region-specific bundles
Fragmented buyers extract discounts; ~22%, 7-10+yr support
Buyers are fragmented yet technically sophisticated, leveraging feature-for-price benchmarks and public ASPs (e-commerce ~22% of retail in 2024) to extract volume discounts and NRE support. Multi-year availability (7–10+ years) and certification create high switching costs, but dozens of off-the-shelf modules and alternatives (NVIDIA, ARM, Google) raise substitution threat. VIA reclaims margin via bundled long-term support, SLAs and certified migration paths.
| Metric | 2024 Value |
|---|---|
| Global e‑commerce share | ~22% |
| Required longevity | 7–10+ years |
| Top substitutes | NVIDIA Jetson, ARM MCUs, Google Edge TPU |
Full Version Awaits
VIA Technologies Porter's Five Forces Analysis
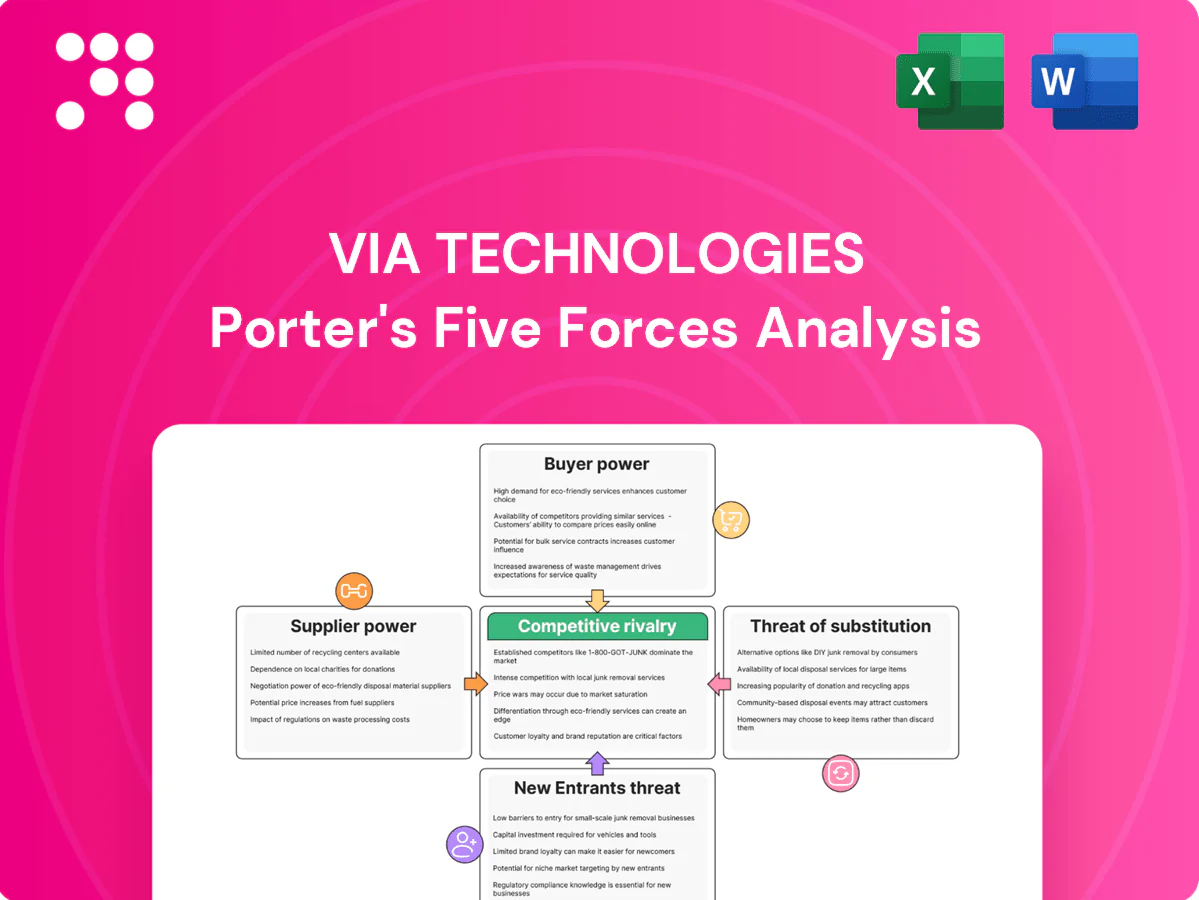
This VIA Technologies Porter's Five Forces Analysis presents a thorough evaluation of competitive rivalry, supplier and buyer power, threats of new entrants and substitutes, and strategic implications. This preview is the exact, fully formatted document you will receive immediately after purchase—no placeholders or samples. Use it instantly for decision-making, presentations, or further research.

Go Beyond the Preview—Access the Full Strategic Report
VIA Technologies faces intense competitive pressures from larger SoC rivals, niche chipset specialists, and evolving customer demands that squeeze margins and innovation cycles. Supplier concentration for legacy process nodes and the rise of low-cost ARM alternatives elevate strategic risk while moderate buyer power forces product differentiation. This brief snapshot only scratches the surface—unlock the full Porter's Five Forces Analysis to explore VIA Technologies’s competitive dynamics, market pressures, and strategic advantages in detail.
Suppliers Bargaining Power
Concentrated foundry dependence
As a fabless designer VIA depends on a few leading foundries, with TSMC holding about 53% of global foundry revenue in 2024 and the top three foundries controlling over 75% of capacity, giving them pricing and allocation leverage. Foundry utilization ran above 90% in 2024, so yield or node tightness can delay product launches and raise wafer costs. Multi-sourcing on mature nodes (28nm and above) can partially mitigate this supplier power.
Critical IP and EDA vendors
Critical IP and EDA vendors concentrate power: the 2024 EDA market is about $13B with Synopsys, Cadence and Siemens holding ~70% share, while ARM architecture powers over 90% of smartphones, making ARM cores, interface IP and EDA tools hard to substitute. Licensing fees, royalties and tool lock-in raise supplier leverage; switching triggers months-long re‑verification and multi‑million dollar costs. Long-term contracts temper price swings but cut strategic flexibility.
OSAT and substrate constraints
Advanced packaging, test and ABF substrate bottlenecks gave OSATs outsized leverage in 2024, with lead times stretching 12–20 weeks and priority queues determining delivery timing. Top OSATs such as ASE, Amkor and JCET control the majority of advanced-pack capacity and can influence pricing and allocation. Packaging choices (fan-out vs. traditional) materially affect thermal and performance targets for embedded and AI edge products, so building preferred-partner status is key to securing capacity.
Specialized components and memories
DDR, LPDDR and high-speed interfaces rely on a few qualified vendors (top 3 control ~80% of DRAM supply), so 2024 tightness can swing BOM costs and delivery timelines; sudden demand spikes have moved component costs ~20% intra-year. Qualification cycles of 6–12 months make rapid vendor switches risky, while strategic buffer inventory and broader AVL materially reduce disruption risk.
- Market concentration: top 3 ≈80%
- Qualification: 6–12 months
- Mitigation: 3–6 months buffer, 4+ AVL manufacturers
Geopolitical and logistics risk
Regional concentration in Taiwan and East Asia—Taiwan alone held about 54% of global wafer foundry revenue in 2024—amplifies supplier leverage during geopolitical or natural disruptions. US export controls since 2023 and sanctions can block access to EUV tools and IP, forcing longer lead times and 10–30% expedite premiums for scarce parts. Diversified sourcing and design-for-alternates materially reduce this exposure.
- Taiwan 54% foundry revenue (2024)
- US export controls 2023 restrict advanced tools
- Lead-time shocks → 10–30% expedite premiums
- Hedge: supply diversification, design-for-alternates
Foundry & IP squeeze — TSMC 53% (top-3 >75%), EDA $13B, ARM >90%, OSAT delays
VIA's fabless model faces strong foundry power: TSMC ~53% of revenue and top‑3 >75% (2024), utilization >90% raising wafer costs and delays. EDA/IP concentration: $13B EDA market with Synopsys/Cadence/Siemens ~70% and ARM >90% smartphone ISA share, causing high switching costs. OSAT/DRAM bottlenecks (OSAT lead times 12–20wks; DRAM top‑3 ~80%) yield 10–30% expedite premiums.
| Metric | 2024 Value |
|---|---|
| TSMC share | 53% |
| Top‑3 foundries | >75% |
| Foundry utilization | >90% |
| EDA market | $13B |
| Top EDA vendors | ~70% |
| ARM smartphone share | >90% |
| OSAT lead times | 12–20 wks |
| DRAM top‑3 | ~80% |
| Taiwan foundry rev | 54% |
| Expedite premium | 10–30% |
What is included in the product
Detailed Word Document
Uncovers competitive drivers, supplier and buyer power, entry barriers, and substitute threats shaping VIA Technologies' profitability, delivering tailored strategic insights on disruptive risks and defensive levers.
Customizable Excel Spreadsheet
A concise Porter's Five Forces one-sheet for VIA Technologies — instantly highlights chipset market threats, supplier/customer bargaining power and substitute risks to relieve strategic uncertainty. Customizable pressure levels and a ready-to-use radar chart make it slide-ready, no macros required.
Customers Bargaining Power
Fragmented but savvy OEM base
Industrial, transport and IoT OEMs are fragmented but technically sophisticated, routinely benchmarking VIA against NXP, Renesas, Intel, AMD and Qualcomm; many OEMs treat feature-for-price comparisons as procurement standard, increasing buyer leverage. Multi-year longevity commitments (commonly 7–10 years) and embedded software stacks materially reduce price sensitivity, while value-added services and certified reference designs shift negotiations toward total cost of ownership.
Design-win stickiness vs. upfront concessions
Once VIA silicon is designed into a system, switching costs rise as validation and safety certifications create multi-year barriers to change, and embedded product lifecycles frequently exceed five years.
Buyers press for NRE support, roadmap visibility and volume discounts before committing, forcing VIA to subsidize early development and accept lower margins to secure design wins in automotive, industrial and IoT verticals.
VIA’s short-term margin tradeoffs for lock-in are offset over long product lifecycles when stable production volumes and certification amortization restore pricing power.
Alternative platforms abound
As of 2024 customers can switch among NVIDIA Jetson, ARM MCUs, and Google Edge TPU for many AI/edge workloads, and the availability of hundreds of off-the-shelf modules and reference designs raises substitution ease. This abundance strengthens buyer negotiation power, though differences in power efficiency and mature SDKs — often decisive in procurement — help vendors defend against switching.
Service-level and longevity demands
Industrial buyers demand 7–10+ years of availability and strict SLAs for embedded platforms; inability to guarantee longevity shifts pricing and contract leverage to buyers. Extended support, security updates and certified migration paths serve as negotiation levers, and VIA can reclaim margin by bundling long-term support, warranties and managed services into higher-value offerings.
- 7–10+ years availability
- Strict SLAs shift leverage to buyers
- Support/security updates as bargaining chips
- Bundle services to reclaim value
Global pricing transparency
Global pricing transparency forces VIA to show ASPs and common discounts across channel distribution and online benchmarks, with e-commerce representing about 22% of global retail in 2024 which amplifies visibility. Buyers use that visibility to extract better terms, making volume-tier pricing and rebates standard expectations; region-specific bundles help protect margins while meeting targets.
- Channel exposure: public ASPs and discounts
- Buyer leverage: exploit visibility for better terms
- Pricing norms: volume tiers and rebates expected
- Margin defense: region-specific bundles
Fragmented buyers extract discounts; ~22%, 7-10+yr support
Buyers are fragmented yet technically sophisticated, leveraging feature-for-price benchmarks and public ASPs (e-commerce ~22% of retail in 2024) to extract volume discounts and NRE support. Multi-year availability (7–10+ years) and certification create high switching costs, but dozens of off-the-shelf modules and alternatives (NVIDIA, ARM, Google) raise substitution threat. VIA reclaims margin via bundled long-term support, SLAs and certified migration paths.
| Metric | 2024 Value |
|---|---|
| Global e‑commerce share | ~22% |
| Required longevity | 7–10+ years |
| Top substitutes | NVIDIA Jetson, ARM MCUs, Google Edge TPU |
Full Version Awaits
VIA Technologies Porter's Five Forces Analysis
This VIA Technologies Porter's Five Forces Analysis presents a thorough evaluation of competitive rivalry, supplier and buyer power, threats of new entrants and substitutes, and strategic implications. This preview is the exact, fully formatted document you will receive immediately after purchase—no placeholders or samples. Use it instantly for decision-making, presentations, or further research.
Original: $10.00
-65%$10.00
$3.50Description
Go Beyond the Preview—Access the Full Strategic Report
VIA Technologies faces intense competitive pressures from larger SoC rivals, niche chipset specialists, and evolving customer demands that squeeze margins and innovation cycles. Supplier concentration for legacy process nodes and the rise of low-cost ARM alternatives elevate strategic risk while moderate buyer power forces product differentiation. This brief snapshot only scratches the surface—unlock the full Porter's Five Forces Analysis to explore VIA Technologies’s competitive dynamics, market pressures, and strategic advantages in detail.
Suppliers Bargaining Power
Concentrated foundry dependence
As a fabless designer VIA depends on a few leading foundries, with TSMC holding about 53% of global foundry revenue in 2024 and the top three foundries controlling over 75% of capacity, giving them pricing and allocation leverage. Foundry utilization ran above 90% in 2024, so yield or node tightness can delay product launches and raise wafer costs. Multi-sourcing on mature nodes (28nm and above) can partially mitigate this supplier power.
Critical IP and EDA vendors
Critical IP and EDA vendors concentrate power: the 2024 EDA market is about $13B with Synopsys, Cadence and Siemens holding ~70% share, while ARM architecture powers over 90% of smartphones, making ARM cores, interface IP and EDA tools hard to substitute. Licensing fees, royalties and tool lock-in raise supplier leverage; switching triggers months-long re‑verification and multi‑million dollar costs. Long-term contracts temper price swings but cut strategic flexibility.
OSAT and substrate constraints
Advanced packaging, test and ABF substrate bottlenecks gave OSATs outsized leverage in 2024, with lead times stretching 12–20 weeks and priority queues determining delivery timing. Top OSATs such as ASE, Amkor and JCET control the majority of advanced-pack capacity and can influence pricing and allocation. Packaging choices (fan-out vs. traditional) materially affect thermal and performance targets for embedded and AI edge products, so building preferred-partner status is key to securing capacity.
Specialized components and memories
DDR, LPDDR and high-speed interfaces rely on a few qualified vendors (top 3 control ~80% of DRAM supply), so 2024 tightness can swing BOM costs and delivery timelines; sudden demand spikes have moved component costs ~20% intra-year. Qualification cycles of 6–12 months make rapid vendor switches risky, while strategic buffer inventory and broader AVL materially reduce disruption risk.
- Market concentration: top 3 ≈80%
- Qualification: 6–12 months
- Mitigation: 3–6 months buffer, 4+ AVL manufacturers
Geopolitical and logistics risk
Regional concentration in Taiwan and East Asia—Taiwan alone held about 54% of global wafer foundry revenue in 2024—amplifies supplier leverage during geopolitical or natural disruptions. US export controls since 2023 and sanctions can block access to EUV tools and IP, forcing longer lead times and 10–30% expedite premiums for scarce parts. Diversified sourcing and design-for-alternates materially reduce this exposure.
- Taiwan 54% foundry revenue (2024)
- US export controls 2023 restrict advanced tools
- Lead-time shocks → 10–30% expedite premiums
- Hedge: supply diversification, design-for-alternates
Foundry & IP squeeze — TSMC 53% (top-3 >75%), EDA $13B, ARM >90%, OSAT delays
VIA's fabless model faces strong foundry power: TSMC ~53% of revenue and top‑3 >75% (2024), utilization >90% raising wafer costs and delays. EDA/IP concentration: $13B EDA market with Synopsys/Cadence/Siemens ~70% and ARM >90% smartphone ISA share, causing high switching costs. OSAT/DRAM bottlenecks (OSAT lead times 12–20wks; DRAM top‑3 ~80%) yield 10–30% expedite premiums.
| Metric | 2024 Value |
|---|---|
| TSMC share | 53% |
| Top‑3 foundries | >75% |
| Foundry utilization | >90% |
| EDA market | $13B |
| Top EDA vendors | ~70% |
| ARM smartphone share | >90% |
| OSAT lead times | 12–20 wks |
| DRAM top‑3 | ~80% |
| Taiwan foundry rev | 54% |
| Expedite premium | 10–30% |
What is included in the product
Detailed Word Document
Uncovers competitive drivers, supplier and buyer power, entry barriers, and substitute threats shaping VIA Technologies' profitability, delivering tailored strategic insights on disruptive risks and defensive levers.
Customizable Excel Spreadsheet
A concise Porter's Five Forces one-sheet for VIA Technologies — instantly highlights chipset market threats, supplier/customer bargaining power and substitute risks to relieve strategic uncertainty. Customizable pressure levels and a ready-to-use radar chart make it slide-ready, no macros required.
Customers Bargaining Power
Fragmented but savvy OEM base
Industrial, transport and IoT OEMs are fragmented but technically sophisticated, routinely benchmarking VIA against NXP, Renesas, Intel, AMD and Qualcomm; many OEMs treat feature-for-price comparisons as procurement standard, increasing buyer leverage. Multi-year longevity commitments (commonly 7–10 years) and embedded software stacks materially reduce price sensitivity, while value-added services and certified reference designs shift negotiations toward total cost of ownership.
Design-win stickiness vs. upfront concessions
Once VIA silicon is designed into a system, switching costs rise as validation and safety certifications create multi-year barriers to change, and embedded product lifecycles frequently exceed five years.
Buyers press for NRE support, roadmap visibility and volume discounts before committing, forcing VIA to subsidize early development and accept lower margins to secure design wins in automotive, industrial and IoT verticals.
VIA’s short-term margin tradeoffs for lock-in are offset over long product lifecycles when stable production volumes and certification amortization restore pricing power.
Alternative platforms abound
As of 2024 customers can switch among NVIDIA Jetson, ARM MCUs, and Google Edge TPU for many AI/edge workloads, and the availability of hundreds of off-the-shelf modules and reference designs raises substitution ease. This abundance strengthens buyer negotiation power, though differences in power efficiency and mature SDKs — often decisive in procurement — help vendors defend against switching.
Service-level and longevity demands
Industrial buyers demand 7–10+ years of availability and strict SLAs for embedded platforms; inability to guarantee longevity shifts pricing and contract leverage to buyers. Extended support, security updates and certified migration paths serve as negotiation levers, and VIA can reclaim margin by bundling long-term support, warranties and managed services into higher-value offerings.
- 7–10+ years availability
- Strict SLAs shift leverage to buyers
- Support/security updates as bargaining chips
- Bundle services to reclaim value
Global pricing transparency
Global pricing transparency forces VIA to show ASPs and common discounts across channel distribution and online benchmarks, with e-commerce representing about 22% of global retail in 2024 which amplifies visibility. Buyers use that visibility to extract better terms, making volume-tier pricing and rebates standard expectations; region-specific bundles help protect margins while meeting targets.
- Channel exposure: public ASPs and discounts
- Buyer leverage: exploit visibility for better terms
- Pricing norms: volume tiers and rebates expected
- Margin defense: region-specific bundles
Fragmented buyers extract discounts; ~22%, 7-10+yr support
Buyers are fragmented yet technically sophisticated, leveraging feature-for-price benchmarks and public ASPs (e-commerce ~22% of retail in 2024) to extract volume discounts and NRE support. Multi-year availability (7–10+ years) and certification create high switching costs, but dozens of off-the-shelf modules and alternatives (NVIDIA, ARM, Google) raise substitution threat. VIA reclaims margin via bundled long-term support, SLAs and certified migration paths.
| Metric | 2024 Value |
|---|---|
| Global e‑commerce share | ~22% |
| Required longevity | 7–10+ years |
| Top substitutes | NVIDIA Jetson, ARM MCUs, Google Edge TPU |
Full Version Awaits
VIA Technologies Porter's Five Forces Analysis
This VIA Technologies Porter's Five Forces Analysis presents a thorough evaluation of competitive rivalry, supplier and buyer power, threats of new entrants and substitutes, and strategic implications. This preview is the exact, fully formatted document you will receive immediately after purchase—no placeholders or samples. Use it instantly for decision-making, presentations, or further research.











