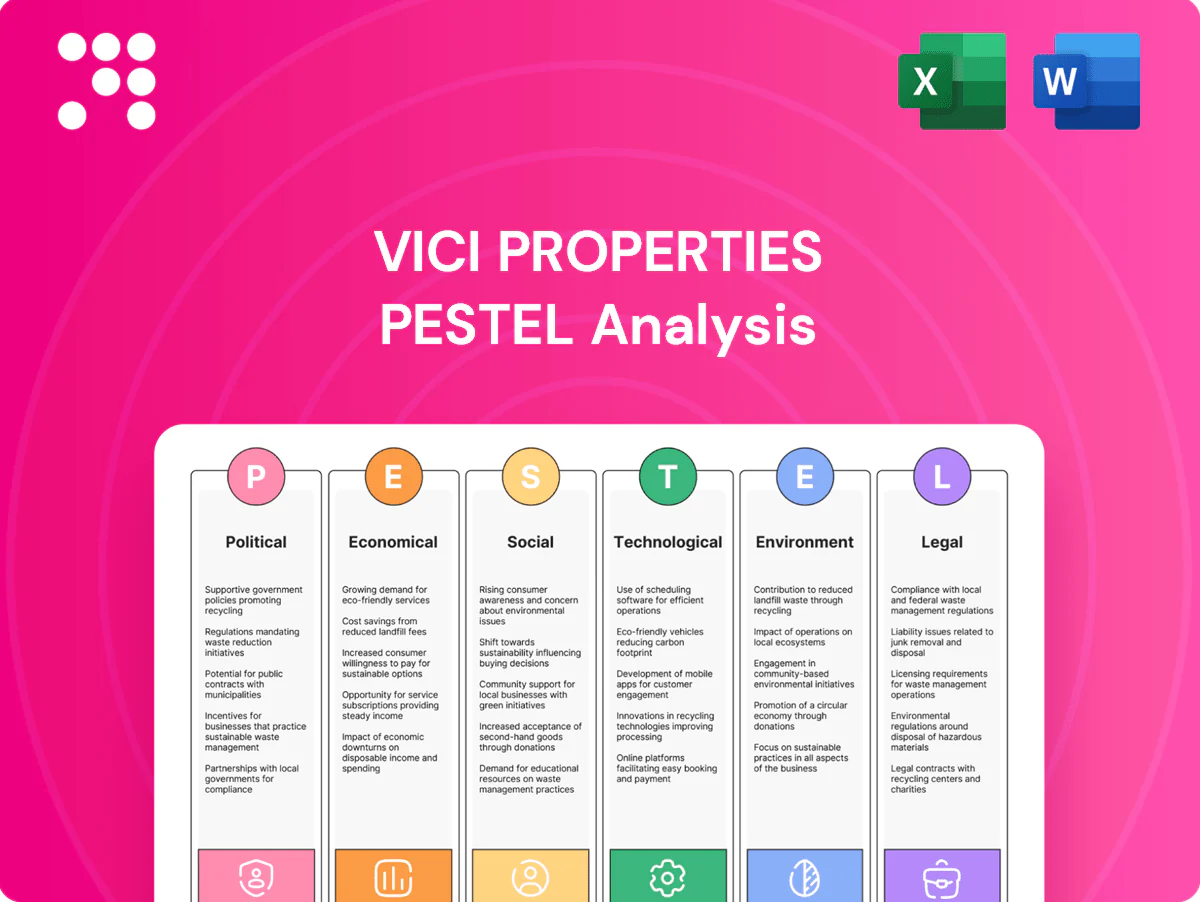
VICI Properties PESTLE Analysis

Plan Smarter. Present Sharper. Compete Stronger.
Gain actionable insight into VICI Properties with our PESTLE analysis—examining political/regulatory shifts, economic cycles, social trends, technological innovation, legal risk, and environmental pressures. Ideal for investors and strategists seeking to forecast risks and spot growth opportunities. Purchase the full report for a detailed, ready-to-use breakdown and immediate download.
Political factors

State gaming policy volatility
Licensing limits, tax rates and gaming expansion are set at the state level and can shift with elections, directly affecting tenant profitability and lease coverage ratios. VICI must monitor legislative calendars in key markets such as Nevada (Jan–Jun sessions), New Jersey (Jan–Jun) and emerging states to anticipate policy moves. With a portfolio of over 60 gaming assets and an enterprise value near $30B, proactive engagement and lease diversification reduce concentration risk.
Local incentives and zoning
Municipalities control zoning, entitlements and incentives that directly affect VICI Properties redevelopment timelines and ROI; supportive city councils can accelerate expansions while moratoriums stall value-add plans. VICI, a REIT spun out of Caesars in 2017, benefits from markets promoting tourism districts—Las Vegas drew about 42.6 million visitors in 2023—boosting demand for its gaming/hospitality land leases. Community benefit agreements can align interests but add permitting complexity and ongoing compliance obligations.

Federal tax and REIT treatment
Federal tax stability is critical for VICI: REIT status avoids federal corporate tax when 90% of taxable income is distributed, and the 20% 199A passthrough deduction historically boosted after-tax returns for many owners. Changes to interest deductibility or depreciation (eg 163(j) or bonus depreciation revisions) would directly shift cap‑rates and transaction economics. Federal initiatives like the $1.2 trillion IIJA and roughly $1.2 trillion US travel spending in 2023 support key tourism corridors. Policy continuity reduces underwriting uncertainty and cost of capital.

Tribal and sovereign compacts
Where tenants operate tribal casinos, compacts with states dictate game types, revenue sharing, and exclusivity. Renegotiations can move cash flows materially—small shifts in revenue-share terms can change GGR-linked rent by millions annually. VICI must match compact durations to lease maturities while sovereign immunity shapes enforcement risk.
- Compacts set game types/revenue share/exclusivity
- Renegotiation risk can materially affect rent
- Lease‑compact duration mismatch is a valuation risk
- Sovereign immunity limits enforcement remedies
Travel and visa policies
Inbound international tourism depends on visa regimes and border controls; Las Vegas recorded about 32.9M visitors in 2023 with roughly 3.3M international arrivals, so easing entry can boost demand from key markets. Political shocks (eg 2020 pandemic) cut international arrivals by over 70% and can depress visitation abruptly. Diversifying into regional drive-to assets reduces exposure to geopolitically driven international travel shocks.
- Las Vegas 2023 visitors ~32.9M; international ~3.3M
- US international arrivals 2019 ~79.3M; 2020 drop >70%
- Drive-to assets hedge geopolitical visa/border risk
Gaming laws, taxes and tribal compacts reshape casino tenant profitability and redevelopment ROI
State gaming laws, licensing and tax rates (set at state level) drive tenant profitability and lease coverage; VICI (60+ gaming assets, enterprise value ~30B) must track sessions in Nevada, New Jersey and emerging jurisdictions. Municipal zoning, incentives and tourism policy (Las Vegas ~42.6M visitors in 2023; ~3.3M international) affect redevelopment ROI and visitation. Tribal compacts, revenue‑share renegotiations and sovereign immunity create material cash‑flow and enforcement risk.
| Factor | Metric |
|---|---|
| Portfolio | 60+ assets; EV ~30B |
| Las Vegas 2023 | Visitors ~42.6M; Intl ~3.3M |
| REIT rule | 90% taxable income distribution |
What is included in the product
 Detailed Word Document
Explores how macro-environmental factors uniquely affect VICI Properties across Political, Economic, Social, Technological, Environmental, and Legal dimensions, with data-backed trends and industry-specific examples; designed to help executives, consultants, and investors identify risks, opportunities, and strategic responses for resilient portfolio and capital planning.

 Customizable Excel Spreadsheet
A concise, visually segmented PESTLE summary of VICI Properties for quick reference in meetings or slides, editable for regional or business-line notes and easily shareable across teams to streamline risk discussions and strategic alignment.
Economic factors

Interest rates and cap rates
REIT valuations and acquisition yields remain highly rate-sensitive as the Federal Reserve funds rate has sat at roughly 5.25–5.50% and the 10-year Treasury around 4–4.5%, driving implied cap rates higher and compressing equity cost of capital. Rising rates pressure accretion math on transactions, though VICI’s predominantly fixed-rate debt ladder and active interest-rate hedges stabilize AFFO volatility. CPI-linked rent escalators in many VICI leases provide partial offsets to rate-driven multiple compression.
Consumer discretionary cycles
Gaming and hospitality spend closely tracks employment, wages and consumer confidence—U.S. unemployment was 3.7% in 2024 (BLS), supporting demand. Downturns compress GGR and tenant EBITDAR, testing rent coverage on variable cashflows. Destination markets rebound strongly; Las Vegas saw ~44.1 million visitors in 2023 (LVCVA). VICI’s long‑term leases with strong guarantees and step‑ups cushion this cyclicality.

Inflation and escalators
Triple-net leases commonly include fixed or CPI-based escalators; US CPI rose 3.4% in 2024 (BLS), boosting same-store rent growth where contractual CPI pass-throughs or uncapped escalators apply. Elevated inflation improves nominal rent rolls but operating-cost inflation (supplies, wages) compresses tenant margins and raises credit risk. Careful escalator caps and tenant health monitoring are critical for VICI.

Tenant credit concentration
Large operators drive a meaningful share of VICI rent—as of Dec 31, 2024 MGM Resorts (~33%), Caesars (~22%) and Penn (~9%) together represented roughly 64% of annualized base rent, creating concentrated counterparty risk. M&A and deleveraging cycles (e.g., Caesars and Penn restructurings) can rapidly alter tenant credit profiles and realized synergies. Master leases and cross-default provisions bolster VICI’s recovery rights while operators’ ongoing portfolio and market diversification reduces tail risk.
- Tenant concentration: MGM ~33%, Caesars ~22%, Penn ~9% (2024)
- Combined ABR share: ~64% (2024)
- Mitigants: master leases, cross-defaults
- Risk reducers: operator diversification, M&A-driven credit shifts
Capital markets access
Accretive growth for VICI hinges on steady access to unsecured debt and equity; market risk-off periods (like 2022–2023 volatility) widen spreads and can stall deal flow, making capital timing critical. Maintaining investment-grade ratings preserves refinancing flexibility in choppy markets, while joint ventures and asset-recycling—used in recent portfolio transactions—offer alternative funding channels.
- Unsecured debt/equity crucial
- Risk-off widens spreads, slows deals
- Investment-grade = flexibility
- JVs and asset recycling = alternative funding
Gaming laws, taxes and tribal compacts reshape casino tenant profitability and redevelopment ROI
REIT valuations remain rate-sensitive with fed funds ~5.25–5.50% and 10‑yr ~4–4.5% (2024), pressuring cap rates; VICI’s fixed‑rate debt and hedges stabilize AFFO while CPI escalators (US CPI 3.4% in 2024) partially offset. Consumer demand aided by 3.7% unemployment (2024) and Vegas 44.1M visitors (2023). Tenant concentration: MGM 33%, Caesars 22%, Penn 9% (ABR ~64% as of 12/31/2024).
| Metric | Value |
|---|---|
| Fed funds (2024) | 5.25–5.50% |
| 10‑yr Treasury | 4–4.5% |
| US CPI (2024) | 3.4% |
| Unemployment (2024) | 3.7% |
| Vegas visitors (2023) | 44.1M |
| Top ABR concentration (12/31/2024) | MGM 33% / Caesars 22% / Penn 9% (64% total) |
What You See Is What You Get
VICI Properties PESTLE Analysis
The VICI Properties PESTLE Analysis preview shown here is the exact document you’ll receive after purchase—fully formatted and ready to use. It delivers political, economic, social, technological, legal, and environmental insights specific to VICI Properties. The layout, content, and structure visible are exactly what you’ll download immediately after buying. No placeholders—this is the final, professional file.

Plan Smarter. Present Sharper. Compete Stronger.
Gain actionable insight into VICI Properties with our PESTLE analysis—examining political/regulatory shifts, economic cycles, social trends, technological innovation, legal risk, and environmental pressures. Ideal for investors and strategists seeking to forecast risks and spot growth opportunities. Purchase the full report for a detailed, ready-to-use breakdown and immediate download.
Political factors
State gaming policy volatility
Licensing limits, tax rates and gaming expansion are set at the state level and can shift with elections, directly affecting tenant profitability and lease coverage ratios. VICI must monitor legislative calendars in key markets such as Nevada (Jan–Jun sessions), New Jersey (Jan–Jun) and emerging states to anticipate policy moves. With a portfolio of over 60 gaming assets and an enterprise value near $30B, proactive engagement and lease diversification reduce concentration risk.
Local incentives and zoning
Municipalities control zoning, entitlements and incentives that directly affect VICI Properties redevelopment timelines and ROI; supportive city councils can accelerate expansions while moratoriums stall value-add plans. VICI, a REIT spun out of Caesars in 2017, benefits from markets promoting tourism districts—Las Vegas drew about 42.6 million visitors in 2023—boosting demand for its gaming/hospitality land leases. Community benefit agreements can align interests but add permitting complexity and ongoing compliance obligations.
Federal tax and REIT treatment
Federal tax stability is critical for VICI: REIT status avoids federal corporate tax when 90% of taxable income is distributed, and the 20% 199A passthrough deduction historically boosted after-tax returns for many owners. Changes to interest deductibility or depreciation (eg 163(j) or bonus depreciation revisions) would directly shift cap‑rates and transaction economics. Federal initiatives like the $1.2 trillion IIJA and roughly $1.2 trillion US travel spending in 2023 support key tourism corridors. Policy continuity reduces underwriting uncertainty and cost of capital.
Tribal and sovereign compacts
Where tenants operate tribal casinos, compacts with states dictate game types, revenue sharing, and exclusivity. Renegotiations can move cash flows materially—small shifts in revenue-share terms can change GGR-linked rent by millions annually. VICI must match compact durations to lease maturities while sovereign immunity shapes enforcement risk.
- Compacts set game types/revenue share/exclusivity
- Renegotiation risk can materially affect rent
- Lease‑compact duration mismatch is a valuation risk
- Sovereign immunity limits enforcement remedies
Travel and visa policies
Inbound international tourism depends on visa regimes and border controls; Las Vegas recorded about 32.9M visitors in 2023 with roughly 3.3M international arrivals, so easing entry can boost demand from key markets. Political shocks (eg 2020 pandemic) cut international arrivals by over 70% and can depress visitation abruptly. Diversifying into regional drive-to assets reduces exposure to geopolitically driven international travel shocks.
- Las Vegas 2023 visitors ~32.9M; international ~3.3M
- US international arrivals 2019 ~79.3M; 2020 drop >70%
- Drive-to assets hedge geopolitical visa/border risk
Gaming laws, taxes and tribal compacts reshape casino tenant profitability and redevelopment ROI
State gaming laws, licensing and tax rates (set at state level) drive tenant profitability and lease coverage; VICI (60+ gaming assets, enterprise value ~30B) must track sessions in Nevada, New Jersey and emerging jurisdictions. Municipal zoning, incentives and tourism policy (Las Vegas ~42.6M visitors in 2023; ~3.3M international) affect redevelopment ROI and visitation. Tribal compacts, revenue‑share renegotiations and sovereign immunity create material cash‑flow and enforcement risk.
| Factor | Metric |
|---|---|
| Portfolio | 60+ assets; EV ~30B |
| Las Vegas 2023 | Visitors ~42.6M; Intl ~3.3M |
| REIT rule | 90% taxable income distribution |
What is included in the product
Detailed Word Document
Explores how macro-environmental factors uniquely affect VICI Properties across Political, Economic, Social, Technological, Environmental, and Legal dimensions, with data-backed trends and industry-specific examples; designed to help executives, consultants, and investors identify risks, opportunities, and strategic responses for resilient portfolio and capital planning.
Customizable Excel Spreadsheet
A concise, visually segmented PESTLE summary of VICI Properties for quick reference in meetings or slides, editable for regional or business-line notes and easily shareable across teams to streamline risk discussions and strategic alignment.
Economic factors
Interest rates and cap rates
REIT valuations and acquisition yields remain highly rate-sensitive as the Federal Reserve funds rate has sat at roughly 5.25–5.50% and the 10-year Treasury around 4–4.5%, driving implied cap rates higher and compressing equity cost of capital. Rising rates pressure accretion math on transactions, though VICI’s predominantly fixed-rate debt ladder and active interest-rate hedges stabilize AFFO volatility. CPI-linked rent escalators in many VICI leases provide partial offsets to rate-driven multiple compression.
Consumer discretionary cycles
Gaming and hospitality spend closely tracks employment, wages and consumer confidence—U.S. unemployment was 3.7% in 2024 (BLS), supporting demand. Downturns compress GGR and tenant EBITDAR, testing rent coverage on variable cashflows. Destination markets rebound strongly; Las Vegas saw ~44.1 million visitors in 2023 (LVCVA). VICI’s long‑term leases with strong guarantees and step‑ups cushion this cyclicality.
Inflation and escalators
Triple-net leases commonly include fixed or CPI-based escalators; US CPI rose 3.4% in 2024 (BLS), boosting same-store rent growth where contractual CPI pass-throughs or uncapped escalators apply. Elevated inflation improves nominal rent rolls but operating-cost inflation (supplies, wages) compresses tenant margins and raises credit risk. Careful escalator caps and tenant health monitoring are critical for VICI.
Tenant credit concentration
Large operators drive a meaningful share of VICI rent—as of Dec 31, 2024 MGM Resorts (~33%), Caesars (~22%) and Penn (~9%) together represented roughly 64% of annualized base rent, creating concentrated counterparty risk. M&A and deleveraging cycles (e.g., Caesars and Penn restructurings) can rapidly alter tenant credit profiles and realized synergies. Master leases and cross-default provisions bolster VICI’s recovery rights while operators’ ongoing portfolio and market diversification reduces tail risk.
- Tenant concentration: MGM ~33%, Caesars ~22%, Penn ~9% (2024)
- Combined ABR share: ~64% (2024)
- Mitigants: master leases, cross-defaults
- Risk reducers: operator diversification, M&A-driven credit shifts
Capital markets access
Accretive growth for VICI hinges on steady access to unsecured debt and equity; market risk-off periods (like 2022–2023 volatility) widen spreads and can stall deal flow, making capital timing critical. Maintaining investment-grade ratings preserves refinancing flexibility in choppy markets, while joint ventures and asset-recycling—used in recent portfolio transactions—offer alternative funding channels.
- Unsecured debt/equity crucial
- Risk-off widens spreads, slows deals
- Investment-grade = flexibility
- JVs and asset recycling = alternative funding
Gaming laws, taxes and tribal compacts reshape casino tenant profitability and redevelopment ROI
REIT valuations remain rate-sensitive with fed funds ~5.25–5.50% and 10‑yr ~4–4.5% (2024), pressuring cap rates; VICI’s fixed‑rate debt and hedges stabilize AFFO while CPI escalators (US CPI 3.4% in 2024) partially offset. Consumer demand aided by 3.7% unemployment (2024) and Vegas 44.1M visitors (2023). Tenant concentration: MGM 33%, Caesars 22%, Penn 9% (ABR ~64% as of 12/31/2024).
| Metric | Value |
|---|---|
| Fed funds (2024) | 5.25–5.50% |
| 10‑yr Treasury | 4–4.5% |
| US CPI (2024) | 3.4% |
| Unemployment (2024) | 3.7% |
| Vegas visitors (2023) | 44.1M |
| Top ABR concentration (12/31/2024) | MGM 33% / Caesars 22% / Penn 9% (64% total) |
What You See Is What You Get
VICI Properties PESTLE Analysis
The VICI Properties PESTLE Analysis preview shown here is the exact document you’ll receive after purchase—fully formatted and ready to use. It delivers political, economic, social, technological, legal, and environmental insights specific to VICI Properties. The layout, content, and structure visible are exactly what you’ll download immediately after buying. No placeholders—this is the final, professional file.
Original: $10.00
-65%$10.00
$3.50Description
Plan Smarter. Present Sharper. Compete Stronger.
Gain actionable insight into VICI Properties with our PESTLE analysis—examining political/regulatory shifts, economic cycles, social trends, technological innovation, legal risk, and environmental pressures. Ideal for investors and strategists seeking to forecast risks and spot growth opportunities. Purchase the full report for a detailed, ready-to-use breakdown and immediate download.
Political factors
State gaming policy volatility
Licensing limits, tax rates and gaming expansion are set at the state level and can shift with elections, directly affecting tenant profitability and lease coverage ratios. VICI must monitor legislative calendars in key markets such as Nevada (Jan–Jun sessions), New Jersey (Jan–Jun) and emerging states to anticipate policy moves. With a portfolio of over 60 gaming assets and an enterprise value near $30B, proactive engagement and lease diversification reduce concentration risk.
Local incentives and zoning
Municipalities control zoning, entitlements and incentives that directly affect VICI Properties redevelopment timelines and ROI; supportive city councils can accelerate expansions while moratoriums stall value-add plans. VICI, a REIT spun out of Caesars in 2017, benefits from markets promoting tourism districts—Las Vegas drew about 42.6 million visitors in 2023—boosting demand for its gaming/hospitality land leases. Community benefit agreements can align interests but add permitting complexity and ongoing compliance obligations.
Federal tax and REIT treatment
Federal tax stability is critical for VICI: REIT status avoids federal corporate tax when 90% of taxable income is distributed, and the 20% 199A passthrough deduction historically boosted after-tax returns for many owners. Changes to interest deductibility or depreciation (eg 163(j) or bonus depreciation revisions) would directly shift cap‑rates and transaction economics. Federal initiatives like the $1.2 trillion IIJA and roughly $1.2 trillion US travel spending in 2023 support key tourism corridors. Policy continuity reduces underwriting uncertainty and cost of capital.
Tribal and sovereign compacts
Where tenants operate tribal casinos, compacts with states dictate game types, revenue sharing, and exclusivity. Renegotiations can move cash flows materially—small shifts in revenue-share terms can change GGR-linked rent by millions annually. VICI must match compact durations to lease maturities while sovereign immunity shapes enforcement risk.
- Compacts set game types/revenue share/exclusivity
- Renegotiation risk can materially affect rent
- Lease‑compact duration mismatch is a valuation risk
- Sovereign immunity limits enforcement remedies
Travel and visa policies
Inbound international tourism depends on visa regimes and border controls; Las Vegas recorded about 32.9M visitors in 2023 with roughly 3.3M international arrivals, so easing entry can boost demand from key markets. Political shocks (eg 2020 pandemic) cut international arrivals by over 70% and can depress visitation abruptly. Diversifying into regional drive-to assets reduces exposure to geopolitically driven international travel shocks.
- Las Vegas 2023 visitors ~32.9M; international ~3.3M
- US international arrivals 2019 ~79.3M; 2020 drop >70%
- Drive-to assets hedge geopolitical visa/border risk
Gaming laws, taxes and tribal compacts reshape casino tenant profitability and redevelopment ROI
State gaming laws, licensing and tax rates (set at state level) drive tenant profitability and lease coverage; VICI (60+ gaming assets, enterprise value ~30B) must track sessions in Nevada, New Jersey and emerging jurisdictions. Municipal zoning, incentives and tourism policy (Las Vegas ~42.6M visitors in 2023; ~3.3M international) affect redevelopment ROI and visitation. Tribal compacts, revenue‑share renegotiations and sovereign immunity create material cash‑flow and enforcement risk.
| Factor | Metric |
|---|---|
| Portfolio | 60+ assets; EV ~30B |
| Las Vegas 2023 | Visitors ~42.6M; Intl ~3.3M |
| REIT rule | 90% taxable income distribution |
What is included in the product
Detailed Word Document
Explores how macro-environmental factors uniquely affect VICI Properties across Political, Economic, Social, Technological, Environmental, and Legal dimensions, with data-backed trends and industry-specific examples; designed to help executives, consultants, and investors identify risks, opportunities, and strategic responses for resilient portfolio and capital planning.
Customizable Excel Spreadsheet
A concise, visually segmented PESTLE summary of VICI Properties for quick reference in meetings or slides, editable for regional or business-line notes and easily shareable across teams to streamline risk discussions and strategic alignment.
Economic factors
Interest rates and cap rates
REIT valuations and acquisition yields remain highly rate-sensitive as the Federal Reserve funds rate has sat at roughly 5.25–5.50% and the 10-year Treasury around 4–4.5%, driving implied cap rates higher and compressing equity cost of capital. Rising rates pressure accretion math on transactions, though VICI’s predominantly fixed-rate debt ladder and active interest-rate hedges stabilize AFFO volatility. CPI-linked rent escalators in many VICI leases provide partial offsets to rate-driven multiple compression.
Consumer discretionary cycles
Gaming and hospitality spend closely tracks employment, wages and consumer confidence—U.S. unemployment was 3.7% in 2024 (BLS), supporting demand. Downturns compress GGR and tenant EBITDAR, testing rent coverage on variable cashflows. Destination markets rebound strongly; Las Vegas saw ~44.1 million visitors in 2023 (LVCVA). VICI’s long‑term leases with strong guarantees and step‑ups cushion this cyclicality.
Inflation and escalators
Triple-net leases commonly include fixed or CPI-based escalators; US CPI rose 3.4% in 2024 (BLS), boosting same-store rent growth where contractual CPI pass-throughs or uncapped escalators apply. Elevated inflation improves nominal rent rolls but operating-cost inflation (supplies, wages) compresses tenant margins and raises credit risk. Careful escalator caps and tenant health monitoring are critical for VICI.
Tenant credit concentration
Large operators drive a meaningful share of VICI rent—as of Dec 31, 2024 MGM Resorts (~33%), Caesars (~22%) and Penn (~9%) together represented roughly 64% of annualized base rent, creating concentrated counterparty risk. M&A and deleveraging cycles (e.g., Caesars and Penn restructurings) can rapidly alter tenant credit profiles and realized synergies. Master leases and cross-default provisions bolster VICI’s recovery rights while operators’ ongoing portfolio and market diversification reduces tail risk.
- Tenant concentration: MGM ~33%, Caesars ~22%, Penn ~9% (2024)
- Combined ABR share: ~64% (2024)
- Mitigants: master leases, cross-defaults
- Risk reducers: operator diversification, M&A-driven credit shifts
Capital markets access
Accretive growth for VICI hinges on steady access to unsecured debt and equity; market risk-off periods (like 2022–2023 volatility) widen spreads and can stall deal flow, making capital timing critical. Maintaining investment-grade ratings preserves refinancing flexibility in choppy markets, while joint ventures and asset-recycling—used in recent portfolio transactions—offer alternative funding channels.
- Unsecured debt/equity crucial
- Risk-off widens spreads, slows deals
- Investment-grade = flexibility
- JVs and asset recycling = alternative funding
Gaming laws, taxes and tribal compacts reshape casino tenant profitability and redevelopment ROI
REIT valuations remain rate-sensitive with fed funds ~5.25–5.50% and 10‑yr ~4–4.5% (2024), pressuring cap rates; VICI’s fixed‑rate debt and hedges stabilize AFFO while CPI escalators (US CPI 3.4% in 2024) partially offset. Consumer demand aided by 3.7% unemployment (2024) and Vegas 44.1M visitors (2023). Tenant concentration: MGM 33%, Caesars 22%, Penn 9% (ABR ~64% as of 12/31/2024).
| Metric | Value |
|---|---|
| Fed funds (2024) | 5.25–5.50% |
| 10‑yr Treasury | 4–4.5% |
| US CPI (2024) | 3.4% |
| Unemployment (2024) | 3.7% |
| Vegas visitors (2023) | 44.1M |
| Top ABR concentration (12/31/2024) | MGM 33% / Caesars 22% / Penn 9% (64% total) |
What You See Is What You Get
VICI Properties PESTLE Analysis
The VICI Properties PESTLE Analysis preview shown here is the exact document you’ll receive after purchase—fully formatted and ready to use. It delivers political, economic, social, technological, legal, and environmental insights specific to VICI Properties. The layout, content, and structure visible are exactly what you’ll download immediately after buying. No placeholders—this is the final, professional file.











