Vicor Porter's Five Forces Analysis

A Must-Have Tool for Decision-Makers
Vicor operates in a high-tech power semiconductor niche where supplier relationships, buyer concentration, and rapid innovation shape margins and growth. Competitive rivalry and potential substitutes heighten pressure on pricing and R&D priorities. This brief highlights key tensions; unlock the full Porter's Five Forces Analysis to access force-by-force ratings, visuals, and actionable strategic insights.
Suppliers Bargaining Power

Concentrated advanced materials
High-performance magnetics, specialized substrates, and GaN/SiC power devices are sourced from a concentrated pool of qualified vendors, keeping switching costs high and exposure to lead-time shocks; industry reports showed advanced power device lead times hovering around 20+ weeks in 2024. Quality and reliability requirements further narrow alternatives, with a handful of suppliers dominating critical supply tiers. Vicor mitigates risk through dual-sourcing where feasible, but meaningful alternative options remain constrained.
Specialized process equipment
Precision packaging, microfabrication and test gear are capital intensive—EUV lithography tools cost ~200 million per unit and high-end packaging tools often exceed 5–20 million—creating vendor-specific lock-in. Dominant suppliers (ASML controls essentially all EUV) leverage pricing and service terms, while process transfers take 6–18 months on average, risking costly downtime. Long qualification cycles further strengthen supplier bargaining power.

Tight specs and yield sensitivity
Tight power-density targets force Vicor to demand sub-ppm component variances and high yields; even small deviations cut converter efficiency and thermal headroom, narrowing the qualified supplier pool. Suppliers meeting 2024-grade specs command premiums, often cited up to 20%, pressuring gross margins. Vicor must trade off unit cost versus performance assurance to protect product value.

Long lead times and allocation risk
Cycle peaks in computing and automotive push GaN/SiC and ceramic components into allocation; in 2024 SiC/GaN lead times commonly stretched to 26–52 weeks and ceramic capacitor lead times exceeded 30 weeks, forcing higher buffer inventories or schedule risk. Suppliers gain leverage through allocation prioritization, extracting better prices and contractual terms. Buyers must provide multi-quarter visibility and firm volume commitments to secure capacity.
- Allocation risk: peaks drive supplier rationing
- Lead times: SiC/GaN ~26–52 weeks; ceramics >30 weeks (2024)
- Buyer response: higher inventory or schedule exposure
- Mitigation: long-term volume commitments and demand visibility
IP and custom parts dependency
Custom magnetics and modules often embed supplier IP, creating product stickiness and technical lock-in; in 2024 industry lead times for bespoke magnetics commonly exceeded 20 weeks, making redesigns costly and slow and increasing supplier leverage during renegotiations.
- IP lock-in raises switching costs
- 20+ week lead times in 2024
- Redesigns slow and expensive
- Partnerships reduce but do not remove supplier power
Supplier concentration, long lead times and expensive tools squeeze margins, raise premiums
Suppliers hold strong leverage: concentrated vendors for GaN/SiC and advanced magnetics, ASML dominance in EUV, and long lead times (20–52 weeks) drive high switching costs and allocation risk; premium pricing up to 20% and capital‑intensive tools (EUV ~200M/unit) pressure margins. Vicor relies on dual‑sourcing, long‑term contracts and inventory to mitigate.
| Metric | 2024 |
|---|---|
| GaN/SiC lead times | 26–52 weeks |
| Custom magnetics lead time | 20+ weeks |
| Price premium for spec suppliers | Up to 20% |
| EUV tool cost | ~200 million/unit |
What is included in the product
 Detailed Word Document
Tailored Porter's Five Forces analysis for Vicor, uncovering key drivers of competition, supplier and buyer power, entry barriers, and substitutes that shape pricing and profitability; highlights disruptive threats and strategic levers to defend market share for use in investor materials or internal strategy decks.

 Customizable Excel Spreadsheet
A concise, one-sheet Porter's Five Forces for Vicor that quantifies competitive pressures, is customizable for evolving scenarios, and export-ready for decks—helping teams quickly pinpoint strategic risks and prioritize mitigation.
Customers Bargaining Power

Large OEM buyers concentrated
Large OEM buyers in enterprise compute, aerospace/defense and automotive are few but sizable, enabling tough pricing, qualification and lifetime support demands; for companies like Vicor a single program often represents more than 10% of revenue, so losing it can materially impact top line, while multi-year agreements trade lower prices for volume predictability and supply stability into 2024.
High switching costs from design-in
Once designed and qualified, Vicor power modules are effectively locked in because revalidation of electrical, thermal and mechanical interfaces commonly requires 6–12 months and significant system retesting, deepening switching costs and moderating buyer power post-design-win. Thermal/mechanical integration increases integration barriers and lifecycle dependency. In 2024 pre-design selection still centers on intense price-performance trade-offs and benchmarking.

Performance-critical procurement
In performance-critical procurement buyers favor efficiency, power density and reliability over lowest unit price, and Vicor cites converter efficiencies up to 98% which helps soften price pressure. Superior specs and space savings enable value-based pricing by lowering total cost of ownership through reduced cooling and footprint. Procurement still benchmarks against rival modules and will request comparative efficiency, thermal and lifecycle data.

Demand cyclicality and forecasting
End markets for Vicor swing with data center and industrial cycles, with 2024 demand volatility shifting inventory risk back to suppliers as buyers delay orders during downturns.
Buyers increasingly use flexibility clauses to manage exposure while Vicor pushes NCNR terms to protect capacity allocation and stabilize production planning in 2024.
- Demand linkage: data center & industrial cycles
- Inventory risk shifts to suppliers
- Buyers use flexibility clauses
- Vicor seeks NCNR to secure capacity
Compliance and support expectations
OEMs demand rigorous documentation, certifications and field engineering, and by 2024 over 60% of power-system OEMs cite certification and on‑site support as decisive purchase criteria. These requirements increase cost‑to‑serve and lengthen sales cycles, giving buyers leverage to use compliance gates to extract price or service concessions. Conversely, robust application and field support lets suppliers command premium margins and faster adoption.
- Compliance burden: raises cost‑to‑serve and extends sales cycles
- Buyer leverage: compliance gates used to negotiate concessions
- Supplier advantage: strong field/app support = premium positioning
OEM concentration, long revalidation, and 98% efficiency sustain value pricing
Large OEMs exert strong price and support demands—single programs often exceed 10% of Vicor revenue—while multi‑year deals trade lower prices for demand visibility into 2024. Post‑design switching costs are high: revalidation typically takes 6–12 months, locking in modules and reducing buyer leverage after design‑win. Performance specs (efficiency up to 98%) enable value pricing despite buyer benchmarking and 2024 demand volatility.
| Metric | Value / Note (2024) |
|---|---|
| Program concentration | >10% revenue per program |
| Certification decisive | 60% of power‑system OEMs cite as decisive |
| Revalidation time | 6–12 months |
| Max converter efficiency | Up to 98% |
What You See Is What You Get
Vicor Porter's Five Forces Analysis
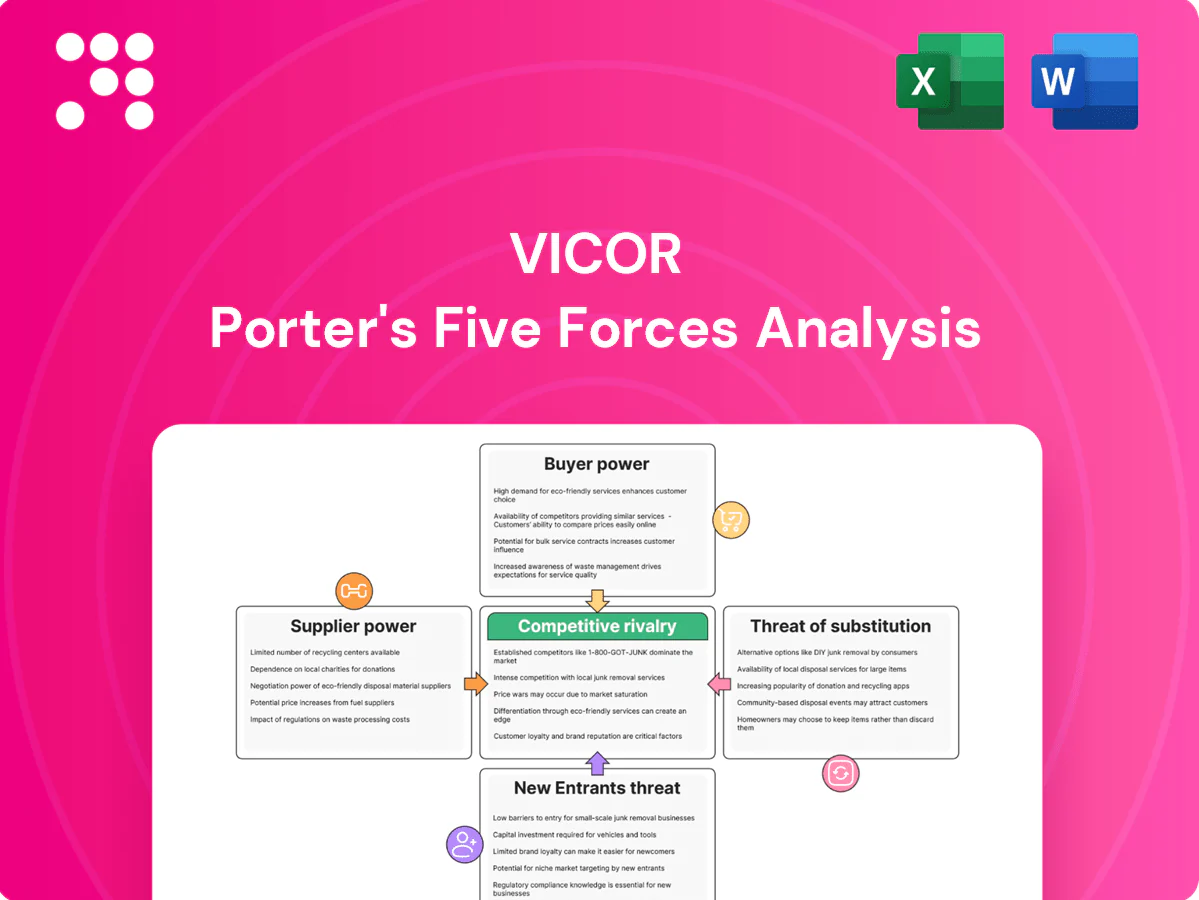
This preview shows the exact Vicor Porter’s Five Forces analysis you'll receive immediately after purchase—fully formatted and ready to use. It contains the complete assessment of competitive rivalry, supplier power, buyer power, threat of substitutes, and threat of new entrants. No samples or placeholders; you’ll get instant access to this same professional document upon payment.

A Must-Have Tool for Decision-Makers
Vicor operates in a high-tech power semiconductor niche where supplier relationships, buyer concentration, and rapid innovation shape margins and growth. Competitive rivalry and potential substitutes heighten pressure on pricing and R&D priorities. This brief highlights key tensions; unlock the full Porter's Five Forces Analysis to access force-by-force ratings, visuals, and actionable strategic insights.
Suppliers Bargaining Power
Concentrated advanced materials
High-performance magnetics, specialized substrates, and GaN/SiC power devices are sourced from a concentrated pool of qualified vendors, keeping switching costs high and exposure to lead-time shocks; industry reports showed advanced power device lead times hovering around 20+ weeks in 2024. Quality and reliability requirements further narrow alternatives, with a handful of suppliers dominating critical supply tiers. Vicor mitigates risk through dual-sourcing where feasible, but meaningful alternative options remain constrained.
Specialized process equipment
Precision packaging, microfabrication and test gear are capital intensive—EUV lithography tools cost ~200 million per unit and high-end packaging tools often exceed 5–20 million—creating vendor-specific lock-in. Dominant suppliers (ASML controls essentially all EUV) leverage pricing and service terms, while process transfers take 6–18 months on average, risking costly downtime. Long qualification cycles further strengthen supplier bargaining power.
Tight specs and yield sensitivity
Tight power-density targets force Vicor to demand sub-ppm component variances and high yields; even small deviations cut converter efficiency and thermal headroom, narrowing the qualified supplier pool. Suppliers meeting 2024-grade specs command premiums, often cited up to 20%, pressuring gross margins. Vicor must trade off unit cost versus performance assurance to protect product value.
Long lead times and allocation risk
Cycle peaks in computing and automotive push GaN/SiC and ceramic components into allocation; in 2024 SiC/GaN lead times commonly stretched to 26–52 weeks and ceramic capacitor lead times exceeded 30 weeks, forcing higher buffer inventories or schedule risk. Suppliers gain leverage through allocation prioritization, extracting better prices and contractual terms. Buyers must provide multi-quarter visibility and firm volume commitments to secure capacity.
- Allocation risk: peaks drive supplier rationing
- Lead times: SiC/GaN ~26–52 weeks; ceramics >30 weeks (2024)
- Buyer response: higher inventory or schedule exposure
- Mitigation: long-term volume commitments and demand visibility
IP and custom parts dependency
Custom magnetics and modules often embed supplier IP, creating product stickiness and technical lock-in; in 2024 industry lead times for bespoke magnetics commonly exceeded 20 weeks, making redesigns costly and slow and increasing supplier leverage during renegotiations.
- IP lock-in raises switching costs
- 20+ week lead times in 2024
- Redesigns slow and expensive
- Partnerships reduce but do not remove supplier power
Supplier concentration, long lead times and expensive tools squeeze margins, raise premiums
Suppliers hold strong leverage: concentrated vendors for GaN/SiC and advanced magnetics, ASML dominance in EUV, and long lead times (20–52 weeks) drive high switching costs and allocation risk; premium pricing up to 20% and capital‑intensive tools (EUV ~200M/unit) pressure margins. Vicor relies on dual‑sourcing, long‑term contracts and inventory to mitigate.
| Metric | 2024 |
|---|---|
| GaN/SiC lead times | 26–52 weeks |
| Custom magnetics lead time | 20+ weeks |
| Price premium for spec suppliers | Up to 20% |
| EUV tool cost | ~200 million/unit |
What is included in the product
Detailed Word Document
Tailored Porter's Five Forces analysis for Vicor, uncovering key drivers of competition, supplier and buyer power, entry barriers, and substitutes that shape pricing and profitability; highlights disruptive threats and strategic levers to defend market share for use in investor materials or internal strategy decks.
Customizable Excel Spreadsheet
A concise, one-sheet Porter's Five Forces for Vicor that quantifies competitive pressures, is customizable for evolving scenarios, and export-ready for decks—helping teams quickly pinpoint strategic risks and prioritize mitigation.
Customers Bargaining Power
Large OEM buyers concentrated
Large OEM buyers in enterprise compute, aerospace/defense and automotive are few but sizable, enabling tough pricing, qualification and lifetime support demands; for companies like Vicor a single program often represents more than 10% of revenue, so losing it can materially impact top line, while multi-year agreements trade lower prices for volume predictability and supply stability into 2024.
High switching costs from design-in
Once designed and qualified, Vicor power modules are effectively locked in because revalidation of electrical, thermal and mechanical interfaces commonly requires 6–12 months and significant system retesting, deepening switching costs and moderating buyer power post-design-win. Thermal/mechanical integration increases integration barriers and lifecycle dependency. In 2024 pre-design selection still centers on intense price-performance trade-offs and benchmarking.
Performance-critical procurement
In performance-critical procurement buyers favor efficiency, power density and reliability over lowest unit price, and Vicor cites converter efficiencies up to 98% which helps soften price pressure. Superior specs and space savings enable value-based pricing by lowering total cost of ownership through reduced cooling and footprint. Procurement still benchmarks against rival modules and will request comparative efficiency, thermal and lifecycle data.
Demand cyclicality and forecasting
End markets for Vicor swing with data center and industrial cycles, with 2024 demand volatility shifting inventory risk back to suppliers as buyers delay orders during downturns.
Buyers increasingly use flexibility clauses to manage exposure while Vicor pushes NCNR terms to protect capacity allocation and stabilize production planning in 2024.
- Demand linkage: data center & industrial cycles
- Inventory risk shifts to suppliers
- Buyers use flexibility clauses
- Vicor seeks NCNR to secure capacity
Compliance and support expectations
OEMs demand rigorous documentation, certifications and field engineering, and by 2024 over 60% of power-system OEMs cite certification and on‑site support as decisive purchase criteria. These requirements increase cost‑to‑serve and lengthen sales cycles, giving buyers leverage to use compliance gates to extract price or service concessions. Conversely, robust application and field support lets suppliers command premium margins and faster adoption.
- Compliance burden: raises cost‑to‑serve and extends sales cycles
- Buyer leverage: compliance gates used to negotiate concessions
- Supplier advantage: strong field/app support = premium positioning
OEM concentration, long revalidation, and 98% efficiency sustain value pricing
Large OEMs exert strong price and support demands—single programs often exceed 10% of Vicor revenue—while multi‑year deals trade lower prices for demand visibility into 2024. Post‑design switching costs are high: revalidation typically takes 6–12 months, locking in modules and reducing buyer leverage after design‑win. Performance specs (efficiency up to 98%) enable value pricing despite buyer benchmarking and 2024 demand volatility.
| Metric | Value / Note (2024) |
|---|---|
| Program concentration | >10% revenue per program |
| Certification decisive | 60% of power‑system OEMs cite as decisive |
| Revalidation time | 6–12 months |
| Max converter efficiency | Up to 98% |
What You See Is What You Get
Vicor Porter's Five Forces Analysis
This preview shows the exact Vicor Porter’s Five Forces analysis you'll receive immediately after purchase—fully formatted and ready to use. It contains the complete assessment of competitive rivalry, supplier power, buyer power, threat of substitutes, and threat of new entrants. No samples or placeholders; you’ll get instant access to this same professional document upon payment.
Original: $10.00
-65%$10.00
$3.50Description
A Must-Have Tool for Decision-Makers
Vicor operates in a high-tech power semiconductor niche where supplier relationships, buyer concentration, and rapid innovation shape margins and growth. Competitive rivalry and potential substitutes heighten pressure on pricing and R&D priorities. This brief highlights key tensions; unlock the full Porter's Five Forces Analysis to access force-by-force ratings, visuals, and actionable strategic insights.
Suppliers Bargaining Power
Concentrated advanced materials
High-performance magnetics, specialized substrates, and GaN/SiC power devices are sourced from a concentrated pool of qualified vendors, keeping switching costs high and exposure to lead-time shocks; industry reports showed advanced power device lead times hovering around 20+ weeks in 2024. Quality and reliability requirements further narrow alternatives, with a handful of suppliers dominating critical supply tiers. Vicor mitigates risk through dual-sourcing where feasible, but meaningful alternative options remain constrained.
Specialized process equipment
Precision packaging, microfabrication and test gear are capital intensive—EUV lithography tools cost ~200 million per unit and high-end packaging tools often exceed 5–20 million—creating vendor-specific lock-in. Dominant suppliers (ASML controls essentially all EUV) leverage pricing and service terms, while process transfers take 6–18 months on average, risking costly downtime. Long qualification cycles further strengthen supplier bargaining power.
Tight specs and yield sensitivity
Tight power-density targets force Vicor to demand sub-ppm component variances and high yields; even small deviations cut converter efficiency and thermal headroom, narrowing the qualified supplier pool. Suppliers meeting 2024-grade specs command premiums, often cited up to 20%, pressuring gross margins. Vicor must trade off unit cost versus performance assurance to protect product value.
Long lead times and allocation risk
Cycle peaks in computing and automotive push GaN/SiC and ceramic components into allocation; in 2024 SiC/GaN lead times commonly stretched to 26–52 weeks and ceramic capacitor lead times exceeded 30 weeks, forcing higher buffer inventories or schedule risk. Suppliers gain leverage through allocation prioritization, extracting better prices and contractual terms. Buyers must provide multi-quarter visibility and firm volume commitments to secure capacity.
- Allocation risk: peaks drive supplier rationing
- Lead times: SiC/GaN ~26–52 weeks; ceramics >30 weeks (2024)
- Buyer response: higher inventory or schedule exposure
- Mitigation: long-term volume commitments and demand visibility
IP and custom parts dependency
Custom magnetics and modules often embed supplier IP, creating product stickiness and technical lock-in; in 2024 industry lead times for bespoke magnetics commonly exceeded 20 weeks, making redesigns costly and slow and increasing supplier leverage during renegotiations.
- IP lock-in raises switching costs
- 20+ week lead times in 2024
- Redesigns slow and expensive
- Partnerships reduce but do not remove supplier power
Supplier concentration, long lead times and expensive tools squeeze margins, raise premiums
Suppliers hold strong leverage: concentrated vendors for GaN/SiC and advanced magnetics, ASML dominance in EUV, and long lead times (20–52 weeks) drive high switching costs and allocation risk; premium pricing up to 20% and capital‑intensive tools (EUV ~200M/unit) pressure margins. Vicor relies on dual‑sourcing, long‑term contracts and inventory to mitigate.
| Metric | 2024 |
|---|---|
| GaN/SiC lead times | 26–52 weeks |
| Custom magnetics lead time | 20+ weeks |
| Price premium for spec suppliers | Up to 20% |
| EUV tool cost | ~200 million/unit |
What is included in the product
Detailed Word Document
Tailored Porter's Five Forces analysis for Vicor, uncovering key drivers of competition, supplier and buyer power, entry barriers, and substitutes that shape pricing and profitability; highlights disruptive threats and strategic levers to defend market share for use in investor materials or internal strategy decks.
Customizable Excel Spreadsheet
A concise, one-sheet Porter's Five Forces for Vicor that quantifies competitive pressures, is customizable for evolving scenarios, and export-ready for decks—helping teams quickly pinpoint strategic risks and prioritize mitigation.
Customers Bargaining Power
Large OEM buyers concentrated
Large OEM buyers in enterprise compute, aerospace/defense and automotive are few but sizable, enabling tough pricing, qualification and lifetime support demands; for companies like Vicor a single program often represents more than 10% of revenue, so losing it can materially impact top line, while multi-year agreements trade lower prices for volume predictability and supply stability into 2024.
High switching costs from design-in
Once designed and qualified, Vicor power modules are effectively locked in because revalidation of electrical, thermal and mechanical interfaces commonly requires 6–12 months and significant system retesting, deepening switching costs and moderating buyer power post-design-win. Thermal/mechanical integration increases integration barriers and lifecycle dependency. In 2024 pre-design selection still centers on intense price-performance trade-offs and benchmarking.
Performance-critical procurement
In performance-critical procurement buyers favor efficiency, power density and reliability over lowest unit price, and Vicor cites converter efficiencies up to 98% which helps soften price pressure. Superior specs and space savings enable value-based pricing by lowering total cost of ownership through reduced cooling and footprint. Procurement still benchmarks against rival modules and will request comparative efficiency, thermal and lifecycle data.
Demand cyclicality and forecasting
End markets for Vicor swing with data center and industrial cycles, with 2024 demand volatility shifting inventory risk back to suppliers as buyers delay orders during downturns.
Buyers increasingly use flexibility clauses to manage exposure while Vicor pushes NCNR terms to protect capacity allocation and stabilize production planning in 2024.
- Demand linkage: data center & industrial cycles
- Inventory risk shifts to suppliers
- Buyers use flexibility clauses
- Vicor seeks NCNR to secure capacity
Compliance and support expectations
OEMs demand rigorous documentation, certifications and field engineering, and by 2024 over 60% of power-system OEMs cite certification and on‑site support as decisive purchase criteria. These requirements increase cost‑to‑serve and lengthen sales cycles, giving buyers leverage to use compliance gates to extract price or service concessions. Conversely, robust application and field support lets suppliers command premium margins and faster adoption.
- Compliance burden: raises cost‑to‑serve and extends sales cycles
- Buyer leverage: compliance gates used to negotiate concessions
- Supplier advantage: strong field/app support = premium positioning
OEM concentration, long revalidation, and 98% efficiency sustain value pricing
Large OEMs exert strong price and support demands—single programs often exceed 10% of Vicor revenue—while multi‑year deals trade lower prices for demand visibility into 2024. Post‑design switching costs are high: revalidation typically takes 6–12 months, locking in modules and reducing buyer leverage after design‑win. Performance specs (efficiency up to 98%) enable value pricing despite buyer benchmarking and 2024 demand volatility.
| Metric | Value / Note (2024) |
|---|---|
| Program concentration | >10% revenue per program |
| Certification decisive | 60% of power‑system OEMs cite as decisive |
| Revalidation time | 6–12 months |
| Max converter efficiency | Up to 98% |
What You See Is What You Get
Vicor Porter's Five Forces Analysis
This preview shows the exact Vicor Porter’s Five Forces analysis you'll receive immediately after purchase—fully formatted and ready to use. It contains the complete assessment of competitive rivalry, supplier power, buyer power, threat of substitutes, and threat of new entrants. No samples or placeholders; you’ll get instant access to this same professional document upon payment.











