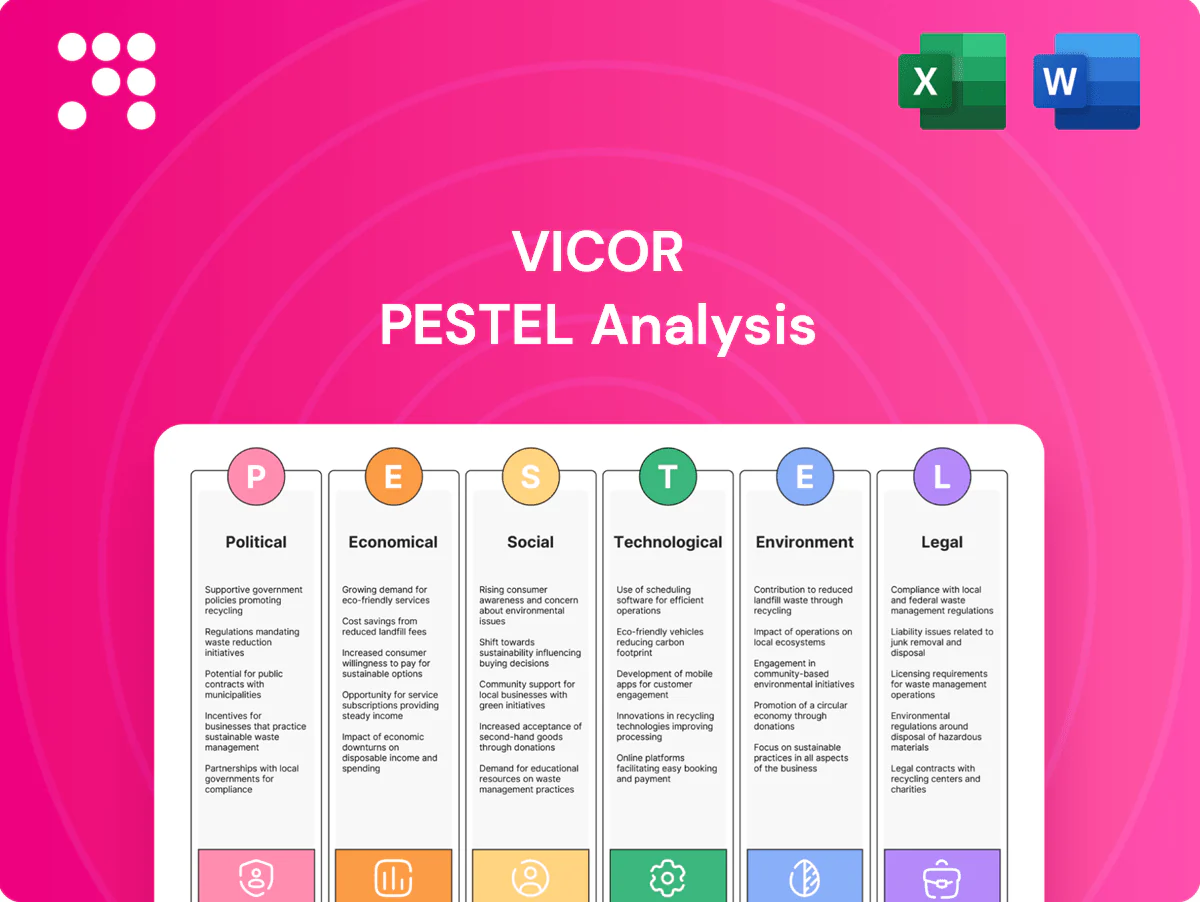
Vicor PESTLE Analysis

Your Competitive Advantage Starts with This Report
Discover how political, economic, social, technological, legal, and environmental forces are shaping Vicor’s trajectory in our concise PESTLE snapshot—perfect for investors and strategists needing fast, actionable context. Dive deeper with the full PESTLE for detailed risks, opportunities, and strategic recommendations. Purchase now to access the complete, editable report instantly.
Political factors

Export controls and defense procurement
AI, aerospace and defense demand for Vicor high-performance power modules is sensitive to U.S. EAR/ITAR and allied export regimes tightened since 2022; U.S. defense spending exceeded $850 billion in 2024, supporting higher domestic procurement even as controls can restrict exports to China and other regions. Stricter controls shrink addressable markets but can raise domestic orders; efficient licensing preserves backlog and lead times and compliant supply chains maintain eligibility for government contracts.
U.S. industrial policy and subsidies
U.S. incentives tied to reshoring and critical electronics, notably the CHIPS and Science Act with roughly 52 billion dollars for semiconductor incentives, plus the Bipartisan Infrastructure Law’s 65 billion for grid modernization, can catalyze capacity investments for Vicor. Grants and tax credits from the Inflation Reduction Act’s ~369 billion clean-energy measures can lower unit costs for advanced packaging and GaN/SiC scaling. Policy-driven programs supporting data centers and electrified transportation create faster design-win pipelines and revenue visibility. Monitoring evolving eligibility criteria directly shapes site selection and capex timing.

Geopolitical supply chain risk
Regional tensions can disrupt substrates, magnetics and semiconductor wafer supply, especially after US export controls tightened since 2022. Diversified sourcing and dual‑region manufacturing mitigate sanctions and logistics shocks. Aerospace and defense customers demand domestically controlled supply under ITAR/NDAA rules. Political risk insurance and buffer inventories (commonly 3–6 months) help stabilize deliveries.

Trade tariffs and standards alignment
Trade tariffs on electronics components and metals (US steel 25%/aluminum 10%; Section 301 tariffs up to 25% on many Chinese goods as of 2024) raise BOM costs and squeeze pricing, often adding 10–25% to component/metal costs. Harmonizing to IEC/UL/DoD eases cross-border certification and reduces market-entry delays. Proactive tariff classification and tariff engineering can protect margins; standards reciprocity affects months of time-to-market for new modules.
- Tariff impact: 10–25% added to BOM
- US measures: steel 25%/aluminum 10%, Section 301 up to 25% (2024)
- Standards harmonization: lowers certification barriers, trims months off launch
- Tariff engineering: preserves gross margin
Government spending cycles
- Defense budget: ~800–850B (2024–25)
- Infrastructure: $1.2T BIL (Bipartisan Infrastructure Law) ongoing
- CRs/elections: recurring award delays, cash conversion risk
- Program-of-records: anchor multi-year factory loading
Export controls drive defense demand; 800-850B, tariffs 10-25%
U.S. export controls (EAR/ITAR since 2022) restrict China access but boost domestic defense orders; US defense spending ~800–850B (2024–25) supports avionics power demand. CHIPS ~$52B, Bipartisan Infrastructure grid ~$65B and IRA ~$369B incentivize reshoring and GaN/SiC scaling; tariffs (10–25%) raise BOM costs, driving supplier diversification and tariff engineering.
| Factor | 2024–25 |
|---|---|
| Defense spend | 800–850B |
| CHIPS | ~52B |
| IRA | ~369B |
| Tariff impact | 10–25% |
What is included in the product
 Detailed Word Document
Explores how external macro-environmental factors uniquely affect Vicor across Political, Economic, Social, Technological, Environmental and Legal dimensions, with data-backed trends, region- and industry-specific examples, forward-looking insights and actionable implications to help executives, consultants and investors identify risks and opportunities.

 Customizable Excel Spreadsheet
A compact, visually segmented PESTLE summary for Vicor that eases stakeholder briefings and strategy sessions. Allows quick risk identification, editable notes for local context, and slide‑ready content for seamless sharing and presentation.
Economic factors

AI/HPC and data center capex cycles
Rapid growth in AI servers, with many AI racks exceeding 30 kW and some up to 60 kW, is boosting demand for high-density 48V direct-to-load conversion for efficiency and thermal reasons. Investment pauses or digest cycles cause lumpiness in orders. Attach rates hinge on rack power architectures and OEM design-ins. Long qualification times (often 6–18 months) create stickiness once adopted.
Input cost volatility
Input cost volatility in copper, rare earths, advanced ceramics and semiconductor die pricing materially pressures gross margins; LME copper averaged about US$9,000 per tonne in 2024. Hedging and aggressive value engineering can blunt short-term spikes. High supplier concentration in die and rare-earth processing raises exposure to price shocks. Passing costs to customers demands a demonstrable efficiency and footprint-driven value proposition.

FX and global revenue mix
Multi-currency sales and sourcing expose Vicor earnings to USD strength, with the U.S. dollar trade-weighted index near 105 mid-2025 amplifying translation effects. Natural hedges from local sourcing and regional revenue offsets mitigate but do not eliminate FX risk. Pricing tiers and localized manufacturing in Asia and Europe cushion volatility, while regional demand telemetry improves forecast accuracy and inventory planning.

Interest rates and capital access
Higher rates raise WACC and customer capex hurdles for industrial projects; Fed funds at 5.25–5.50% and US 10-yr around 4.2% (mid‑2025) have lifted borrowing costs. They also increase inventory carrying costs for long‑lead components. Stable liquidity in 2024–25 supports R&D in new topologies and process automation. Customers may prefer modular retrofits over full system replacements in tight cycles.
- Higher WACC: financing cost up with Fed funds 5.25–5.50%
- Capex hurdles: customers delay large projects
- Inventory: carrying costs increased with rate rise
- Demand shift: modular retrofits favored in constrained cycles
End-market diversification
Vicor’s exposure to computing, industrial automation, EV/transport and aerospace dampens cyclical swings; diversified end-markets helped revenue resilience in 2023–24 as EV adoption surged (≈14 million BEVs/PEVs sold globally in 2023, IEA). Shift toward AI and aerospace design wins can lift ASPs and margins given higher power-density, while cyclical industrial slowdowns are partially offset by secular electrification.
- End-market mix: computing, industrial, EV, A&D
- AI/aerospace tilt: supports higher ASPs/margins
- EV tailwinds: IEA ~14M EVs in 2023
- Risk: need strong design-win pipeline
Export controls drive defense demand; 800-850B, tariffs 10-25%
AI rack growth (30–60 kW) and long 6–18 month qual cycles lift demand stickiness for 48V high‑density conversion, but orders remain lumpy. Input cost pressure persists; LME copper ≈US$9,000/t (2024) and concentrated die/rare‑earth supply risk margins. USD TWI ≈105 (mid‑2025) and Fed funds 5.25–5.50%/US 10‑yr ~4.2% raise WACC and inventory costs.
| Metric | Value | Impact |
|---|---|---|
| AI rack power | 30–60 kW | ↑48V demand |
| Copper price | ~US$9,000/t (2024) | ↑input cost |
| USD TWI | ~105 (mid‑2025) | FX translation risk |
| Rates | Fed 5.25–5.50% | ↑WACC/inventory cost |
What You See Is What You Get
Vicor PESTLE Analysis
The preview of the Vicor PESTLE Analysis is the exact document you’ll receive after purchase—fully formatted and ready to use. The layout, content and structure shown are identical to the downloadable file with no placeholders or teasers. After payment you’ll instantly get this same professionally structured report, so there are no surprises.

Your Competitive Advantage Starts with This Report
Discover how political, economic, social, technological, legal, and environmental forces are shaping Vicor’s trajectory in our concise PESTLE snapshot—perfect for investors and strategists needing fast, actionable context. Dive deeper with the full PESTLE for detailed risks, opportunities, and strategic recommendations. Purchase now to access the complete, editable report instantly.
Political factors
Export controls and defense procurement
AI, aerospace and defense demand for Vicor high-performance power modules is sensitive to U.S. EAR/ITAR and allied export regimes tightened since 2022; U.S. defense spending exceeded $850 billion in 2024, supporting higher domestic procurement even as controls can restrict exports to China and other regions. Stricter controls shrink addressable markets but can raise domestic orders; efficient licensing preserves backlog and lead times and compliant supply chains maintain eligibility for government contracts.
U.S. industrial policy and subsidies
U.S. incentives tied to reshoring and critical electronics, notably the CHIPS and Science Act with roughly 52 billion dollars for semiconductor incentives, plus the Bipartisan Infrastructure Law’s 65 billion for grid modernization, can catalyze capacity investments for Vicor. Grants and tax credits from the Inflation Reduction Act’s ~369 billion clean-energy measures can lower unit costs for advanced packaging and GaN/SiC scaling. Policy-driven programs supporting data centers and electrified transportation create faster design-win pipelines and revenue visibility. Monitoring evolving eligibility criteria directly shapes site selection and capex timing.
Geopolitical supply chain risk
Regional tensions can disrupt substrates, magnetics and semiconductor wafer supply, especially after US export controls tightened since 2022. Diversified sourcing and dual‑region manufacturing mitigate sanctions and logistics shocks. Aerospace and defense customers demand domestically controlled supply under ITAR/NDAA rules. Political risk insurance and buffer inventories (commonly 3–6 months) help stabilize deliveries.
Trade tariffs and standards alignment
Trade tariffs on electronics components and metals (US steel 25%/aluminum 10%; Section 301 tariffs up to 25% on many Chinese goods as of 2024) raise BOM costs and squeeze pricing, often adding 10–25% to component/metal costs. Harmonizing to IEC/UL/DoD eases cross-border certification and reduces market-entry delays. Proactive tariff classification and tariff engineering can protect margins; standards reciprocity affects months of time-to-market for new modules.
- Tariff impact: 10–25% added to BOM
- US measures: steel 25%/aluminum 10%, Section 301 up to 25% (2024)
- Standards harmonization: lowers certification barriers, trims months off launch
- Tariff engineering: preserves gross margin
Government spending cycles
- Defense budget: ~800–850B (2024–25)
- Infrastructure: $1.2T BIL (Bipartisan Infrastructure Law) ongoing
- CRs/elections: recurring award delays, cash conversion risk
- Program-of-records: anchor multi-year factory loading
Export controls drive defense demand; 800-850B, tariffs 10-25%
U.S. export controls (EAR/ITAR since 2022) restrict China access but boost domestic defense orders; US defense spending ~800–850B (2024–25) supports avionics power demand. CHIPS ~$52B, Bipartisan Infrastructure grid ~$65B and IRA ~$369B incentivize reshoring and GaN/SiC scaling; tariffs (10–25%) raise BOM costs, driving supplier diversification and tariff engineering.
| Factor | 2024–25 |
|---|---|
| Defense spend | 800–850B |
| CHIPS | ~52B |
| IRA | ~369B |
| Tariff impact | 10–25% |
What is included in the product
Detailed Word Document
Explores how external macro-environmental factors uniquely affect Vicor across Political, Economic, Social, Technological, Environmental and Legal dimensions, with data-backed trends, region- and industry-specific examples, forward-looking insights and actionable implications to help executives, consultants and investors identify risks and opportunities.
Customizable Excel Spreadsheet
A compact, visually segmented PESTLE summary for Vicor that eases stakeholder briefings and strategy sessions. Allows quick risk identification, editable notes for local context, and slide‑ready content for seamless sharing and presentation.
Economic factors
AI/HPC and data center capex cycles
Rapid growth in AI servers, with many AI racks exceeding 30 kW and some up to 60 kW, is boosting demand for high-density 48V direct-to-load conversion for efficiency and thermal reasons. Investment pauses or digest cycles cause lumpiness in orders. Attach rates hinge on rack power architectures and OEM design-ins. Long qualification times (often 6–18 months) create stickiness once adopted.
Input cost volatility
Input cost volatility in copper, rare earths, advanced ceramics and semiconductor die pricing materially pressures gross margins; LME copper averaged about US$9,000 per tonne in 2024. Hedging and aggressive value engineering can blunt short-term spikes. High supplier concentration in die and rare-earth processing raises exposure to price shocks. Passing costs to customers demands a demonstrable efficiency and footprint-driven value proposition.
FX and global revenue mix
Multi-currency sales and sourcing expose Vicor earnings to USD strength, with the U.S. dollar trade-weighted index near 105 mid-2025 amplifying translation effects. Natural hedges from local sourcing and regional revenue offsets mitigate but do not eliminate FX risk. Pricing tiers and localized manufacturing in Asia and Europe cushion volatility, while regional demand telemetry improves forecast accuracy and inventory planning.
Interest rates and capital access
Higher rates raise WACC and customer capex hurdles for industrial projects; Fed funds at 5.25–5.50% and US 10-yr around 4.2% (mid‑2025) have lifted borrowing costs. They also increase inventory carrying costs for long‑lead components. Stable liquidity in 2024–25 supports R&D in new topologies and process automation. Customers may prefer modular retrofits over full system replacements in tight cycles.
- Higher WACC: financing cost up with Fed funds 5.25–5.50%
- Capex hurdles: customers delay large projects
- Inventory: carrying costs increased with rate rise
- Demand shift: modular retrofits favored in constrained cycles
End-market diversification
Vicor’s exposure to computing, industrial automation, EV/transport and aerospace dampens cyclical swings; diversified end-markets helped revenue resilience in 2023–24 as EV adoption surged (≈14 million BEVs/PEVs sold globally in 2023, IEA). Shift toward AI and aerospace design wins can lift ASPs and margins given higher power-density, while cyclical industrial slowdowns are partially offset by secular electrification.
- End-market mix: computing, industrial, EV, A&D
- AI/aerospace tilt: supports higher ASPs/margins
- EV tailwinds: IEA ~14M EVs in 2023
- Risk: need strong design-win pipeline
Export controls drive defense demand; 800-850B, tariffs 10-25%
AI rack growth (30–60 kW) and long 6–18 month qual cycles lift demand stickiness for 48V high‑density conversion, but orders remain lumpy. Input cost pressure persists; LME copper ≈US$9,000/t (2024) and concentrated die/rare‑earth supply risk margins. USD TWI ≈105 (mid‑2025) and Fed funds 5.25–5.50%/US 10‑yr ~4.2% raise WACC and inventory costs.
| Metric | Value | Impact |
|---|---|---|
| AI rack power | 30–60 kW | ↑48V demand |
| Copper price | ~US$9,000/t (2024) | ↑input cost |
| USD TWI | ~105 (mid‑2025) | FX translation risk |
| Rates | Fed 5.25–5.50% | ↑WACC/inventory cost |
What You See Is What You Get
Vicor PESTLE Analysis
The preview of the Vicor PESTLE Analysis is the exact document you’ll receive after purchase—fully formatted and ready to use. The layout, content and structure shown are identical to the downloadable file with no placeholders or teasers. After payment you’ll instantly get this same professionally structured report, so there are no surprises.
Description
Your Competitive Advantage Starts with This Report
Discover how political, economic, social, technological, legal, and environmental forces are shaping Vicor’s trajectory in our concise PESTLE snapshot—perfect for investors and strategists needing fast, actionable context. Dive deeper with the full PESTLE for detailed risks, opportunities, and strategic recommendations. Purchase now to access the complete, editable report instantly.
Political factors
Export controls and defense procurement
AI, aerospace and defense demand for Vicor high-performance power modules is sensitive to U.S. EAR/ITAR and allied export regimes tightened since 2022; U.S. defense spending exceeded $850 billion in 2024, supporting higher domestic procurement even as controls can restrict exports to China and other regions. Stricter controls shrink addressable markets but can raise domestic orders; efficient licensing preserves backlog and lead times and compliant supply chains maintain eligibility for government contracts.
U.S. industrial policy and subsidies
U.S. incentives tied to reshoring and critical electronics, notably the CHIPS and Science Act with roughly 52 billion dollars for semiconductor incentives, plus the Bipartisan Infrastructure Law’s 65 billion for grid modernization, can catalyze capacity investments for Vicor. Grants and tax credits from the Inflation Reduction Act’s ~369 billion clean-energy measures can lower unit costs for advanced packaging and GaN/SiC scaling. Policy-driven programs supporting data centers and electrified transportation create faster design-win pipelines and revenue visibility. Monitoring evolving eligibility criteria directly shapes site selection and capex timing.
Geopolitical supply chain risk
Regional tensions can disrupt substrates, magnetics and semiconductor wafer supply, especially after US export controls tightened since 2022. Diversified sourcing and dual‑region manufacturing mitigate sanctions and logistics shocks. Aerospace and defense customers demand domestically controlled supply under ITAR/NDAA rules. Political risk insurance and buffer inventories (commonly 3–6 months) help stabilize deliveries.
Trade tariffs and standards alignment
Trade tariffs on electronics components and metals (US steel 25%/aluminum 10%; Section 301 tariffs up to 25% on many Chinese goods as of 2024) raise BOM costs and squeeze pricing, often adding 10–25% to component/metal costs. Harmonizing to IEC/UL/DoD eases cross-border certification and reduces market-entry delays. Proactive tariff classification and tariff engineering can protect margins; standards reciprocity affects months of time-to-market for new modules.
- Tariff impact: 10–25% added to BOM
- US measures: steel 25%/aluminum 10%, Section 301 up to 25% (2024)
- Standards harmonization: lowers certification barriers, trims months off launch
- Tariff engineering: preserves gross margin
Government spending cycles
- Defense budget: ~800–850B (2024–25)
- Infrastructure: $1.2T BIL (Bipartisan Infrastructure Law) ongoing
- CRs/elections: recurring award delays, cash conversion risk
- Program-of-records: anchor multi-year factory loading
Export controls drive defense demand; 800-850B, tariffs 10-25%
U.S. export controls (EAR/ITAR since 2022) restrict China access but boost domestic defense orders; US defense spending ~800–850B (2024–25) supports avionics power demand. CHIPS ~$52B, Bipartisan Infrastructure grid ~$65B and IRA ~$369B incentivize reshoring and GaN/SiC scaling; tariffs (10–25%) raise BOM costs, driving supplier diversification and tariff engineering.
| Factor | 2024–25 |
|---|---|
| Defense spend | 800–850B |
| CHIPS | ~52B |
| IRA | ~369B |
| Tariff impact | 10–25% |
What is included in the product
Detailed Word Document
Explores how external macro-environmental factors uniquely affect Vicor across Political, Economic, Social, Technological, Environmental and Legal dimensions, with data-backed trends, region- and industry-specific examples, forward-looking insights and actionable implications to help executives, consultants and investors identify risks and opportunities.
Customizable Excel Spreadsheet
A compact, visually segmented PESTLE summary for Vicor that eases stakeholder briefings and strategy sessions. Allows quick risk identification, editable notes for local context, and slide‑ready content for seamless sharing and presentation.
Economic factors
AI/HPC and data center capex cycles
Rapid growth in AI servers, with many AI racks exceeding 30 kW and some up to 60 kW, is boosting demand for high-density 48V direct-to-load conversion for efficiency and thermal reasons. Investment pauses or digest cycles cause lumpiness in orders. Attach rates hinge on rack power architectures and OEM design-ins. Long qualification times (often 6–18 months) create stickiness once adopted.
Input cost volatility
Input cost volatility in copper, rare earths, advanced ceramics and semiconductor die pricing materially pressures gross margins; LME copper averaged about US$9,000 per tonne in 2024. Hedging and aggressive value engineering can blunt short-term spikes. High supplier concentration in die and rare-earth processing raises exposure to price shocks. Passing costs to customers demands a demonstrable efficiency and footprint-driven value proposition.
FX and global revenue mix
Multi-currency sales and sourcing expose Vicor earnings to USD strength, with the U.S. dollar trade-weighted index near 105 mid-2025 amplifying translation effects. Natural hedges from local sourcing and regional revenue offsets mitigate but do not eliminate FX risk. Pricing tiers and localized manufacturing in Asia and Europe cushion volatility, while regional demand telemetry improves forecast accuracy and inventory planning.
Interest rates and capital access
Higher rates raise WACC and customer capex hurdles for industrial projects; Fed funds at 5.25–5.50% and US 10-yr around 4.2% (mid‑2025) have lifted borrowing costs. They also increase inventory carrying costs for long‑lead components. Stable liquidity in 2024–25 supports R&D in new topologies and process automation. Customers may prefer modular retrofits over full system replacements in tight cycles.
- Higher WACC: financing cost up with Fed funds 5.25–5.50%
- Capex hurdles: customers delay large projects
- Inventory: carrying costs increased with rate rise
- Demand shift: modular retrofits favored in constrained cycles
End-market diversification
Vicor’s exposure to computing, industrial automation, EV/transport and aerospace dampens cyclical swings; diversified end-markets helped revenue resilience in 2023–24 as EV adoption surged (≈14 million BEVs/PEVs sold globally in 2023, IEA). Shift toward AI and aerospace design wins can lift ASPs and margins given higher power-density, while cyclical industrial slowdowns are partially offset by secular electrification.
- End-market mix: computing, industrial, EV, A&D
- AI/aerospace tilt: supports higher ASPs/margins
- EV tailwinds: IEA ~14M EVs in 2023
- Risk: need strong design-win pipeline
Export controls drive defense demand; 800-850B, tariffs 10-25%
AI rack growth (30–60 kW) and long 6–18 month qual cycles lift demand stickiness for 48V high‑density conversion, but orders remain lumpy. Input cost pressure persists; LME copper ≈US$9,000/t (2024) and concentrated die/rare‑earth supply risk margins. USD TWI ≈105 (mid‑2025) and Fed funds 5.25–5.50%/US 10‑yr ~4.2% raise WACC and inventory costs.
| Metric | Value | Impact |
|---|---|---|
| AI rack power | 30–60 kW | ↑48V demand |
| Copper price | ~US$9,000/t (2024) | ↑input cost |
| USD TWI | ~105 (mid‑2025) | FX translation risk |
| Rates | Fed 5.25–5.50% | ↑WACC/inventory cost |
What You See Is What You Get
Vicor PESTLE Analysis
The preview of the Vicor PESTLE Analysis is the exact document you’ll receive after purchase—fully formatted and ready to use. The layout, content and structure shown are identical to the downloadable file with no placeholders or teasers. After payment you’ll instantly get this same professionally structured report, so there are no surprises.











