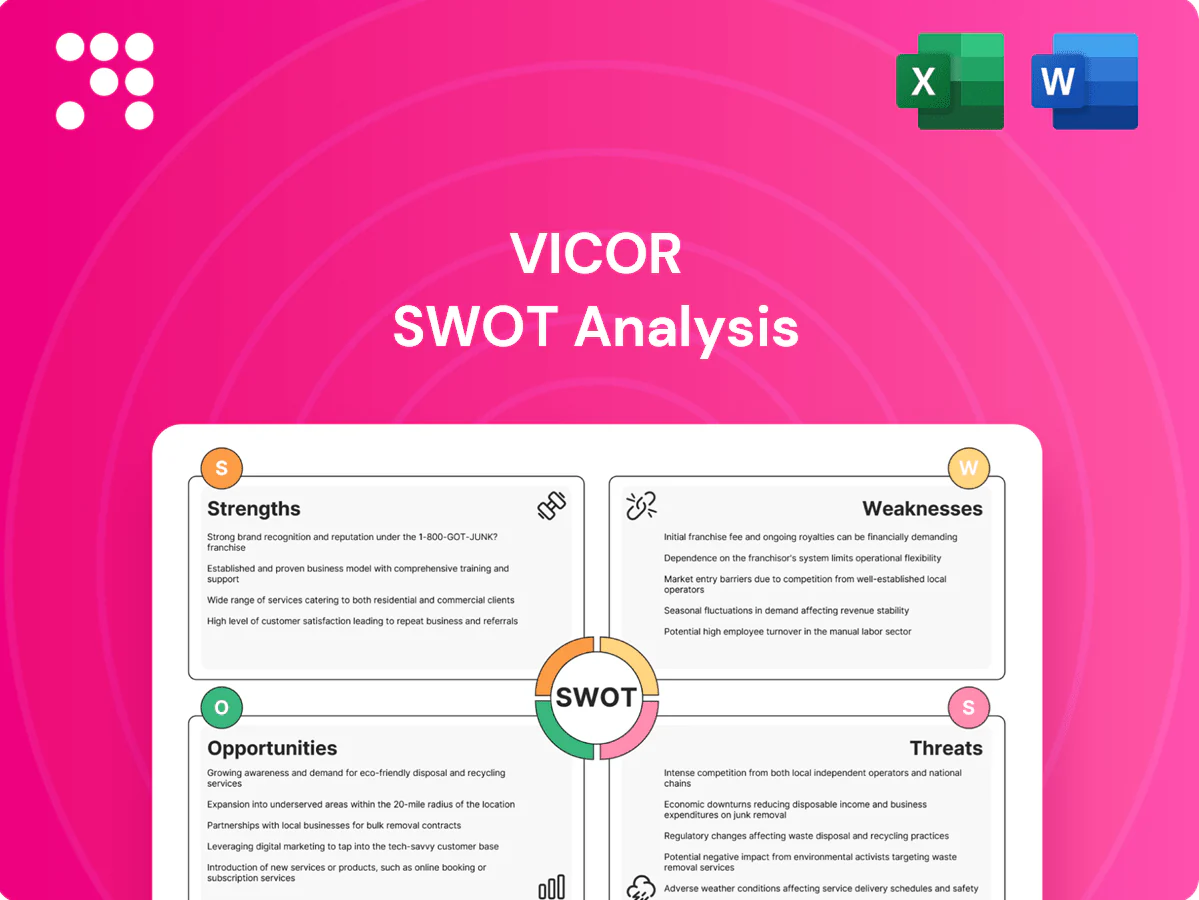
Vicor SWOT Analysis

Elevate Your Analysis with the Complete SWOT Report
Explore Vicor’s strategic position with our concise SWOT snapshot—identifying powertrain wins in power modules, supply-chain vulnerabilities, and market expansion levers. Want the full picture? Purchase the complete SWOT analysis for a research-backed, editable Word and Excel package to support investing, planning, and presentations.
Strengths

Patented high-density power technology
Vicor’s proprietary architectures deliver industry-leading power density (>100 W/in3) and up to 98% conversion efficiency, enabling smaller, lighter systems without performance loss. A broad patents portfolio supports defensible differentiation and pricing power. Patents also raise technical and commercial barriers to entry for rivals.
Modular, scalable product architecture
Vicor’s modular, scalable product architecture uses building-block modules that simplify complex power design and accelerate time-to-market, allowing customers to scale from watts to kilowatts with common components. This commonality reduces engineering risk and inventory complexity by enabling reuse across platforms. The approach supports customization without full redesigns, shortening development cycles and enabling faster deployment.

Strong fit for demanding applications
Vicor (NASDAQ: VICR) targets high-performance computing, industrial automation, automotive, transportation and aerospace/defense, markets that prize SWaP-C and reliability. Its power modules deliver up to 98% efficiency and power densities exceeding 1 kW/in3, amplifying value in high-end use cases. Those technical gains support premium positioning and adoption in mission-critical systems.

Quality, reliability, and application expertise
Design-in support and rigorous qualification underpin Vicor adoption in mission-critical systems, driving high customer confidence. High MTBF and superior thermal performance lower OEM lifecycle costs and warranty exposure. Deep application expertise shortens customer development cycles, reinforcing stickiness and repeat business.
- Design-in support: accelerates adoption
- Reliability: reduces lifecycle cost
- Application know-how: shortens development, boosts repeat sales
End-market diversification
Vicor’s exposure across data center/HPC, industrial, automotive and aerospace mitigates single-sector shocks by distributing demand drivers and different investment cycles that can smooth revenue volatility. Cross-industry learnings accelerate product roadmap refinement and enable reuse of high-performance power architectures. The breadth of end markets also expands partner and channel ecosystems, supporting volume scaling and design wins.
- End-market breadth: data center/HPC, industrial, automotive, aerospace
- Revenue smoothing: staggered investment cycles
- Product benefit: cross-industry R&D feedback
- Channel effect: wider partner ecosystem
High-efficiency, ultra-dense power modules cut design risk and enable premium, diversified demand
Vicor delivers up to 98% conversion efficiency and industry-leading power density, enabling smaller, lighter systems. Proprietary patents and modular architectures reduce design risk and accelerate time-to-market, supporting premium pricing. Broad end-market exposure (data center, industrial, automotive, aerospace) diversifies demand and reinforces repeat business.
| Metric | Value |
|---|---|
| Peak Efficiency | Up to 98% |
| Power Density | >100 W/in3 |
| End Markets | HPC, industrial, automotive, aerospace |
What is included in the product
 Detailed Word Document
Provides a concise strategic overview of Vicor’s internal capabilities and external market factors, outlining strengths, weaknesses, opportunities, and threats to assess its competitive position and growth prospects.

 Customizable Excel Spreadsheet
Provides a concise, visually clean Vicor SWOT matrix for rapid strategy alignment and stakeholder-ready summaries; editable format enables quick updates to reflect shifting market, technology, or product priorities.
Weaknesses

Customer and program concentration
Large design wins can drive outsized revenue dependency; delays or cancellations of those key programs can materially swing quarterly results. Pricing leverage often accrues to a few OEMs, compressing margins and reducing negotiating power. This concentration makes forecasting lumpy and less predictable, increasing working-capital and inventory risk.
Premium pricing versus commoditized alternatives
Vicor’s high-performance power modules command materially higher ASPs than discrete or lower-spec alternatives, contributing to premium positioning but limiting price elasticity; Vicor reported roughly $348 million in revenue for fiscal 2024. Cost-sensitive segments — industrial and commodity datacenter buyers — often resist adoption despite potential efficiency gains, requiring demonstrable system-level ROI. Proving value at the system level lengthens sales cycles and increases deployment friction.

Long design-in cycles and qualification
Complex power systems for automotive and aerospace require 12–36 month validation and certification cycles (e.g., AEC-Q, DO-160), so Vicor design-ins often take quarters to years to convert to production revenue. Any late-stage spec change can reset timelines and add requalification costs, slowing go-to-market. Revenue scalability therefore hinges on sustained multi-year program execution and repeatable qualifications across OEM programs.

Manufacturing complexity and supply constraints
Advanced materials, magnetic components and dense packaging intensify supply-chain strain for Vicor, while tight mechanical tolerances and demanding thermal management raise production difficulty and scrap risk; capacity ramps need significant capital and lead time, so disruptions can quickly reduce yield and extend customer lead times.
- Supply-chain concentration risks
- High precision & thermal challenges
- Capital- and time-intensive capacity ramps
- Disruption-driven yield and lead-time volatility
High R&D intensity
High R&D intensity forces continuous capital allocation to maintain leadership in power density and efficiency; success hinges on winning next-generation platform designs, and failure to hit nodes can quickly erode margins and market share while budget pressure narrows strategic optionality.
- Continuous high spend limits cash flexibility
- Platform wins determine ROI and margins
- Missed nodes accelerate margin erosion
Revenue concentration and long 12–36 months qualification cycles; FY2024 sales $348M
Revenue concentration on large design wins creates lumpy quarterly results; Vicor reported $348 million in fiscal 2024. Long 12–36 month automotive/aerospace qualification cycles slow conversions and increase requalification risk. High ASPs limit price elasticity in cost-sensitive segments. Complex materials and dense packaging elevate supply-chain, yield and ramp capital requirements.
| Metric | Value/Note |
|---|---|
| FY2024 Revenue | $348 million |
| Qualification lead time | 12–36 months |
| Customer concentration | High; large OEM design wins drive outsized share |
Same Document Delivered
Vicor SWOT Analysis
This is the actual SWOT analysis document you’ll receive upon purchase—no surprises, just professional quality. The preview below is taken directly from the full Vicor SWOT report and reflects the structure and depth of the final, editable file. Purchase unlocks the complete version immediately after checkout.

Elevate Your Analysis with the Complete SWOT Report
Explore Vicor’s strategic position with our concise SWOT snapshot—identifying powertrain wins in power modules, supply-chain vulnerabilities, and market expansion levers. Want the full picture? Purchase the complete SWOT analysis for a research-backed, editable Word and Excel package to support investing, planning, and presentations.
Strengths
Patented high-density power technology
Vicor’s proprietary architectures deliver industry-leading power density (>100 W/in3) and up to 98% conversion efficiency, enabling smaller, lighter systems without performance loss. A broad patents portfolio supports defensible differentiation and pricing power. Patents also raise technical and commercial barriers to entry for rivals.
Modular, scalable product architecture
Vicor’s modular, scalable product architecture uses building-block modules that simplify complex power design and accelerate time-to-market, allowing customers to scale from watts to kilowatts with common components. This commonality reduces engineering risk and inventory complexity by enabling reuse across platforms. The approach supports customization without full redesigns, shortening development cycles and enabling faster deployment.
Strong fit for demanding applications
Vicor (NASDAQ: VICR) targets high-performance computing, industrial automation, automotive, transportation and aerospace/defense, markets that prize SWaP-C and reliability. Its power modules deliver up to 98% efficiency and power densities exceeding 1 kW/in3, amplifying value in high-end use cases. Those technical gains support premium positioning and adoption in mission-critical systems.
Quality, reliability, and application expertise
Design-in support and rigorous qualification underpin Vicor adoption in mission-critical systems, driving high customer confidence. High MTBF and superior thermal performance lower OEM lifecycle costs and warranty exposure. Deep application expertise shortens customer development cycles, reinforcing stickiness and repeat business.
- Design-in support: accelerates adoption
- Reliability: reduces lifecycle cost
- Application know-how: shortens development, boosts repeat sales
End-market diversification
Vicor’s exposure across data center/HPC, industrial, automotive and aerospace mitigates single-sector shocks by distributing demand drivers and different investment cycles that can smooth revenue volatility. Cross-industry learnings accelerate product roadmap refinement and enable reuse of high-performance power architectures. The breadth of end markets also expands partner and channel ecosystems, supporting volume scaling and design wins.
- End-market breadth: data center/HPC, industrial, automotive, aerospace
- Revenue smoothing: staggered investment cycles
- Product benefit: cross-industry R&D feedback
- Channel effect: wider partner ecosystem
High-efficiency, ultra-dense power modules cut design risk and enable premium, diversified demand
Vicor delivers up to 98% conversion efficiency and industry-leading power density, enabling smaller, lighter systems. Proprietary patents and modular architectures reduce design risk and accelerate time-to-market, supporting premium pricing. Broad end-market exposure (data center, industrial, automotive, aerospace) diversifies demand and reinforces repeat business.
| Metric | Value |
|---|---|
| Peak Efficiency | Up to 98% |
| Power Density | >100 W/in3 |
| End Markets | HPC, industrial, automotive, aerospace |
What is included in the product
Detailed Word Document
Provides a concise strategic overview of Vicor’s internal capabilities and external market factors, outlining strengths, weaknesses, opportunities, and threats to assess its competitive position and growth prospects.
Customizable Excel Spreadsheet
Provides a concise, visually clean Vicor SWOT matrix for rapid strategy alignment and stakeholder-ready summaries; editable format enables quick updates to reflect shifting market, technology, or product priorities.
Weaknesses
Customer and program concentration
Large design wins can drive outsized revenue dependency; delays or cancellations of those key programs can materially swing quarterly results. Pricing leverage often accrues to a few OEMs, compressing margins and reducing negotiating power. This concentration makes forecasting lumpy and less predictable, increasing working-capital and inventory risk.
Premium pricing versus commoditized alternatives
Vicor’s high-performance power modules command materially higher ASPs than discrete or lower-spec alternatives, contributing to premium positioning but limiting price elasticity; Vicor reported roughly $348 million in revenue for fiscal 2024. Cost-sensitive segments — industrial and commodity datacenter buyers — often resist adoption despite potential efficiency gains, requiring demonstrable system-level ROI. Proving value at the system level lengthens sales cycles and increases deployment friction.
Long design-in cycles and qualification
Complex power systems for automotive and aerospace require 12–36 month validation and certification cycles (e.g., AEC-Q, DO-160), so Vicor design-ins often take quarters to years to convert to production revenue. Any late-stage spec change can reset timelines and add requalification costs, slowing go-to-market. Revenue scalability therefore hinges on sustained multi-year program execution and repeatable qualifications across OEM programs.
Manufacturing complexity and supply constraints
Advanced materials, magnetic components and dense packaging intensify supply-chain strain for Vicor, while tight mechanical tolerances and demanding thermal management raise production difficulty and scrap risk; capacity ramps need significant capital and lead time, so disruptions can quickly reduce yield and extend customer lead times.
- Supply-chain concentration risks
- High precision & thermal challenges
- Capital- and time-intensive capacity ramps
- Disruption-driven yield and lead-time volatility
High R&D intensity
High R&D intensity forces continuous capital allocation to maintain leadership in power density and efficiency; success hinges on winning next-generation platform designs, and failure to hit nodes can quickly erode margins and market share while budget pressure narrows strategic optionality.
- Continuous high spend limits cash flexibility
- Platform wins determine ROI and margins
- Missed nodes accelerate margin erosion
Revenue concentration and long 12–36 months qualification cycles; FY2024 sales $348M
Revenue concentration on large design wins creates lumpy quarterly results; Vicor reported $348 million in fiscal 2024. Long 12–36 month automotive/aerospace qualification cycles slow conversions and increase requalification risk. High ASPs limit price elasticity in cost-sensitive segments. Complex materials and dense packaging elevate supply-chain, yield and ramp capital requirements.
| Metric | Value/Note |
|---|---|
| FY2024 Revenue | $348 million |
| Qualification lead time | 12–36 months |
| Customer concentration | High; large OEM design wins drive outsized share |
Same Document Delivered
Vicor SWOT Analysis
This is the actual SWOT analysis document you’ll receive upon purchase—no surprises, just professional quality. The preview below is taken directly from the full Vicor SWOT report and reflects the structure and depth of the final, editable file. Purchase unlocks the complete version immediately after checkout.
Original: $10.00
-65%$10.00
$3.50Description
Elevate Your Analysis with the Complete SWOT Report
Explore Vicor’s strategic position with our concise SWOT snapshot—identifying powertrain wins in power modules, supply-chain vulnerabilities, and market expansion levers. Want the full picture? Purchase the complete SWOT analysis for a research-backed, editable Word and Excel package to support investing, planning, and presentations.
Strengths
Patented high-density power technology
Vicor’s proprietary architectures deliver industry-leading power density (>100 W/in3) and up to 98% conversion efficiency, enabling smaller, lighter systems without performance loss. A broad patents portfolio supports defensible differentiation and pricing power. Patents also raise technical and commercial barriers to entry for rivals.
Modular, scalable product architecture
Vicor’s modular, scalable product architecture uses building-block modules that simplify complex power design and accelerate time-to-market, allowing customers to scale from watts to kilowatts with common components. This commonality reduces engineering risk and inventory complexity by enabling reuse across platforms. The approach supports customization without full redesigns, shortening development cycles and enabling faster deployment.
Strong fit for demanding applications
Vicor (NASDAQ: VICR) targets high-performance computing, industrial automation, automotive, transportation and aerospace/defense, markets that prize SWaP-C and reliability. Its power modules deliver up to 98% efficiency and power densities exceeding 1 kW/in3, amplifying value in high-end use cases. Those technical gains support premium positioning and adoption in mission-critical systems.
Quality, reliability, and application expertise
Design-in support and rigorous qualification underpin Vicor adoption in mission-critical systems, driving high customer confidence. High MTBF and superior thermal performance lower OEM lifecycle costs and warranty exposure. Deep application expertise shortens customer development cycles, reinforcing stickiness and repeat business.
- Design-in support: accelerates adoption
- Reliability: reduces lifecycle cost
- Application know-how: shortens development, boosts repeat sales
End-market diversification
Vicor’s exposure across data center/HPC, industrial, automotive and aerospace mitigates single-sector shocks by distributing demand drivers and different investment cycles that can smooth revenue volatility. Cross-industry learnings accelerate product roadmap refinement and enable reuse of high-performance power architectures. The breadth of end markets also expands partner and channel ecosystems, supporting volume scaling and design wins.
- End-market breadth: data center/HPC, industrial, automotive, aerospace
- Revenue smoothing: staggered investment cycles
- Product benefit: cross-industry R&D feedback
- Channel effect: wider partner ecosystem
High-efficiency, ultra-dense power modules cut design risk and enable premium, diversified demand
Vicor delivers up to 98% conversion efficiency and industry-leading power density, enabling smaller, lighter systems. Proprietary patents and modular architectures reduce design risk and accelerate time-to-market, supporting premium pricing. Broad end-market exposure (data center, industrial, automotive, aerospace) diversifies demand and reinforces repeat business.
| Metric | Value |
|---|---|
| Peak Efficiency | Up to 98% |
| Power Density | >100 W/in3 |
| End Markets | HPC, industrial, automotive, aerospace |
What is included in the product
Detailed Word Document
Provides a concise strategic overview of Vicor’s internal capabilities and external market factors, outlining strengths, weaknesses, opportunities, and threats to assess its competitive position and growth prospects.
Customizable Excel Spreadsheet
Provides a concise, visually clean Vicor SWOT matrix for rapid strategy alignment and stakeholder-ready summaries; editable format enables quick updates to reflect shifting market, technology, or product priorities.
Weaknesses
Customer and program concentration
Large design wins can drive outsized revenue dependency; delays or cancellations of those key programs can materially swing quarterly results. Pricing leverage often accrues to a few OEMs, compressing margins and reducing negotiating power. This concentration makes forecasting lumpy and less predictable, increasing working-capital and inventory risk.
Premium pricing versus commoditized alternatives
Vicor’s high-performance power modules command materially higher ASPs than discrete or lower-spec alternatives, contributing to premium positioning but limiting price elasticity; Vicor reported roughly $348 million in revenue for fiscal 2024. Cost-sensitive segments — industrial and commodity datacenter buyers — often resist adoption despite potential efficiency gains, requiring demonstrable system-level ROI. Proving value at the system level lengthens sales cycles and increases deployment friction.
Long design-in cycles and qualification
Complex power systems for automotive and aerospace require 12–36 month validation and certification cycles (e.g., AEC-Q, DO-160), so Vicor design-ins often take quarters to years to convert to production revenue. Any late-stage spec change can reset timelines and add requalification costs, slowing go-to-market. Revenue scalability therefore hinges on sustained multi-year program execution and repeatable qualifications across OEM programs.
Manufacturing complexity and supply constraints
Advanced materials, magnetic components and dense packaging intensify supply-chain strain for Vicor, while tight mechanical tolerances and demanding thermal management raise production difficulty and scrap risk; capacity ramps need significant capital and lead time, so disruptions can quickly reduce yield and extend customer lead times.
- Supply-chain concentration risks
- High precision & thermal challenges
- Capital- and time-intensive capacity ramps
- Disruption-driven yield and lead-time volatility
High R&D intensity
High R&D intensity forces continuous capital allocation to maintain leadership in power density and efficiency; success hinges on winning next-generation platform designs, and failure to hit nodes can quickly erode margins and market share while budget pressure narrows strategic optionality.
- Continuous high spend limits cash flexibility
- Platform wins determine ROI and margins
- Missed nodes accelerate margin erosion
Revenue concentration and long 12–36 months qualification cycles; FY2024 sales $348M
Revenue concentration on large design wins creates lumpy quarterly results; Vicor reported $348 million in fiscal 2024. Long 12–36 month automotive/aerospace qualification cycles slow conversions and increase requalification risk. High ASPs limit price elasticity in cost-sensitive segments. Complex materials and dense packaging elevate supply-chain, yield and ramp capital requirements.
| Metric | Value/Note |
|---|---|
| FY2024 Revenue | $348 million |
| Qualification lead time | 12–36 months |
| Customer concentration | High; large OEM design wins drive outsized share |
Same Document Delivered
Vicor SWOT Analysis
This is the actual SWOT analysis document you’ll receive upon purchase—no surprises, just professional quality. The preview below is taken directly from the full Vicor SWOT report and reflects the structure and depth of the final, editable file. Purchase unlocks the complete version immediately after checkout.











