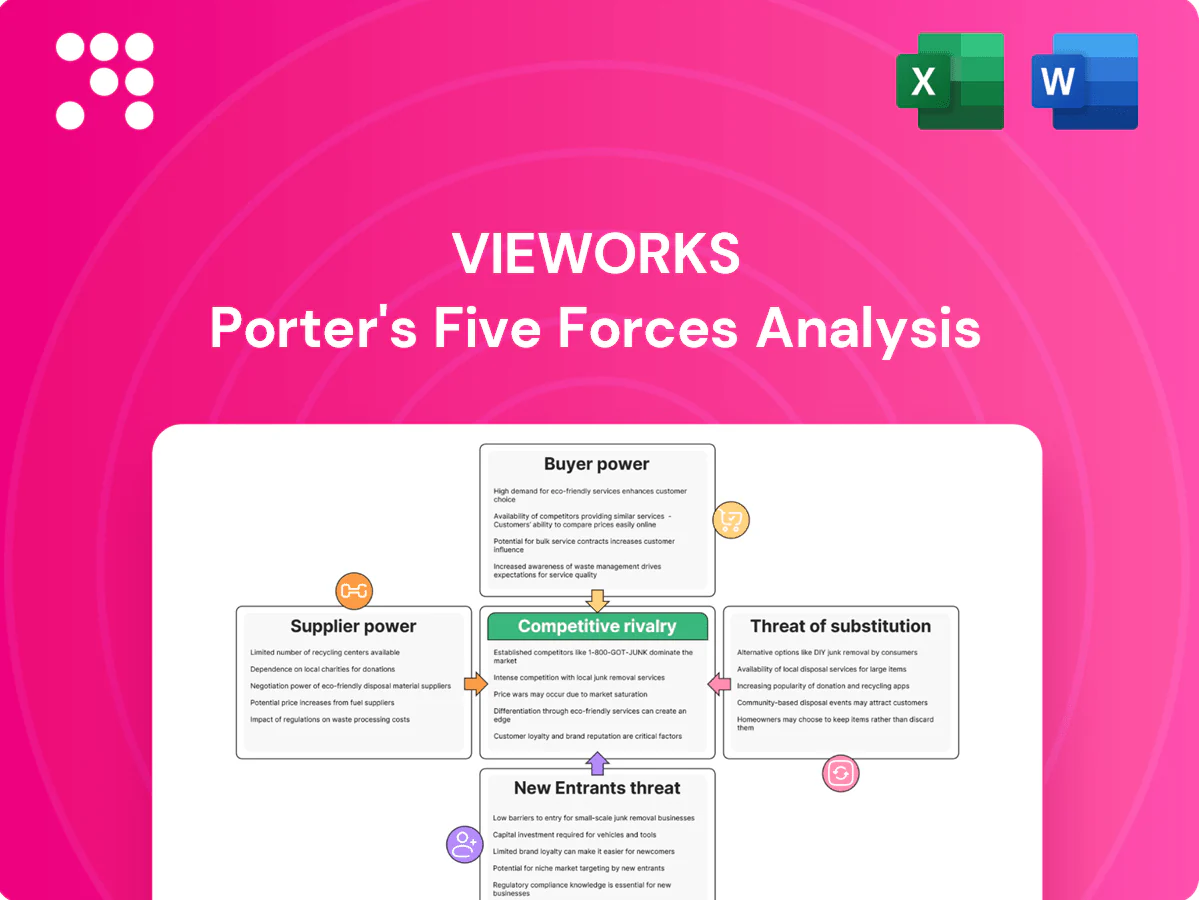
Vieworks Porter's Five Forces Analysis

A Must-Have Tool for Decision-Makers
Vieworks’s Porter's Five Forces snapshot highlights competitive intensity, supplier and buyer leverage, and potential substitute threats shaping its market outlook. The brief identifies key strategic pressures and where Vieworks may have structural advantages or vulnerabilities. This preview only scratches the surface—unlock the full Porter's Five Forces Analysis for force-by-force ratings, visuals, and actionable recommendations to inform investment or strategic decisions.
Suppliers Bargaining Power

Concentrated sensor and scintillator sources
High-performance CMOS sensors, CsI and Gadox scintillators and specialty optics are sourced from a small pool of qualified vendors, with the top three CMOS suppliers holding over 60% global share in 2024, giving suppliers leverage on pricing, allocation and contract terms during tight cycles. Dual-sourcing is possible but typically requires 12–24 months of qualification. Vieworks must trade off peak performance specs against supply security to mitigate supplier pressure.
Qualification-driven switching costs
Imaging components require rigorous validation for image quality, reliability, and regulatory compliance. Switching suppliers can delay programs and risk certification setbacks; FDA 510(k) clearance typically takes 3–12 months. These switching frictions raise supplier power for medical‑grade parts. Long‑term agreements and modular design can partially offset this.

Semiconductor and FPGA/camera IC cycles
Lead times for FPGAs, ADCs and interface ICs swing with global semiconductor cycles, often ranging from under 4 weeks in soft periods to 20–30+ weeks in up-cycles; in 2024 allocation-driven delays were widely reported across camera supply chains. In up-cycles allocation risk tilts bargaining power to suppliers and can inflate input costs (price uplifts in 2024 commonly cited in the mid-single to low-double digits). Buffer inventory and redesigns to broader footprints mitigate shortages but add carrying cost and engineering complexity, and supply assurances increasingly become negotiation levers exchanged for price concessions.

Special materials and process know-how
Specialized inputs—rare-earth coatings, precision glass, shielding and vacuum/packaging processes—are concentrated: China accounted for roughly 70% of rare-earth processing capacity in 2024, and few suppliers can meet DQE/MTF and low-noise targets at scale. Process IP and yield learning curves embed supplier advantages, narrowing substitution and sustaining vendor bargaining strength with elevated switching costs.
- Rare-earth processing ~70% China (2024)
- Process IP creates long tail on yield improvements
- Few vendors meet DQE/MTF & low-noise at volume
Geopolitical and logistics exposure
Cross-border sourcing of sensors, scintillators and electronics exposes Vieworks to tariffs, export controls and freight disruptions; suppliers commonly pass through costs or shift customers, increasing supplier leverage. US CHIPS Act ($52 billion) and other regional incentives have pushed regionalization, but reconfiguring supply chains typically takes 18–36 months and material capex.
- Tariff/export risk: higher pass-through
- Freight volatility: affects margins
- Regionalize: reduces risk but costly (18–36 months)
Supplier dominance: top CMOS, China rare-earths drive prices, long lead times persist
Suppliers hold strong leverage: top‑three CMOS >60% global share (2024) and rare‑earth processing ~70% China (2024), driving pricing and allocation power. Long qual cycles (12–24 months) and validation/FDA friction amplify switching costs; lead times spiked to 20–30+ weeks in 2024 with mid‑single to low‑double digit price uplifts. Long contracts, inventory and regionalization reduce but do not eliminate supplier power.
| Metric | 2024 |
|---|---|
| Top‑3 CMOS share | >60% |
| Rare‑earth processing | ~70% China |
| Lead times (up‑cycle) | 20–30+ weeks |
| Price uplifts | mid‑single to low‑double % |
What is included in the product
 Detailed Word Document
Tailored Porter’s Five Forces analysis for Vieworks that uncovers key drivers of competition, buyer and supplier power, threat of entrants and substitutes, and highlights disruptive risks and protective dynamics to inform strategic positioning and investor materials.

 Customizable Excel Spreadsheet
Vieworks Porter's Five Forces gives a one-sheet summary with an interactive radar chart—instantly revealing strategic pressures and customizable pressure levels for quick decision-making and slide-ready outputs.
Customers Bargaining Power

Large OEM and hospital system buyers
Major medical OEMs and hospital procurement networks pool volumes and negotiate aggressively, commonly securing discounts of 10–30% and multi-year tenders of 3–5 years that compress margins and extend payment terms to 60–180 days. In industrial NDT, global integrators exercise similar leverage, bundling purchases across regions to demand lower unit prices. Vieworks often must trade price for design wins and capture lifecycle revenue via service, consumables and upgrade contracts.
High spec transparency and benchmarking
In 2024 buyers routinely compare DQE, MTF, noise, frame rate and dose across vendors, using independent benchmarks that make price-performance tradeoffs highly transparent. Clear benchmarks intensify bargaining as purchasers demand measurable gains. Superior image processing and software can reduce pure price pressure by improving clinical throughput. Published clinical and industrial outcome data strengthen negotiating leverage.

Moderate switching costs for integrators
System integration, calibration and certification create measurable switching frictions for integrators but are not prohibitive; OEMs often qualify second sources to gain pricing leverage. Embedded SDKs and proprietary interfaces raise stickiness, while open standards (GenICam, GigE Vision) limit lock‑in. Aftermarket service contracts and 99.9% uptime SLAs materially boost retention.

Budget constraints and TCO focus
Hospitals face heightened capital budget scrutiny and industrial buyers prioritize ROI and throughput, driving negotiations toward total cost of ownership—warranty, uptime, and service bundles matter more than unit price. Customers demand proven durability and rapid support, shifting purchase decisions to lifecycle economics where maintenance and reliability blunt replacement costs. This makes service-level commitments and mean time to repair decisive factors.
- Warranty length and uptime guarantees
- Service response time and spare-parts availability
- Lifecycle cost per throughput unit
- Proven MTBF and field durability
Demand cyclicality and project-based orders
Imaging capex follows macro cycles, reimbursement shifts and factory investment waves, driving project-based orders that buyers often delay or batch, pressuring Vieworks for discounts during downturns; volume swings—often reaching +/-20% in cyclical troughs—amplify buyer power and margin pressure in 2024. Framework agreements and diversification across medical, industrial and security end-markets help smooth demand and reduce single-cycle exposure.
- cyclical volatility: +/-20% volume swings
- buyer behavior: order batching and discounting in downturns
- mitigation: framework agreements
- diversification: medical, industrial, security markets
Buyers gain leverage: 10–30% discounts, lifecycle SLAs
Large hospital networks and OEMs secure 10–30% discounts and 3–5 year tenders, extending payment terms to 60–180 days, compressing margins. Independent benchmarks (DQE, MTF, dose) make price-performance transparent, increasing buyer leverage. Service, warranties and uptime (99.9% SLA) shift negotiations to lifecycle costs, mitigating pure price pressure.
| Metric | 2024 Value |
|---|---|
| Discounts | 10–30% |
| Payment terms | 60–180 days |
Preview Before You Purchase
Vieworks Porter's Five Forces Analysis
This preview shows the exact Vieworks Porter's Five Forces analysis you'll receive immediately after purchase—no placeholders or samples. The document is fully formatted and ready for download and use the moment you buy. You’re viewing the final deliverable, identical to the file provided after payment.

A Must-Have Tool for Decision-Makers
Vieworks’s Porter's Five Forces snapshot highlights competitive intensity, supplier and buyer leverage, and potential substitute threats shaping its market outlook. The brief identifies key strategic pressures and where Vieworks may have structural advantages or vulnerabilities. This preview only scratches the surface—unlock the full Porter's Five Forces Analysis for force-by-force ratings, visuals, and actionable recommendations to inform investment or strategic decisions.
Suppliers Bargaining Power
Concentrated sensor and scintillator sources
High-performance CMOS sensors, CsI and Gadox scintillators and specialty optics are sourced from a small pool of qualified vendors, with the top three CMOS suppliers holding over 60% global share in 2024, giving suppliers leverage on pricing, allocation and contract terms during tight cycles. Dual-sourcing is possible but typically requires 12–24 months of qualification. Vieworks must trade off peak performance specs against supply security to mitigate supplier pressure.
Qualification-driven switching costs
Imaging components require rigorous validation for image quality, reliability, and regulatory compliance. Switching suppliers can delay programs and risk certification setbacks; FDA 510(k) clearance typically takes 3–12 months. These switching frictions raise supplier power for medical‑grade parts. Long‑term agreements and modular design can partially offset this.
Semiconductor and FPGA/camera IC cycles
Lead times for FPGAs, ADCs and interface ICs swing with global semiconductor cycles, often ranging from under 4 weeks in soft periods to 20–30+ weeks in up-cycles; in 2024 allocation-driven delays were widely reported across camera supply chains. In up-cycles allocation risk tilts bargaining power to suppliers and can inflate input costs (price uplifts in 2024 commonly cited in the mid-single to low-double digits). Buffer inventory and redesigns to broader footprints mitigate shortages but add carrying cost and engineering complexity, and supply assurances increasingly become negotiation levers exchanged for price concessions.
Special materials and process know-how
Specialized inputs—rare-earth coatings, precision glass, shielding and vacuum/packaging processes—are concentrated: China accounted for roughly 70% of rare-earth processing capacity in 2024, and few suppliers can meet DQE/MTF and low-noise targets at scale. Process IP and yield learning curves embed supplier advantages, narrowing substitution and sustaining vendor bargaining strength with elevated switching costs.
- Rare-earth processing ~70% China (2024)
- Process IP creates long tail on yield improvements
- Few vendors meet DQE/MTF & low-noise at volume
Geopolitical and logistics exposure
Cross-border sourcing of sensors, scintillators and electronics exposes Vieworks to tariffs, export controls and freight disruptions; suppliers commonly pass through costs or shift customers, increasing supplier leverage. US CHIPS Act ($52 billion) and other regional incentives have pushed regionalization, but reconfiguring supply chains typically takes 18–36 months and material capex.
- Tariff/export risk: higher pass-through
- Freight volatility: affects margins
- Regionalize: reduces risk but costly (18–36 months)
Supplier dominance: top CMOS, China rare-earths drive prices, long lead times persist
Suppliers hold strong leverage: top‑three CMOS >60% global share (2024) and rare‑earth processing ~70% China (2024), driving pricing and allocation power. Long qual cycles (12–24 months) and validation/FDA friction amplify switching costs; lead times spiked to 20–30+ weeks in 2024 with mid‑single to low‑double digit price uplifts. Long contracts, inventory and regionalization reduce but do not eliminate supplier power.
| Metric | 2024 |
|---|---|
| Top‑3 CMOS share | >60% |
| Rare‑earth processing | ~70% China |
| Lead times (up‑cycle) | 20–30+ weeks |
| Price uplifts | mid‑single to low‑double % |
What is included in the product
Detailed Word Document
Tailored Porter’s Five Forces analysis for Vieworks that uncovers key drivers of competition, buyer and supplier power, threat of entrants and substitutes, and highlights disruptive risks and protective dynamics to inform strategic positioning and investor materials.
Customizable Excel Spreadsheet
Vieworks Porter's Five Forces gives a one-sheet summary with an interactive radar chart—instantly revealing strategic pressures and customizable pressure levels for quick decision-making and slide-ready outputs.
Customers Bargaining Power
Large OEM and hospital system buyers
Major medical OEMs and hospital procurement networks pool volumes and negotiate aggressively, commonly securing discounts of 10–30% and multi-year tenders of 3–5 years that compress margins and extend payment terms to 60–180 days. In industrial NDT, global integrators exercise similar leverage, bundling purchases across regions to demand lower unit prices. Vieworks often must trade price for design wins and capture lifecycle revenue via service, consumables and upgrade contracts.
High spec transparency and benchmarking
In 2024 buyers routinely compare DQE, MTF, noise, frame rate and dose across vendors, using independent benchmarks that make price-performance tradeoffs highly transparent. Clear benchmarks intensify bargaining as purchasers demand measurable gains. Superior image processing and software can reduce pure price pressure by improving clinical throughput. Published clinical and industrial outcome data strengthen negotiating leverage.
Moderate switching costs for integrators
System integration, calibration and certification create measurable switching frictions for integrators but are not prohibitive; OEMs often qualify second sources to gain pricing leverage. Embedded SDKs and proprietary interfaces raise stickiness, while open standards (GenICam, GigE Vision) limit lock‑in. Aftermarket service contracts and 99.9% uptime SLAs materially boost retention.
Budget constraints and TCO focus
Hospitals face heightened capital budget scrutiny and industrial buyers prioritize ROI and throughput, driving negotiations toward total cost of ownership—warranty, uptime, and service bundles matter more than unit price. Customers demand proven durability and rapid support, shifting purchase decisions to lifecycle economics where maintenance and reliability blunt replacement costs. This makes service-level commitments and mean time to repair decisive factors.
- Warranty length and uptime guarantees
- Service response time and spare-parts availability
- Lifecycle cost per throughput unit
- Proven MTBF and field durability
Demand cyclicality and project-based orders
Imaging capex follows macro cycles, reimbursement shifts and factory investment waves, driving project-based orders that buyers often delay or batch, pressuring Vieworks for discounts during downturns; volume swings—often reaching +/-20% in cyclical troughs—amplify buyer power and margin pressure in 2024. Framework agreements and diversification across medical, industrial and security end-markets help smooth demand and reduce single-cycle exposure.
- cyclical volatility: +/-20% volume swings
- buyer behavior: order batching and discounting in downturns
- mitigation: framework agreements
- diversification: medical, industrial, security markets
Buyers gain leverage: 10–30% discounts, lifecycle SLAs
Large hospital networks and OEMs secure 10–30% discounts and 3–5 year tenders, extending payment terms to 60–180 days, compressing margins. Independent benchmarks (DQE, MTF, dose) make price-performance transparent, increasing buyer leverage. Service, warranties and uptime (99.9% SLA) shift negotiations to lifecycle costs, mitigating pure price pressure.
| Metric | 2024 Value |
|---|---|
| Discounts | 10–30% |
| Payment terms | 60–180 days |
Preview Before You Purchase
Vieworks Porter's Five Forces Analysis
This preview shows the exact Vieworks Porter's Five Forces analysis you'll receive immediately after purchase—no placeholders or samples. The document is fully formatted and ready for download and use the moment you buy. You’re viewing the final deliverable, identical to the file provided after payment.
Description
A Must-Have Tool for Decision-Makers
Vieworks’s Porter's Five Forces snapshot highlights competitive intensity, supplier and buyer leverage, and potential substitute threats shaping its market outlook. The brief identifies key strategic pressures and where Vieworks may have structural advantages or vulnerabilities. This preview only scratches the surface—unlock the full Porter's Five Forces Analysis for force-by-force ratings, visuals, and actionable recommendations to inform investment or strategic decisions.
Suppliers Bargaining Power
Concentrated sensor and scintillator sources
High-performance CMOS sensors, CsI and Gadox scintillators and specialty optics are sourced from a small pool of qualified vendors, with the top three CMOS suppliers holding over 60% global share in 2024, giving suppliers leverage on pricing, allocation and contract terms during tight cycles. Dual-sourcing is possible but typically requires 12–24 months of qualification. Vieworks must trade off peak performance specs against supply security to mitigate supplier pressure.
Qualification-driven switching costs
Imaging components require rigorous validation for image quality, reliability, and regulatory compliance. Switching suppliers can delay programs and risk certification setbacks; FDA 510(k) clearance typically takes 3–12 months. These switching frictions raise supplier power for medical‑grade parts. Long‑term agreements and modular design can partially offset this.
Semiconductor and FPGA/camera IC cycles
Lead times for FPGAs, ADCs and interface ICs swing with global semiconductor cycles, often ranging from under 4 weeks in soft periods to 20–30+ weeks in up-cycles; in 2024 allocation-driven delays were widely reported across camera supply chains. In up-cycles allocation risk tilts bargaining power to suppliers and can inflate input costs (price uplifts in 2024 commonly cited in the mid-single to low-double digits). Buffer inventory and redesigns to broader footprints mitigate shortages but add carrying cost and engineering complexity, and supply assurances increasingly become negotiation levers exchanged for price concessions.
Special materials and process know-how
Specialized inputs—rare-earth coatings, precision glass, shielding and vacuum/packaging processes—are concentrated: China accounted for roughly 70% of rare-earth processing capacity in 2024, and few suppliers can meet DQE/MTF and low-noise targets at scale. Process IP and yield learning curves embed supplier advantages, narrowing substitution and sustaining vendor bargaining strength with elevated switching costs.
- Rare-earth processing ~70% China (2024)
- Process IP creates long tail on yield improvements
- Few vendors meet DQE/MTF & low-noise at volume
Geopolitical and logistics exposure
Cross-border sourcing of sensors, scintillators and electronics exposes Vieworks to tariffs, export controls and freight disruptions; suppliers commonly pass through costs or shift customers, increasing supplier leverage. US CHIPS Act ($52 billion) and other regional incentives have pushed regionalization, but reconfiguring supply chains typically takes 18–36 months and material capex.
- Tariff/export risk: higher pass-through
- Freight volatility: affects margins
- Regionalize: reduces risk but costly (18–36 months)
Supplier dominance: top CMOS, China rare-earths drive prices, long lead times persist
Suppliers hold strong leverage: top‑three CMOS >60% global share (2024) and rare‑earth processing ~70% China (2024), driving pricing and allocation power. Long qual cycles (12–24 months) and validation/FDA friction amplify switching costs; lead times spiked to 20–30+ weeks in 2024 with mid‑single to low‑double digit price uplifts. Long contracts, inventory and regionalization reduce but do not eliminate supplier power.
| Metric | 2024 |
|---|---|
| Top‑3 CMOS share | >60% |
| Rare‑earth processing | ~70% China |
| Lead times (up‑cycle) | 20–30+ weeks |
| Price uplifts | mid‑single to low‑double % |
What is included in the product
Detailed Word Document
Tailored Porter’s Five Forces analysis for Vieworks that uncovers key drivers of competition, buyer and supplier power, threat of entrants and substitutes, and highlights disruptive risks and protective dynamics to inform strategic positioning and investor materials.
Customizable Excel Spreadsheet
Vieworks Porter's Five Forces gives a one-sheet summary with an interactive radar chart—instantly revealing strategic pressures and customizable pressure levels for quick decision-making and slide-ready outputs.
Customers Bargaining Power
Large OEM and hospital system buyers
Major medical OEMs and hospital procurement networks pool volumes and negotiate aggressively, commonly securing discounts of 10–30% and multi-year tenders of 3–5 years that compress margins and extend payment terms to 60–180 days. In industrial NDT, global integrators exercise similar leverage, bundling purchases across regions to demand lower unit prices. Vieworks often must trade price for design wins and capture lifecycle revenue via service, consumables and upgrade contracts.
High spec transparency and benchmarking
In 2024 buyers routinely compare DQE, MTF, noise, frame rate and dose across vendors, using independent benchmarks that make price-performance tradeoffs highly transparent. Clear benchmarks intensify bargaining as purchasers demand measurable gains. Superior image processing and software can reduce pure price pressure by improving clinical throughput. Published clinical and industrial outcome data strengthen negotiating leverage.
Moderate switching costs for integrators
System integration, calibration and certification create measurable switching frictions for integrators but are not prohibitive; OEMs often qualify second sources to gain pricing leverage. Embedded SDKs and proprietary interfaces raise stickiness, while open standards (GenICam, GigE Vision) limit lock‑in. Aftermarket service contracts and 99.9% uptime SLAs materially boost retention.
Budget constraints and TCO focus
Hospitals face heightened capital budget scrutiny and industrial buyers prioritize ROI and throughput, driving negotiations toward total cost of ownership—warranty, uptime, and service bundles matter more than unit price. Customers demand proven durability and rapid support, shifting purchase decisions to lifecycle economics where maintenance and reliability blunt replacement costs. This makes service-level commitments and mean time to repair decisive factors.
- Warranty length and uptime guarantees
- Service response time and spare-parts availability
- Lifecycle cost per throughput unit
- Proven MTBF and field durability
Demand cyclicality and project-based orders
Imaging capex follows macro cycles, reimbursement shifts and factory investment waves, driving project-based orders that buyers often delay or batch, pressuring Vieworks for discounts during downturns; volume swings—often reaching +/-20% in cyclical troughs—amplify buyer power and margin pressure in 2024. Framework agreements and diversification across medical, industrial and security end-markets help smooth demand and reduce single-cycle exposure.
- cyclical volatility: +/-20% volume swings
- buyer behavior: order batching and discounting in downturns
- mitigation: framework agreements
- diversification: medical, industrial, security markets
Buyers gain leverage: 10–30% discounts, lifecycle SLAs
Large hospital networks and OEMs secure 10–30% discounts and 3–5 year tenders, extending payment terms to 60–180 days, compressing margins. Independent benchmarks (DQE, MTF, dose) make price-performance transparent, increasing buyer leverage. Service, warranties and uptime (99.9% SLA) shift negotiations to lifecycle costs, mitigating pure price pressure.
| Metric | 2024 Value |
|---|---|
| Discounts | 10–30% |
| Payment terms | 60–180 days |
Preview Before You Purchase
Vieworks Porter's Five Forces Analysis
This preview shows the exact Vieworks Porter's Five Forces analysis you'll receive immediately after purchase—no placeholders or samples. The document is fully formatted and ready for download and use the moment you buy. You’re viewing the final deliverable, identical to the file provided after payment.











