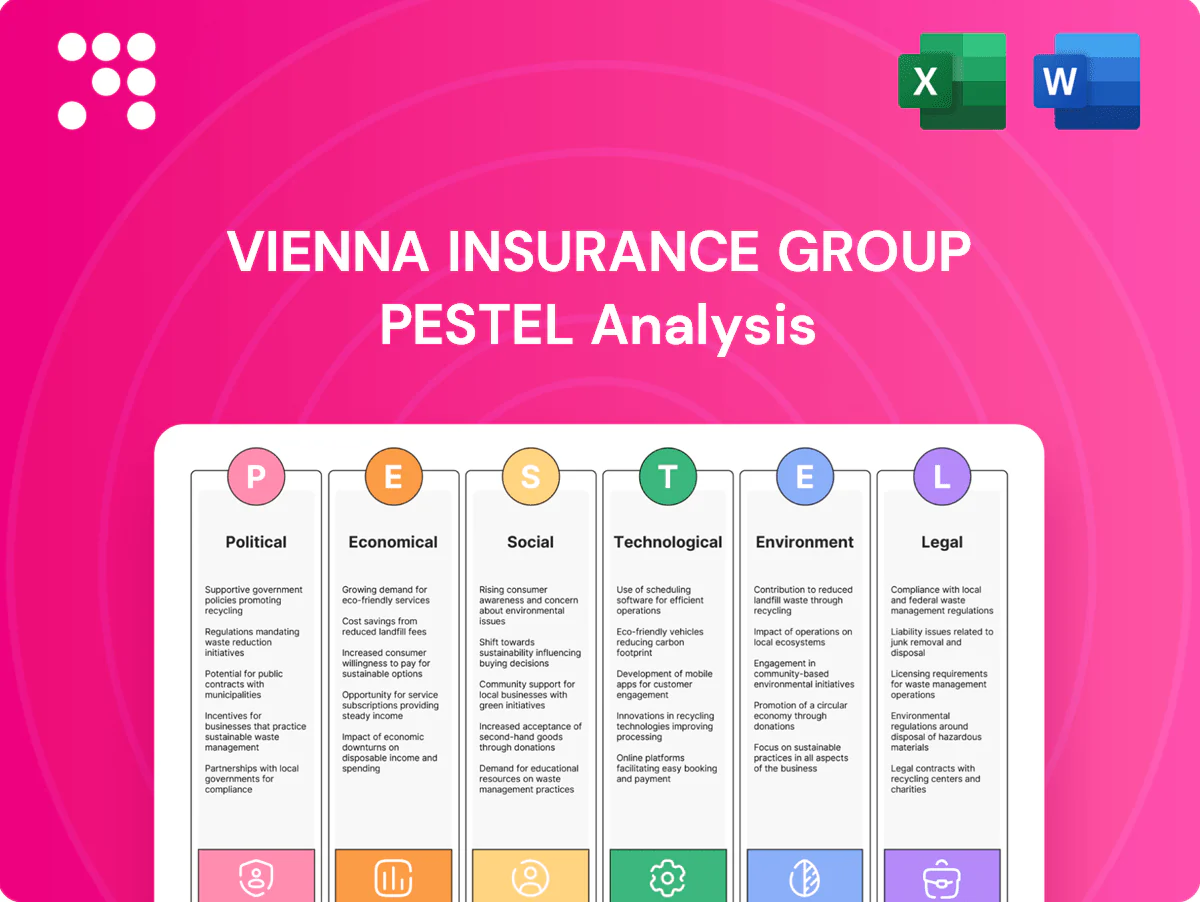
Vienna Insurance Group PESTLE Analysis

Make Smarter Strategic Decisions with a Complete PESTEL View
Gain strategic clarity with our PESTLE Analysis of Vienna Insurance Group — three-sentence executive insights into political, economic, social, technological, legal, and environmental forces shaping its future. Ideal for investors and strategists seeking actionable context, the full report delivers deep-dive data, scenarios, and recommendations. Purchase now to download the complete, ready-to-use analysis and make smarter decisions fast.
Political factors

EU and national regulatory alignment
VIG, operating across the EU and CEE, must align with EU directives (eg Solvency II, IDD) across 27 EU member states and varied national implementations. Policy shifts in Brussels or local parliaments can rapidly change capital, conduct or distribution rules, affecting product design and compliance costs. Proactive regulatory monitoring, advocacy and tight coordination across subsidiaries are critical to anticipate costs and maintain group-wide consistency.
Geopolitical tensions in CEE
Geopolitical tensions in CEE, notably the Ukraine war and sanctions, have elevated macro and claims volatility, pushed reinsurance pricing up roughly 20–30% in 2022–23, and increased counterparty risk for insurers like Vienna Insurance Group, which operates in 25 markets. Market access, asset liquidity and premium growth can be disrupted in affected countries, impacting VIG’s ~EUR 10.9bn gross written premiums (2023). Scenario planning and country-level risk limits are used to reduce exposure concentration. Diversification across CEE markets cushions shocks.

State welfare and health policy
Changes to public healthcare and pensions reshape demand for private life and health products. Austria spends about 11.2% of GDP on health and roughly 14% on pensions, so coverage gaps or reforms materially affect market size. Subsidies or tax incentives can catalyze uptake while austerity suppresses it, forcing VIG to adapt product design and pricing to shifting gaps. Public-private partnerships may open new distribution and claims-management channels.

Government catastrophe frameworks
Public disaster schemes, pool arrangements and state guarantees materially shape natcat coverage penetration and pricing; alignment with national resilience plans expands addressable market while stabilizing loss ratios. VIG benefits from participating in pooled solutions and maintains transparent dialogue with authorities to support sustainable underwriting; VIG GWP ~EUR 11.8bn (2024).
- Public schemes drive affordability and penetration
- Pools lower volatility and pricing pressure
- Alignment with resilience policy enlarges market
- Transparent regulator dialogue supports underwriting
Political stability and corruption risk
Varying governance quality across VIGs 25 CEE markets in 2024 affects licensing, claims adjudication and public procurement, while political turnover has delayed reforms or introduced abrupt regulatory shifts; robust compliance controls and proactive local stakeholder engagement reduce operational friction, and country-risk mapping now guides capital allocation alongside a 2024 gross written premium of about €10.7bn.
- 25-market footprint (2024)
- €10.7bn GWP (2024)
- Compliance + local engagement mitigate corruption risk
- Country risk mapping informs capital allocation
Compliance across 25 CEE markets raises costs; reinsurance up 20–30%, 2024 GWP €10.7bn
VIG must comply with EU directives (Solvency II, IDD) across 25 CEE markets, requiring group-wide coordination and raising compliance costs. Geopolitical risks (Ukraine war) raised reinsurance pricing ~20–30% in 2022–23 and elevated claims volatility. Public healthcare/pension reforms and natcat pools materially affect demand and pricing; 2024 GWP ~€10.7bn.
| Metric | Value |
|---|---|
| Markets (2024) | 25 |
| GWP (2024) | €10.7bn |
| Reinsurance price change | +20–30% (2022–23) |
| Key regs | Solvency II, IDD |
What is included in the product
 Detailed Word Document
Explores how Political, Economic, Social, Technological, Environmental and Legal forces uniquely affect Vienna Insurance Group, with data‑backed trends and specific subpoints to identify risks and opportunities. Designed for executives and investors to inform strategy, scenario planning and funding decisions.

 Customizable Excel Spreadsheet
Provides a concise, visually segmented PESTLE snapshot of Vienna Insurance Group that’s easy to drop into presentations or planning sessions, supports quick assessment of external risks and market positioning, and is ideal for team alignment or client-ready reports.
Economic factors

Interest rate and inflation dynamics
Higher rates (ECB policy rate around 4% mid‑2025) boost VIG’s investment income but increase strain on life guarantees and asset‑liability matching. Persistent inflation (Euro area ~3% in 2024) raises claims costs and operating expenses, forcing timely repricing. VIG needs dynamic ALM, inflation‑sensitive underwriting, hedging and indexation clauses to preserve margins.
GDP growth and insurance penetration
CEE insurance penetration remains low — Swiss Re Institute 2023 cites Emerging Europe at about 3.1% versus EU average ~7.1% — supporting long‑term premium upside as GDP convergence continues; IMF WEO Apr 2024 projects ~2.6% regional GDP growth in 2024. Economic slowdowns trim discretionary life and motor demand and raise lapse rates; VIG can offset cyclicality by weighting health and mandatory P&C. Market prioritization should trade faster growth markets against higher volatility and capital strain.

Currency volatility
Non-euro subsidiaries across Central and Eastern Europe expose Vienna Insurance Group to FX translation and transaction risk as local-currency premiums and reserves are converted into euros for reporting.
Currency swings can compress capital ratios, reduce dividend capacity and erode euro-denominated profitability unless managed actively.
Natural hedging through local asset-liability matching and targeted financial hedges (for example FX forwards/options) helps stabilize reported results.
Underwriting, pricing and reinsurance strategy should incorporate FX stress scenarios to preserve solvency and earnings stability.

Labor market and wage trends
Rising wages (around 4% in Austria in 2024) improve premium affordability but push VIGs expense ratios higher; talent scarcity in actuarial, data and IT roles is increasing hiring costs and time-to-fill. VIG should accelerate productivity, automation and shared service centres while shifting distribution pay to performance-linked incentives to align costs with profitable growth.
- Wage growth ~4% (2024)
- Skill gaps: actuarial/data/IT
- Invest: automation + SSCs
- Use performance-based distribution pay
Credit cycle and counterparties
Corporate defaults and household credit stress, with Austrian household debt around 61% of GDP (OECD 2023), can raise credit-protection claims, lapses and recovery losses; reinsurer credit quality and collateralization become pivotal in stress. Prudent counterparty limits, portfolio diversification and conservative reserving boost VIG resilience.
- Counterparty limits
- Collateralization
- Diversification
- Conservative reserving
Compliance across 25 CEE markets raises costs; reinsurance up 20–30%, 2024 GWP €10.7bn
ECB rate ~4% (mid‑2025) raises investment income but strains life ALM; Euro area inflation ~3% (2024) lifts claims and costs. Emerging Europe insurance penetration ~3.1% vs EU 7.1% (Swiss Re 2023) supports premium growth; IMF 2024 GDP ~2.6%. Austrian wage growth ~4% (2024) and household debt ~61% GDP (OECD 2023) pressure expenses and credit risk; FX and hedging are critical.
| Metric | Value | Source |
|---|---|---|
| ECB rate | ~4% (mid‑2025) | ECB |
| Euro inflation | ~3% (2024) | Eurostat |
| Ins. penetration EE | 3.1% vs 7.1% EU | Swiss Re 2023 |
| GDP growth EE | ~2.6% (2024) | IMF WEO Apr 2024 |
| Austrian wages | ~4% (2024) | Statistik Austria |
| Household debt AT | ~61% GDP (2023) | OECD 2023 |
Same Document Delivered
Vienna Insurance Group PESTLE Analysis
The Vienna Insurance Group PESTLE Analysis shown here is the exact document you’ll receive after purchase—fully formatted and ready to use. This preview is a real snapshot of the final file, with complete content and structure as delivered. No placeholders or teasers: what you see is what you’ll download instantly after payment.

Make Smarter Strategic Decisions with a Complete PESTEL View
Gain strategic clarity with our PESTLE Analysis of Vienna Insurance Group — three-sentence executive insights into political, economic, social, technological, legal, and environmental forces shaping its future. Ideal for investors and strategists seeking actionable context, the full report delivers deep-dive data, scenarios, and recommendations. Purchase now to download the complete, ready-to-use analysis and make smarter decisions fast.
Political factors
EU and national regulatory alignment
VIG, operating across the EU and CEE, must align with EU directives (eg Solvency II, IDD) across 27 EU member states and varied national implementations. Policy shifts in Brussels or local parliaments can rapidly change capital, conduct or distribution rules, affecting product design and compliance costs. Proactive regulatory monitoring, advocacy and tight coordination across subsidiaries are critical to anticipate costs and maintain group-wide consistency.
Geopolitical tensions in CEE
Geopolitical tensions in CEE, notably the Ukraine war and sanctions, have elevated macro and claims volatility, pushed reinsurance pricing up roughly 20–30% in 2022–23, and increased counterparty risk for insurers like Vienna Insurance Group, which operates in 25 markets. Market access, asset liquidity and premium growth can be disrupted in affected countries, impacting VIG’s ~EUR 10.9bn gross written premiums (2023). Scenario planning and country-level risk limits are used to reduce exposure concentration. Diversification across CEE markets cushions shocks.
State welfare and health policy
Changes to public healthcare and pensions reshape demand for private life and health products. Austria spends about 11.2% of GDP on health and roughly 14% on pensions, so coverage gaps or reforms materially affect market size. Subsidies or tax incentives can catalyze uptake while austerity suppresses it, forcing VIG to adapt product design and pricing to shifting gaps. Public-private partnerships may open new distribution and claims-management channels.
Government catastrophe frameworks
Public disaster schemes, pool arrangements and state guarantees materially shape natcat coverage penetration and pricing; alignment with national resilience plans expands addressable market while stabilizing loss ratios. VIG benefits from participating in pooled solutions and maintains transparent dialogue with authorities to support sustainable underwriting; VIG GWP ~EUR 11.8bn (2024).
- Public schemes drive affordability and penetration
- Pools lower volatility and pricing pressure
- Alignment with resilience policy enlarges market
- Transparent regulator dialogue supports underwriting
Political stability and corruption risk
Varying governance quality across VIGs 25 CEE markets in 2024 affects licensing, claims adjudication and public procurement, while political turnover has delayed reforms or introduced abrupt regulatory shifts; robust compliance controls and proactive local stakeholder engagement reduce operational friction, and country-risk mapping now guides capital allocation alongside a 2024 gross written premium of about €10.7bn.
- 25-market footprint (2024)
- €10.7bn GWP (2024)
- Compliance + local engagement mitigate corruption risk
- Country risk mapping informs capital allocation
Compliance across 25 CEE markets raises costs; reinsurance up 20–30%, 2024 GWP €10.7bn
VIG must comply with EU directives (Solvency II, IDD) across 25 CEE markets, requiring group-wide coordination and raising compliance costs. Geopolitical risks (Ukraine war) raised reinsurance pricing ~20–30% in 2022–23 and elevated claims volatility. Public healthcare/pension reforms and natcat pools materially affect demand and pricing; 2024 GWP ~€10.7bn.
| Metric | Value |
|---|---|
| Markets (2024) | 25 |
| GWP (2024) | €10.7bn |
| Reinsurance price change | +20–30% (2022–23) |
| Key regs | Solvency II, IDD |
What is included in the product
Detailed Word Document
Explores how Political, Economic, Social, Technological, Environmental and Legal forces uniquely affect Vienna Insurance Group, with data‑backed trends and specific subpoints to identify risks and opportunities. Designed for executives and investors to inform strategy, scenario planning and funding decisions.
Customizable Excel Spreadsheet
Provides a concise, visually segmented PESTLE snapshot of Vienna Insurance Group that’s easy to drop into presentations or planning sessions, supports quick assessment of external risks and market positioning, and is ideal for team alignment or client-ready reports.
Economic factors
Interest rate and inflation dynamics
Higher rates (ECB policy rate around 4% mid‑2025) boost VIG’s investment income but increase strain on life guarantees and asset‑liability matching. Persistent inflation (Euro area ~3% in 2024) raises claims costs and operating expenses, forcing timely repricing. VIG needs dynamic ALM, inflation‑sensitive underwriting, hedging and indexation clauses to preserve margins.
GDP growth and insurance penetration
CEE insurance penetration remains low — Swiss Re Institute 2023 cites Emerging Europe at about 3.1% versus EU average ~7.1% — supporting long‑term premium upside as GDP convergence continues; IMF WEO Apr 2024 projects ~2.6% regional GDP growth in 2024. Economic slowdowns trim discretionary life and motor demand and raise lapse rates; VIG can offset cyclicality by weighting health and mandatory P&C. Market prioritization should trade faster growth markets against higher volatility and capital strain.
Currency volatility
Non-euro subsidiaries across Central and Eastern Europe expose Vienna Insurance Group to FX translation and transaction risk as local-currency premiums and reserves are converted into euros for reporting.
Currency swings can compress capital ratios, reduce dividend capacity and erode euro-denominated profitability unless managed actively.
Natural hedging through local asset-liability matching and targeted financial hedges (for example FX forwards/options) helps stabilize reported results.
Underwriting, pricing and reinsurance strategy should incorporate FX stress scenarios to preserve solvency and earnings stability.
Labor market and wage trends
Rising wages (around 4% in Austria in 2024) improve premium affordability but push VIGs expense ratios higher; talent scarcity in actuarial, data and IT roles is increasing hiring costs and time-to-fill. VIG should accelerate productivity, automation and shared service centres while shifting distribution pay to performance-linked incentives to align costs with profitable growth.
- Wage growth ~4% (2024)
- Skill gaps: actuarial/data/IT
- Invest: automation + SSCs
- Use performance-based distribution pay
Credit cycle and counterparties
Corporate defaults and household credit stress, with Austrian household debt around 61% of GDP (OECD 2023), can raise credit-protection claims, lapses and recovery losses; reinsurer credit quality and collateralization become pivotal in stress. Prudent counterparty limits, portfolio diversification and conservative reserving boost VIG resilience.
- Counterparty limits
- Collateralization
- Diversification
- Conservative reserving
Compliance across 25 CEE markets raises costs; reinsurance up 20–30%, 2024 GWP €10.7bn
ECB rate ~4% (mid‑2025) raises investment income but strains life ALM; Euro area inflation ~3% (2024) lifts claims and costs. Emerging Europe insurance penetration ~3.1% vs EU 7.1% (Swiss Re 2023) supports premium growth; IMF 2024 GDP ~2.6%. Austrian wage growth ~4% (2024) and household debt ~61% GDP (OECD 2023) pressure expenses and credit risk; FX and hedging are critical.
| Metric | Value | Source |
|---|---|---|
| ECB rate | ~4% (mid‑2025) | ECB |
| Euro inflation | ~3% (2024) | Eurostat |
| Ins. penetration EE | 3.1% vs 7.1% EU | Swiss Re 2023 |
| GDP growth EE | ~2.6% (2024) | IMF WEO Apr 2024 |
| Austrian wages | ~4% (2024) | Statistik Austria |
| Household debt AT | ~61% GDP (2023) | OECD 2023 |
Same Document Delivered
Vienna Insurance Group PESTLE Analysis
The Vienna Insurance Group PESTLE Analysis shown here is the exact document you’ll receive after purchase—fully formatted and ready to use. This preview is a real snapshot of the final file, with complete content and structure as delivered. No placeholders or teasers: what you see is what you’ll download instantly after payment.
Description
Make Smarter Strategic Decisions with a Complete PESTEL View
Gain strategic clarity with our PESTLE Analysis of Vienna Insurance Group — three-sentence executive insights into political, economic, social, technological, legal, and environmental forces shaping its future. Ideal for investors and strategists seeking actionable context, the full report delivers deep-dive data, scenarios, and recommendations. Purchase now to download the complete, ready-to-use analysis and make smarter decisions fast.
Political factors
EU and national regulatory alignment
VIG, operating across the EU and CEE, must align with EU directives (eg Solvency II, IDD) across 27 EU member states and varied national implementations. Policy shifts in Brussels or local parliaments can rapidly change capital, conduct or distribution rules, affecting product design and compliance costs. Proactive regulatory monitoring, advocacy and tight coordination across subsidiaries are critical to anticipate costs and maintain group-wide consistency.
Geopolitical tensions in CEE
Geopolitical tensions in CEE, notably the Ukraine war and sanctions, have elevated macro and claims volatility, pushed reinsurance pricing up roughly 20–30% in 2022–23, and increased counterparty risk for insurers like Vienna Insurance Group, which operates in 25 markets. Market access, asset liquidity and premium growth can be disrupted in affected countries, impacting VIG’s ~EUR 10.9bn gross written premiums (2023). Scenario planning and country-level risk limits are used to reduce exposure concentration. Diversification across CEE markets cushions shocks.
State welfare and health policy
Changes to public healthcare and pensions reshape demand for private life and health products. Austria spends about 11.2% of GDP on health and roughly 14% on pensions, so coverage gaps or reforms materially affect market size. Subsidies or tax incentives can catalyze uptake while austerity suppresses it, forcing VIG to adapt product design and pricing to shifting gaps. Public-private partnerships may open new distribution and claims-management channels.
Government catastrophe frameworks
Public disaster schemes, pool arrangements and state guarantees materially shape natcat coverage penetration and pricing; alignment with national resilience plans expands addressable market while stabilizing loss ratios. VIG benefits from participating in pooled solutions and maintains transparent dialogue with authorities to support sustainable underwriting; VIG GWP ~EUR 11.8bn (2024).
- Public schemes drive affordability and penetration
- Pools lower volatility and pricing pressure
- Alignment with resilience policy enlarges market
- Transparent regulator dialogue supports underwriting
Political stability and corruption risk
Varying governance quality across VIGs 25 CEE markets in 2024 affects licensing, claims adjudication and public procurement, while political turnover has delayed reforms or introduced abrupt regulatory shifts; robust compliance controls and proactive local stakeholder engagement reduce operational friction, and country-risk mapping now guides capital allocation alongside a 2024 gross written premium of about €10.7bn.
- 25-market footprint (2024)
- €10.7bn GWP (2024)
- Compliance + local engagement mitigate corruption risk
- Country risk mapping informs capital allocation
Compliance across 25 CEE markets raises costs; reinsurance up 20–30%, 2024 GWP €10.7bn
VIG must comply with EU directives (Solvency II, IDD) across 25 CEE markets, requiring group-wide coordination and raising compliance costs. Geopolitical risks (Ukraine war) raised reinsurance pricing ~20–30% in 2022–23 and elevated claims volatility. Public healthcare/pension reforms and natcat pools materially affect demand and pricing; 2024 GWP ~€10.7bn.
| Metric | Value |
|---|---|
| Markets (2024) | 25 |
| GWP (2024) | €10.7bn |
| Reinsurance price change | +20–30% (2022–23) |
| Key regs | Solvency II, IDD |
What is included in the product
Detailed Word Document
Explores how Political, Economic, Social, Technological, Environmental and Legal forces uniquely affect Vienna Insurance Group, with data‑backed trends and specific subpoints to identify risks and opportunities. Designed for executives and investors to inform strategy, scenario planning and funding decisions.
Customizable Excel Spreadsheet
Provides a concise, visually segmented PESTLE snapshot of Vienna Insurance Group that’s easy to drop into presentations or planning sessions, supports quick assessment of external risks and market positioning, and is ideal for team alignment or client-ready reports.
Economic factors
Interest rate and inflation dynamics
Higher rates (ECB policy rate around 4% mid‑2025) boost VIG’s investment income but increase strain on life guarantees and asset‑liability matching. Persistent inflation (Euro area ~3% in 2024) raises claims costs and operating expenses, forcing timely repricing. VIG needs dynamic ALM, inflation‑sensitive underwriting, hedging and indexation clauses to preserve margins.
GDP growth and insurance penetration
CEE insurance penetration remains low — Swiss Re Institute 2023 cites Emerging Europe at about 3.1% versus EU average ~7.1% — supporting long‑term premium upside as GDP convergence continues; IMF WEO Apr 2024 projects ~2.6% regional GDP growth in 2024. Economic slowdowns trim discretionary life and motor demand and raise lapse rates; VIG can offset cyclicality by weighting health and mandatory P&C. Market prioritization should trade faster growth markets against higher volatility and capital strain.
Currency volatility
Non-euro subsidiaries across Central and Eastern Europe expose Vienna Insurance Group to FX translation and transaction risk as local-currency premiums and reserves are converted into euros for reporting.
Currency swings can compress capital ratios, reduce dividend capacity and erode euro-denominated profitability unless managed actively.
Natural hedging through local asset-liability matching and targeted financial hedges (for example FX forwards/options) helps stabilize reported results.
Underwriting, pricing and reinsurance strategy should incorporate FX stress scenarios to preserve solvency and earnings stability.
Labor market and wage trends
Rising wages (around 4% in Austria in 2024) improve premium affordability but push VIGs expense ratios higher; talent scarcity in actuarial, data and IT roles is increasing hiring costs and time-to-fill. VIG should accelerate productivity, automation and shared service centres while shifting distribution pay to performance-linked incentives to align costs with profitable growth.
- Wage growth ~4% (2024)
- Skill gaps: actuarial/data/IT
- Invest: automation + SSCs
- Use performance-based distribution pay
Credit cycle and counterparties
Corporate defaults and household credit stress, with Austrian household debt around 61% of GDP (OECD 2023), can raise credit-protection claims, lapses and recovery losses; reinsurer credit quality and collateralization become pivotal in stress. Prudent counterparty limits, portfolio diversification and conservative reserving boost VIG resilience.
- Counterparty limits
- Collateralization
- Diversification
- Conservative reserving
Compliance across 25 CEE markets raises costs; reinsurance up 20–30%, 2024 GWP €10.7bn
ECB rate ~4% (mid‑2025) raises investment income but strains life ALM; Euro area inflation ~3% (2024) lifts claims and costs. Emerging Europe insurance penetration ~3.1% vs EU 7.1% (Swiss Re 2023) supports premium growth; IMF 2024 GDP ~2.6%. Austrian wage growth ~4% (2024) and household debt ~61% GDP (OECD 2023) pressure expenses and credit risk; FX and hedging are critical.
| Metric | Value | Source |
|---|---|---|
| ECB rate | ~4% (mid‑2025) | ECB |
| Euro inflation | ~3% (2024) | Eurostat |
| Ins. penetration EE | 3.1% vs 7.1% EU | Swiss Re 2023 |
| GDP growth EE | ~2.6% (2024) | IMF WEO Apr 2024 |
| Austrian wages | ~4% (2024) | Statistik Austria |
| Household debt AT | ~61% GDP (2023) | OECD 2023 |
Same Document Delivered
Vienna Insurance Group PESTLE Analysis
The Vienna Insurance Group PESTLE Analysis shown here is the exact document you’ll receive after purchase—fully formatted and ready to use. This preview is a real snapshot of the final file, with complete content and structure as delivered. No placeholders or teasers: what you see is what you’ll download instantly after payment.











