Viking Cruises Boston Consulting Group Matrix

See the Bigger Picture
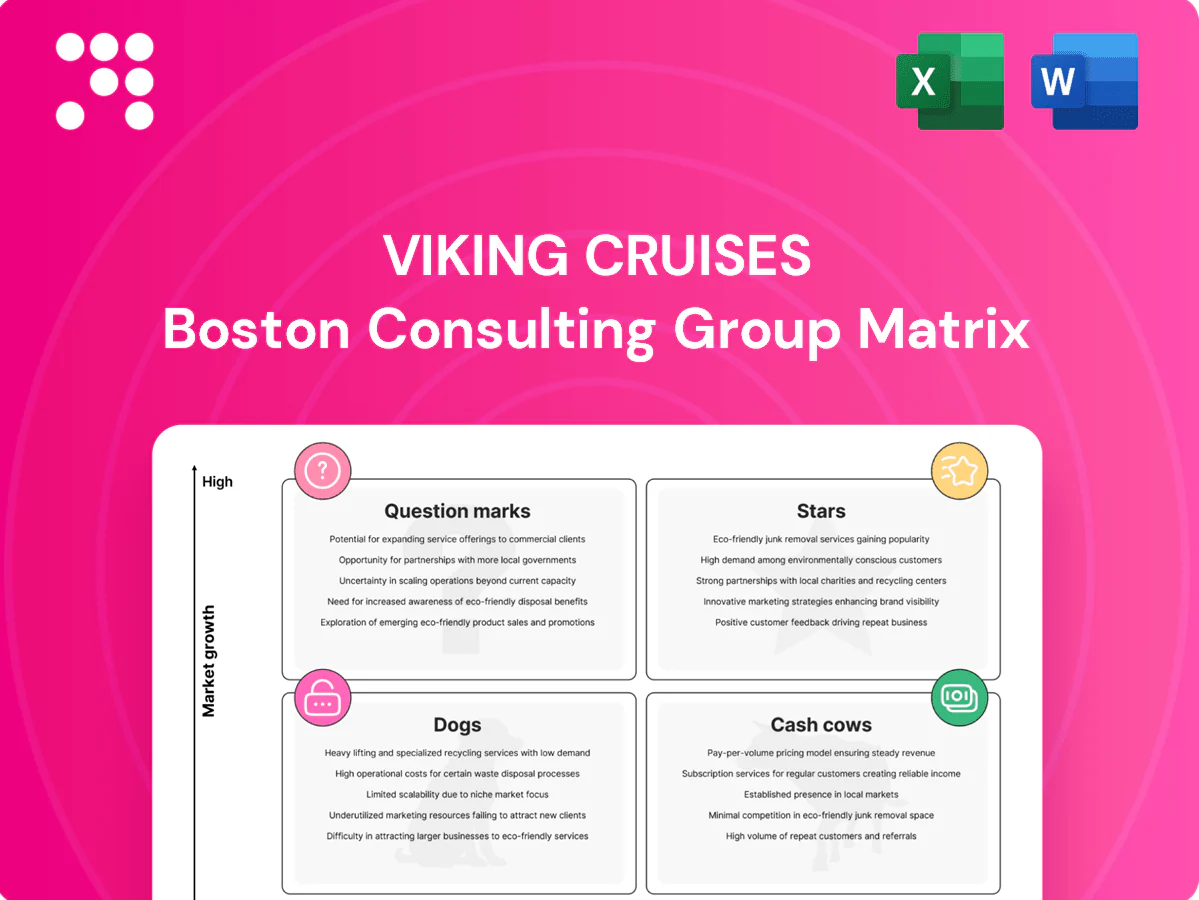
Curious how Viking Cruises’ offerings map across Stars, Cash Cows, Dogs and Question Marks? This brief peek hints at where their growth pockets and cash generators live—but the full BCG Matrix lays out quadrant-by-quadrant placements, data-backed recommendations, and a clear capital-allocation roadmap. Purchase the complete report for a ready-to-present Word analysis plus a high-level Excel summary and start making sharper, faster strategic choices.
Stars

Viking Ocean Cruises (premium, adult-only)
Viking Ocean Cruises commands a high market share in the adult-only, small-ship premium niche, a category still expanding as of 2024. Strong brand pull and high repeat business keep ships sailing full—Viking ocean vessels carry about 930 passengers each. Defending leadership requires ongoing investment in newbuilds, destination access, and top-tier service. Keep the foot on the gas—this is where to invest.
Longer Voyages & World Cruises
Demand is rising as affluent travelers trade up for time-rich itineraries, reflected in Viking's flagship 245-day world cruise offering. Viking owns the cultural immersion at sea story and is rapidly growing share in long-voyage segments. Marketing spend and fleet capacity commitments are substantial but payback is evident from multiyear world-cruise sales. Maintain momentum and lock in port rights early to secure itineraries.

Destination-Focused Positioning
Viking’s “no casinos, no kids, all culture” positioning clearly leads this growing niche and acts as both a moat and a magnet for affluent cultural travelers. As of 2024 Viking is the world’s largest river cruise operator, reinforcing brand credibility and scale. The edge compounds if the firm continuously invests in fresh itineraries, expert guides, and local partnerships. Invest: steady content and partnerships sustain premium pricing and repeat demand.

Direct-to-Consumer Brand Engine
Viking's Direct-to-Consumer brand engine raises brand awareness and shifts bookings to owned channels, cutting third-party distribution fees and increasing margin; direct channels often deliver cost savings versus intermediaries and strengthen guest lifetime value. In a growing cruise market, higher DTC share converts to measurable market share gains. It requires heavy media and content investment, burning cash early but producing tangible ROI as CAC falls and repeat rates rise; keep scaling the flywheel.
- Direct bookings: lower distribution cost, higher control
- Growing market: DTC share converts to market share
- Investment: high media/content spend; returns via CAC decline
- Strategy: scale the flywheel—acquire, engage, retain
Newbuild Small-Ship Program
Fleet growth aligns tightly with itinerary demand: Viking ocean ships carry 930 passengers and expedition ships 378 passengers, and capacity sells fast so scale drives per-passenger cost advantages. Capex is heavy but newbuilds are the growth throttle; prioritize delivery slots, yard efficiency and retrofit cost reductions to accelerate revenue ramp.
- Tags: capacity, 930, 378
- Tags: capex, delivery slots
- Tags: scale, cost advantage, efficiency
Premium small-ship leader — tight capacity, strong repeat demand and long‑voyage growth
Viking Ocean is a Star: high share in the expanding adult-only premium small-ship niche, driven by strong DTC, repeat demand and cultural positioning. Capacity tightness (930 ocean, 378 expedition) and long-voyage growth (flagship 245-day world cruise) justify continued heavy investment to defend leadership.
| Metric | 2024 |
|---|---|
| Ocean capacity | 930 |
| Expedition capacity | 378 |
| Flagship world cruise | 245 days |
| River ranking | World’s largest |
What is included in the product
 Detailed Word Document
BCG Matrix review of Viking Cruises: categorizes lines into Stars, Cash Cows, Question Marks, Dogs with clear investment guidance.

 Customizable Excel Spreadsheet
One-page BCG matrix for Viking Cruises, placing each cruise line in a quadrant to spot inefficiencies fast.
Cash Cows

European River Cruises (Rhine, Danube core)
European river cruises (Rhine, Danube core) are a mature 2024 market where Viking remains the name to beat; Viking’s river fleet (~60 ships) drives scale, with industry occupancy typically 90–95% and repeat-booking rates around 50%, supporting strong margins and high yield. Marketing spend is lower than ocean; operational excellence (crew, itinerary execution) is the main profit lever, so milk steadily while maintaining service standards.
Included Excursions Model
Viking's Included Excursions Model is now an expected component across its ocean and river itineraries, delivering predictable take-up and streamlined operations that convert to high incremental margins. Limited incremental promotional spend is required given strong brand loyalty and packaging efficiency. Proceeds from this cash-cow bundle are redeployed to fund growth bets such as fleet expansion and new itineraries.

North American Repeat Guest Base
North American repeat guests are a loyal, affluent cohort with high lifetime value; 2024 industry data show repeat passengers account for about 60% of premium-segment bookings, driving steady revenues. Acquisition costs fall sharply after the first cruise as email and catalogs deliver most rebookings, producing high marketing ROI. Growth is modest but cash flow is rich; prioritize nurturing retention over heavy new-capex or aggressive acquisition spend.

Established Port & Shore Partnerships (Europe)
Locked-in European port and shore partnerships give Viking predictable berthing and contracting, reducing schedule disruptions and securing better pricing; CLIA reported ~30 million global cruise passengers in 2023, highlighting scale but slow near-term growth in Europe. These entrenched relationships protect market share with minimal incremental spend while schedule optimization can meaningfully lift yield.
- Locked-in slots: lower variability, better rates
- Market: large scale (CLIA 2023 ~30M) but slow growth
- Capex/Opex: minimal incremental spend required
- Action: optimize itineraries to increase yield
Onboard Enrichment & Lectures
Onboard Enrichment & Lectures at Viking Cruises is a differentiator now standardized fleetwide, efficiently delivered across over 70 vessels (2024) and driving high guest satisfaction with predictable staffing and content costs; the mature program yields steady onboard revenue and margin contribution with minimal incremental investment.
- Standardized delivery
- High guest satisfaction
- Predictable costs
- Mature, steady returns
- Light-touch refreshes
Mature river and premium ocean fleets: 90–95% occupancy, loyal guests fund growth
Viking’s mature river (≈60 ships) and premium ocean (~70 ships) segments are cash cows in 2024, with occupancy 90–95% and repeat rates 50–60%, delivering high margins and low marketing spend; revenues fund fleet expansion and selective itineraries while ops efficiencies sustain yields.
| Metric | 2024 |
|---|---|
| Fleet (river/ocean) | ~60 / ~70 |
| Occupancy | 90–95% |
| Repeat rate | 50–60% |
Delivered as Shown
Viking Cruises BCG Matrix
The file you’re previewing here is the exact BCG Matrix report you’ll receive after purchase — no watermarks, no placeholders, just the finished product. This is the working document: professionally formatted, analysis-ready, and built for immediate use. Buy once and download instantly to edit, print, or present. It’s the same file, delivered clean and ready to go.

See the Bigger Picture
Curious how Viking Cruises’ offerings map across Stars, Cash Cows, Dogs and Question Marks? This brief peek hints at where their growth pockets and cash generators live—but the full BCG Matrix lays out quadrant-by-quadrant placements, data-backed recommendations, and a clear capital-allocation roadmap. Purchase the complete report for a ready-to-present Word analysis plus a high-level Excel summary and start making sharper, faster strategic choices.
Stars
Viking Ocean Cruises (premium, adult-only)
Viking Ocean Cruises commands a high market share in the adult-only, small-ship premium niche, a category still expanding as of 2024. Strong brand pull and high repeat business keep ships sailing full—Viking ocean vessels carry about 930 passengers each. Defending leadership requires ongoing investment in newbuilds, destination access, and top-tier service. Keep the foot on the gas—this is where to invest.
Longer Voyages & World Cruises
Demand is rising as affluent travelers trade up for time-rich itineraries, reflected in Viking's flagship 245-day world cruise offering. Viking owns the cultural immersion at sea story and is rapidly growing share in long-voyage segments. Marketing spend and fleet capacity commitments are substantial but payback is evident from multiyear world-cruise sales. Maintain momentum and lock in port rights early to secure itineraries.
Destination-Focused Positioning
Viking’s “no casinos, no kids, all culture” positioning clearly leads this growing niche and acts as both a moat and a magnet for affluent cultural travelers. As of 2024 Viking is the world’s largest river cruise operator, reinforcing brand credibility and scale. The edge compounds if the firm continuously invests in fresh itineraries, expert guides, and local partnerships. Invest: steady content and partnerships sustain premium pricing and repeat demand.
Direct-to-Consumer Brand Engine
Viking's Direct-to-Consumer brand engine raises brand awareness and shifts bookings to owned channels, cutting third-party distribution fees and increasing margin; direct channels often deliver cost savings versus intermediaries and strengthen guest lifetime value. In a growing cruise market, higher DTC share converts to measurable market share gains. It requires heavy media and content investment, burning cash early but producing tangible ROI as CAC falls and repeat rates rise; keep scaling the flywheel.
- Direct bookings: lower distribution cost, higher control
- Growing market: DTC share converts to market share
- Investment: high media/content spend; returns via CAC decline
- Strategy: scale the flywheel—acquire, engage, retain
Newbuild Small-Ship Program
Fleet growth aligns tightly with itinerary demand: Viking ocean ships carry 930 passengers and expedition ships 378 passengers, and capacity sells fast so scale drives per-passenger cost advantages. Capex is heavy but newbuilds are the growth throttle; prioritize delivery slots, yard efficiency and retrofit cost reductions to accelerate revenue ramp.
- Tags: capacity, 930, 378
- Tags: capex, delivery slots
- Tags: scale, cost advantage, efficiency
Premium small-ship leader — tight capacity, strong repeat demand and long‑voyage growth
Viking Ocean is a Star: high share in the expanding adult-only premium small-ship niche, driven by strong DTC, repeat demand and cultural positioning. Capacity tightness (930 ocean, 378 expedition) and long-voyage growth (flagship 245-day world cruise) justify continued heavy investment to defend leadership.
| Metric | 2024 |
|---|---|
| Ocean capacity | 930 |
| Expedition capacity | 378 |
| Flagship world cruise | 245 days |
| River ranking | World’s largest |
What is included in the product
Detailed Word Document
BCG Matrix review of Viking Cruises: categorizes lines into Stars, Cash Cows, Question Marks, Dogs with clear investment guidance.
Customizable Excel Spreadsheet
One-page BCG matrix for Viking Cruises, placing each cruise line in a quadrant to spot inefficiencies fast.
Cash Cows
European River Cruises (Rhine, Danube core)
European river cruises (Rhine, Danube core) are a mature 2024 market where Viking remains the name to beat; Viking’s river fleet (~60 ships) drives scale, with industry occupancy typically 90–95% and repeat-booking rates around 50%, supporting strong margins and high yield. Marketing spend is lower than ocean; operational excellence (crew, itinerary execution) is the main profit lever, so milk steadily while maintaining service standards.
Included Excursions Model
Viking's Included Excursions Model is now an expected component across its ocean and river itineraries, delivering predictable take-up and streamlined operations that convert to high incremental margins. Limited incremental promotional spend is required given strong brand loyalty and packaging efficiency. Proceeds from this cash-cow bundle are redeployed to fund growth bets such as fleet expansion and new itineraries.
North American Repeat Guest Base
North American repeat guests are a loyal, affluent cohort with high lifetime value; 2024 industry data show repeat passengers account for about 60% of premium-segment bookings, driving steady revenues. Acquisition costs fall sharply after the first cruise as email and catalogs deliver most rebookings, producing high marketing ROI. Growth is modest but cash flow is rich; prioritize nurturing retention over heavy new-capex or aggressive acquisition spend.
Established Port & Shore Partnerships (Europe)
Locked-in European port and shore partnerships give Viking predictable berthing and contracting, reducing schedule disruptions and securing better pricing; CLIA reported ~30 million global cruise passengers in 2023, highlighting scale but slow near-term growth in Europe. These entrenched relationships protect market share with minimal incremental spend while schedule optimization can meaningfully lift yield.
- Locked-in slots: lower variability, better rates
- Market: large scale (CLIA 2023 ~30M) but slow growth
- Capex/Opex: minimal incremental spend required
- Action: optimize itineraries to increase yield
Onboard Enrichment & Lectures
Onboard Enrichment & Lectures at Viking Cruises is a differentiator now standardized fleetwide, efficiently delivered across over 70 vessels (2024) and driving high guest satisfaction with predictable staffing and content costs; the mature program yields steady onboard revenue and margin contribution with minimal incremental investment.
- Standardized delivery
- High guest satisfaction
- Predictable costs
- Mature, steady returns
- Light-touch refreshes
Mature river and premium ocean fleets: 90–95% occupancy, loyal guests fund growth
Viking’s mature river (≈60 ships) and premium ocean (~70 ships) segments are cash cows in 2024, with occupancy 90–95% and repeat rates 50–60%, delivering high margins and low marketing spend; revenues fund fleet expansion and selective itineraries while ops efficiencies sustain yields.
| Metric | 2024 |
|---|---|
| Fleet (river/ocean) | ~60 / ~70 |
| Occupancy | 90–95% |
| Repeat rate | 50–60% |
Delivered as Shown
Viking Cruises BCG Matrix
The file you’re previewing here is the exact BCG Matrix report you’ll receive after purchase — no watermarks, no placeholders, just the finished product. This is the working document: professionally formatted, analysis-ready, and built for immediate use. Buy once and download instantly to edit, print, or present. It’s the same file, delivered clean and ready to go.
Description
See the Bigger Picture
Curious how Viking Cruises’ offerings map across Stars, Cash Cows, Dogs and Question Marks? This brief peek hints at where their growth pockets and cash generators live—but the full BCG Matrix lays out quadrant-by-quadrant placements, data-backed recommendations, and a clear capital-allocation roadmap. Purchase the complete report for a ready-to-present Word analysis plus a high-level Excel summary and start making sharper, faster strategic choices.
Stars
Viking Ocean Cruises (premium, adult-only)
Viking Ocean Cruises commands a high market share in the adult-only, small-ship premium niche, a category still expanding as of 2024. Strong brand pull and high repeat business keep ships sailing full—Viking ocean vessels carry about 930 passengers each. Defending leadership requires ongoing investment in newbuilds, destination access, and top-tier service. Keep the foot on the gas—this is where to invest.
Longer Voyages & World Cruises
Demand is rising as affluent travelers trade up for time-rich itineraries, reflected in Viking's flagship 245-day world cruise offering. Viking owns the cultural immersion at sea story and is rapidly growing share in long-voyage segments. Marketing spend and fleet capacity commitments are substantial but payback is evident from multiyear world-cruise sales. Maintain momentum and lock in port rights early to secure itineraries.
Destination-Focused Positioning
Viking’s “no casinos, no kids, all culture” positioning clearly leads this growing niche and acts as both a moat and a magnet for affluent cultural travelers. As of 2024 Viking is the world’s largest river cruise operator, reinforcing brand credibility and scale. The edge compounds if the firm continuously invests in fresh itineraries, expert guides, and local partnerships. Invest: steady content and partnerships sustain premium pricing and repeat demand.
Direct-to-Consumer Brand Engine
Viking's Direct-to-Consumer brand engine raises brand awareness and shifts bookings to owned channels, cutting third-party distribution fees and increasing margin; direct channels often deliver cost savings versus intermediaries and strengthen guest lifetime value. In a growing cruise market, higher DTC share converts to measurable market share gains. It requires heavy media and content investment, burning cash early but producing tangible ROI as CAC falls and repeat rates rise; keep scaling the flywheel.
- Direct bookings: lower distribution cost, higher control
- Growing market: DTC share converts to market share
- Investment: high media/content spend; returns via CAC decline
- Strategy: scale the flywheel—acquire, engage, retain
Newbuild Small-Ship Program
Fleet growth aligns tightly with itinerary demand: Viking ocean ships carry 930 passengers and expedition ships 378 passengers, and capacity sells fast so scale drives per-passenger cost advantages. Capex is heavy but newbuilds are the growth throttle; prioritize delivery slots, yard efficiency and retrofit cost reductions to accelerate revenue ramp.
- Tags: capacity, 930, 378
- Tags: capex, delivery slots
- Tags: scale, cost advantage, efficiency
Premium small-ship leader — tight capacity, strong repeat demand and long‑voyage growth
Viking Ocean is a Star: high share in the expanding adult-only premium small-ship niche, driven by strong DTC, repeat demand and cultural positioning. Capacity tightness (930 ocean, 378 expedition) and long-voyage growth (flagship 245-day world cruise) justify continued heavy investment to defend leadership.
| Metric | 2024 |
|---|---|
| Ocean capacity | 930 |
| Expedition capacity | 378 |
| Flagship world cruise | 245 days |
| River ranking | World’s largest |
What is included in the product
Detailed Word Document
BCG Matrix review of Viking Cruises: categorizes lines into Stars, Cash Cows, Question Marks, Dogs with clear investment guidance.
Customizable Excel Spreadsheet
One-page BCG matrix for Viking Cruises, placing each cruise line in a quadrant to spot inefficiencies fast.
Cash Cows
European River Cruises (Rhine, Danube core)
European river cruises (Rhine, Danube core) are a mature 2024 market where Viking remains the name to beat; Viking’s river fleet (~60 ships) drives scale, with industry occupancy typically 90–95% and repeat-booking rates around 50%, supporting strong margins and high yield. Marketing spend is lower than ocean; operational excellence (crew, itinerary execution) is the main profit lever, so milk steadily while maintaining service standards.
Included Excursions Model
Viking's Included Excursions Model is now an expected component across its ocean and river itineraries, delivering predictable take-up and streamlined operations that convert to high incremental margins. Limited incremental promotional spend is required given strong brand loyalty and packaging efficiency. Proceeds from this cash-cow bundle are redeployed to fund growth bets such as fleet expansion and new itineraries.
North American Repeat Guest Base
North American repeat guests are a loyal, affluent cohort with high lifetime value; 2024 industry data show repeat passengers account for about 60% of premium-segment bookings, driving steady revenues. Acquisition costs fall sharply after the first cruise as email and catalogs deliver most rebookings, producing high marketing ROI. Growth is modest but cash flow is rich; prioritize nurturing retention over heavy new-capex or aggressive acquisition spend.
Established Port & Shore Partnerships (Europe)
Locked-in European port and shore partnerships give Viking predictable berthing and contracting, reducing schedule disruptions and securing better pricing; CLIA reported ~30 million global cruise passengers in 2023, highlighting scale but slow near-term growth in Europe. These entrenched relationships protect market share with minimal incremental spend while schedule optimization can meaningfully lift yield.
- Locked-in slots: lower variability, better rates
- Market: large scale (CLIA 2023 ~30M) but slow growth
- Capex/Opex: minimal incremental spend required
- Action: optimize itineraries to increase yield
Onboard Enrichment & Lectures
Onboard Enrichment & Lectures at Viking Cruises is a differentiator now standardized fleetwide, efficiently delivered across over 70 vessels (2024) and driving high guest satisfaction with predictable staffing and content costs; the mature program yields steady onboard revenue and margin contribution with minimal incremental investment.
- Standardized delivery
- High guest satisfaction
- Predictable costs
- Mature, steady returns
- Light-touch refreshes
Mature river and premium ocean fleets: 90–95% occupancy, loyal guests fund growth
Viking’s mature river (≈60 ships) and premium ocean (~70 ships) segments are cash cows in 2024, with occupancy 90–95% and repeat rates 50–60%, delivering high margins and low marketing spend; revenues fund fleet expansion and selective itineraries while ops efficiencies sustain yields.
| Metric | 2024 |
|---|---|
| Fleet (river/ocean) | ~60 / ~70 |
| Occupancy | 90–95% |
| Repeat rate | 50–60% |
Delivered as Shown
Viking Cruises BCG Matrix
The file you’re previewing here is the exact BCG Matrix report you’ll receive after purchase — no watermarks, no placeholders, just the finished product. This is the working document: professionally formatted, analysis-ready, and built for immediate use. Buy once and download instantly to edit, print, or present. It’s the same file, delivered clean and ready to go.











