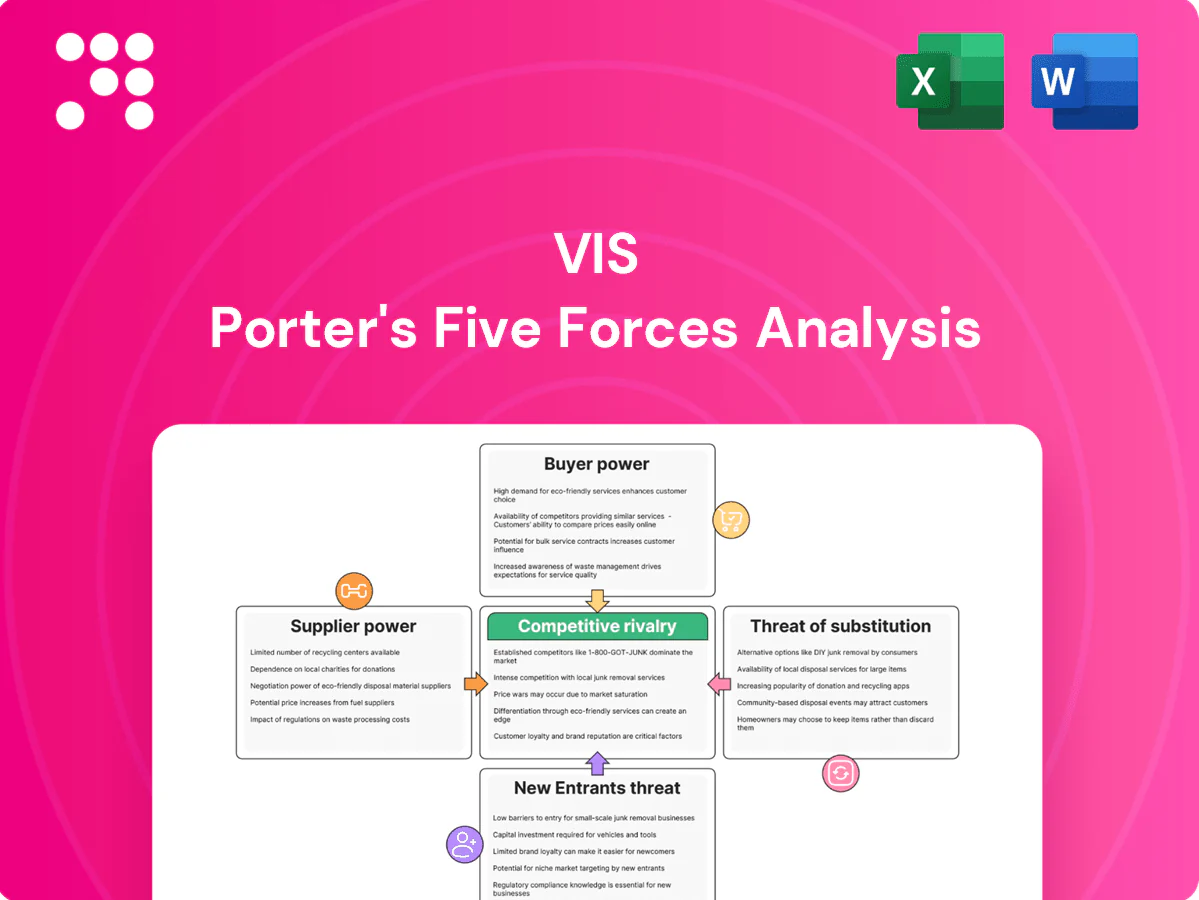
VIS Porter's Five Forces Analysis

A Must-Have Tool for Decision-Makers
VIS Porter's Five Forces Analysis highlights buyer/supplier power, rival intensity, threat of entrants and substitutes, and the industry dynamics shaping VIS’s strategic position. This brief snapshot only scratches the surface—unlock the full report for force-by-force ratings, visuals, and actionable insights to inform investments and strategy.
Suppliers Bargaining Power

Concentrated equipment vendors
ASML, Applied Materials, Lam Research and KLA supply the bulk of wafer-fab tools; ASML remains the sole supplier of EUV systems and the top four account for over half of wafer-tool revenue in 2024.
Limited alternatives raise switching costs and delivery risk, with typical new-tool lead times of 12–24 months in 2024 and single-fab capex for leading-edge sites exceeding $15 billion.
VIS must accept vendor roadmaps and service terms, constraining its ability to reprice products quickly and tying capacity expansions to supplier delivery schedules.
Specialty materials dependence
In 2024 silicon wafers are dominated by Shin‑Etsu (about 30–35% share) and SUMCO (roughly 25–30%), while specialty gases are concentrated among Linde/Air Products and photoresists by Merck and Japanese firms; these suppliers control critical upstream capacity.
Stringent purity and process specs narrow feasible suppliers, and dual‑sourcing is possible for some inputs but often infeasible for leading‑edge nodes.
Price volatility and allocation during upcycles—wafer ASPs rose roughly 15–25% in the 2021–22 upcycle and supply tightness reappeared in 2023–24—heighten supplier leverage.

Utilities and ESG constraints
Fabs are power- and water-intensive—advanced fabs in 2024 typically draw 80–120 MW and 1.5–3 million gallons/day, tying VIS to local utility pricing and availability. ESG and regulatory pressure (water reuse mandates, net-zero targets) can add CAPEX/OPEX and limit siting flexibility. Utility outages or rationing create production risks suppliers cannot easily offset. Long-term contracts secure supply but reduce short-term negotiating leverage.

Process IP and EDA ecosystem
Foundry PDKs tightly depend on EDA/IP leaders such as Synopsys and Cadence, which together account for roughly 70% of the EDA market, creating systemic dependence. License models and proprietary interoperability requirements drive strong lock-in; moving tool flows requires months of revalidation and multimillion-dollar qualification programs and carries yield risk. Suppliers use support, certification and verified IP stacks to extract favorable commercial terms.
- PDK dependence: Synopsys/Cadence ~70% EDA market
- Lock-in: proprietary licenses + interoperability
- Switch cost: months of validation, multimillion-dollar programs
- Supplier leverage: support, certification, verified IP
Spare parts and service lock-in
- OEM control of proprietary parts
- SLAs often target 99%+ uptime
- Delays raise cycle time and hurt delivery
- Inventory buffers cut risk, raise working capital
Top-4 suppliers >50% share and EDA ~70% create vendor lock-in with 12–24m lead times
Supplier concentration (ASML, Applied, Lam, KLA) and ASML’s EUV exclusivity give high bargaining power to vendors; top four >50% wafer-tool revenue in 2024.
Long lead times (12–24 months) and costly fab capex (> $15bn per leading-edge site) raise switching costs and tie VIS to supplier roadmaps.
Upstream dominance: Shin‑Etsu ~30–35%, SUMCO ~25–30%; Synopsys/Cadence ~70% EDA share increases lock-in and validation costs.
Resource intensity (80–120 MW, 1.5–3M gal/day) plus SLA/parts control further limit VIS leverage.
| Item | 2024 data |
|---|---|
| Top wafer-tool share | >50% |
| ASML EUV | sole supplier |
| Lead times | 12–24 months |
| Wafer suppliers | Shin‑Etsu 30–35%, SUMCO 25–30% |
| EDA share | Synopsys/Cadence ~70% |
| Fab utilities | 80–120 MW; 1.5–3M gal/day |
What is included in the product
 Detailed Word Document
Tailored Porter's Five Forces for VIS, uncovering competitive intensity, buyer/supplier leverage, entry barriers, substitutes and disruptive threats with data-backed strategic commentary for investor decks and plans.

 Customizable Excel Spreadsheet
VIS Porter's Five Forces delivers a clean one-sheet summary with customizable pressure levels and an instant spider chart—no macros required—so teams can quickly assess strategic threats and drop-ready visuals into pitch decks or dashboards.
Customers Bargaining Power

Large fabless customers
Top fabless customers such as Qualcomm, Broadcom, NVIDIA and MediaTek concentrated demand and represented over 45% of advanced-node wafer demand in 2024, with combined 2024 revenues exceeding $150B, driving favorable pricing. Curated vendor lists give buyers selection power. Multi-sourcing with peers like UMC and GlobalFoundries increases leverage. Long-term agreements frequently trade lower unit price for allocation security.
Design portability at mature nodes
Analog/HV/mixed-signal blocks can often be ported across comparable mature nodes, increasing buyer walk-away options and pressure on pricing; the global analog IC market was roughly $60B in 2024. Device models and sensitive analog layout dependencies limit perfect portability, with yield and performance delta often affecting costs by ≈20%. VIS can defend via superior PDK quality, higher yields and faster NPI, shortening time-to-market by weeks and preserving margin.

Cyclical demand swings
Downcycles shift bargaining power to customers as idle capacity rises; US industrial capacity utilization averaged 76.8% in 2024, enabling buyers to demand price cuts and more flexible terms; in upcycles allocation scarcity and order backlogs reduce buyer leverage; VIS must balance utilization targets with strategic account commitments to avoid margin-sapping spot discounts while preserving key customer relationships.

Qualification and switching costs
Automotive, industrial and power customers typically require 12–24 month qualification cycles; switching fabs risks performance drift and field failures with remediation often taking months, so buyer leverage falls sharply once parts are qualified, rewarding VIS for demonstrated reliability and process stability.
- Qualification cycles: 12–24 months
- Switching risk: performance drift, months to remediate
- Buyer leverage: low post-qualification
- VIS advantage: reliability/process stability premium
Value-added services
VISs value-added services—DFM support, embedded NVM, BCD and HV process options—create technical differentiation that shifts buyer focus from price to capability, supporting higher ASPs; industry practice in 2024 saw top-tier foundries reporting value-added design services contributing double-digit percentage points to gross margin.
Integrated supply-chain logistics and specialty packaging partnerships shorten time-to-market and reduce inventory costs, lowering customer propensity to purely price-shop and increasing contract duration and average deal value.
- DFM support: improves yield, raising realized ASPs
- Embedded NVM/BCD/HV: enable product stickiness
- Integrated supply chain: cuts lead times, lowers churn
- Specialty packaging: opens higher-margin segments
Concentrated buyers drove >45% advanced-node demand; revenues >$150B; US utilization 76.8%
Concentrated customers (Qualcomm, Broadcom, NVIDIA, MediaTek) drove >45% of advanced-node wafer demand in 2024; combined revenues >$150B, strengthening buyer selection power but also enabling long-term, lower-ASP allocation deals. Analog market ≈$60B in 2024; portability across mature nodes and ≈20% yield/perf deltas sustain price pressure. US capacity utilization 76.8% (2024) shifts leverage cyclically; qualification cycles 12–24 months reduce buyer power post-qualification; value-added services added double-digit points to top-tier foundry gross margins in 2024.
| Metric | 2024 Value |
|---|---|
| Top-customer share (advanced nodes) | >45% |
| Combined revenue (top customers) | >$150B |
| Global analog IC market | ≈$60B |
| US capacity utilization | 76.8% |
| Yield/perf delta on porting | ≈20% |
| Qualification cycle | 12–24 months |
| Value-added margin contribution | Double-digit pts (top-tier) |
Full Version Awaits
VIS Porter's Five Forces Analysis
This preview shows the exact VIS Porter's Five Forces Analysis you'll receive immediately after purchase—no placeholders or samples. The document displayed is the complete, professionally formatted file, ready for download and use the moment you buy. You’re previewing the final version: precise, actionable, and available instantly after payment.

A Must-Have Tool for Decision-Makers
VIS Porter's Five Forces Analysis highlights buyer/supplier power, rival intensity, threat of entrants and substitutes, and the industry dynamics shaping VIS’s strategic position. This brief snapshot only scratches the surface—unlock the full report for force-by-force ratings, visuals, and actionable insights to inform investments and strategy.
Suppliers Bargaining Power
Concentrated equipment vendors
ASML, Applied Materials, Lam Research and KLA supply the bulk of wafer-fab tools; ASML remains the sole supplier of EUV systems and the top four account for over half of wafer-tool revenue in 2024.
Limited alternatives raise switching costs and delivery risk, with typical new-tool lead times of 12–24 months in 2024 and single-fab capex for leading-edge sites exceeding $15 billion.
VIS must accept vendor roadmaps and service terms, constraining its ability to reprice products quickly and tying capacity expansions to supplier delivery schedules.
Specialty materials dependence
In 2024 silicon wafers are dominated by Shin‑Etsu (about 30–35% share) and SUMCO (roughly 25–30%), while specialty gases are concentrated among Linde/Air Products and photoresists by Merck and Japanese firms; these suppliers control critical upstream capacity.
Stringent purity and process specs narrow feasible suppliers, and dual‑sourcing is possible for some inputs but often infeasible for leading‑edge nodes.
Price volatility and allocation during upcycles—wafer ASPs rose roughly 15–25% in the 2021–22 upcycle and supply tightness reappeared in 2023–24—heighten supplier leverage.
Utilities and ESG constraints
Fabs are power- and water-intensive—advanced fabs in 2024 typically draw 80–120 MW and 1.5–3 million gallons/day, tying VIS to local utility pricing and availability. ESG and regulatory pressure (water reuse mandates, net-zero targets) can add CAPEX/OPEX and limit siting flexibility. Utility outages or rationing create production risks suppliers cannot easily offset. Long-term contracts secure supply but reduce short-term negotiating leverage.
Process IP and EDA ecosystem
Foundry PDKs tightly depend on EDA/IP leaders such as Synopsys and Cadence, which together account for roughly 70% of the EDA market, creating systemic dependence. License models and proprietary interoperability requirements drive strong lock-in; moving tool flows requires months of revalidation and multimillion-dollar qualification programs and carries yield risk. Suppliers use support, certification and verified IP stacks to extract favorable commercial terms.
- PDK dependence: Synopsys/Cadence ~70% EDA market
- Lock-in: proprietary licenses + interoperability
- Switch cost: months of validation, multimillion-dollar programs
- Supplier leverage: support, certification, verified IP
Spare parts and service lock-in
- OEM control of proprietary parts
- SLAs often target 99%+ uptime
- Delays raise cycle time and hurt delivery
- Inventory buffers cut risk, raise working capital
Top-4 suppliers >50% share and EDA ~70% create vendor lock-in with 12–24m lead times
Supplier concentration (ASML, Applied, Lam, KLA) and ASML’s EUV exclusivity give high bargaining power to vendors; top four >50% wafer-tool revenue in 2024.
Long lead times (12–24 months) and costly fab capex (> $15bn per leading-edge site) raise switching costs and tie VIS to supplier roadmaps.
Upstream dominance: Shin‑Etsu ~30–35%, SUMCO ~25–30%; Synopsys/Cadence ~70% EDA share increases lock-in and validation costs.
Resource intensity (80–120 MW, 1.5–3M gal/day) plus SLA/parts control further limit VIS leverage.
| Item | 2024 data |
|---|---|
| Top wafer-tool share | >50% |
| ASML EUV | sole supplier |
| Lead times | 12–24 months |
| Wafer suppliers | Shin‑Etsu 30–35%, SUMCO 25–30% |
| EDA share | Synopsys/Cadence ~70% |
| Fab utilities | 80–120 MW; 1.5–3M gal/day |
What is included in the product
Detailed Word Document
Tailored Porter's Five Forces for VIS, uncovering competitive intensity, buyer/supplier leverage, entry barriers, substitutes and disruptive threats with data-backed strategic commentary for investor decks and plans.
Customizable Excel Spreadsheet
VIS Porter's Five Forces delivers a clean one-sheet summary with customizable pressure levels and an instant spider chart—no macros required—so teams can quickly assess strategic threats and drop-ready visuals into pitch decks or dashboards.
Customers Bargaining Power
Large fabless customers
Top fabless customers such as Qualcomm, Broadcom, NVIDIA and MediaTek concentrated demand and represented over 45% of advanced-node wafer demand in 2024, with combined 2024 revenues exceeding $150B, driving favorable pricing. Curated vendor lists give buyers selection power. Multi-sourcing with peers like UMC and GlobalFoundries increases leverage. Long-term agreements frequently trade lower unit price for allocation security.
Design portability at mature nodes
Analog/HV/mixed-signal blocks can often be ported across comparable mature nodes, increasing buyer walk-away options and pressure on pricing; the global analog IC market was roughly $60B in 2024. Device models and sensitive analog layout dependencies limit perfect portability, with yield and performance delta often affecting costs by ≈20%. VIS can defend via superior PDK quality, higher yields and faster NPI, shortening time-to-market by weeks and preserving margin.
Cyclical demand swings
Downcycles shift bargaining power to customers as idle capacity rises; US industrial capacity utilization averaged 76.8% in 2024, enabling buyers to demand price cuts and more flexible terms; in upcycles allocation scarcity and order backlogs reduce buyer leverage; VIS must balance utilization targets with strategic account commitments to avoid margin-sapping spot discounts while preserving key customer relationships.
Qualification and switching costs
Automotive, industrial and power customers typically require 12–24 month qualification cycles; switching fabs risks performance drift and field failures with remediation often taking months, so buyer leverage falls sharply once parts are qualified, rewarding VIS for demonstrated reliability and process stability.
- Qualification cycles: 12–24 months
- Switching risk: performance drift, months to remediate
- Buyer leverage: low post-qualification
- VIS advantage: reliability/process stability premium
Value-added services
VISs value-added services—DFM support, embedded NVM, BCD and HV process options—create technical differentiation that shifts buyer focus from price to capability, supporting higher ASPs; industry practice in 2024 saw top-tier foundries reporting value-added design services contributing double-digit percentage points to gross margin.
Integrated supply-chain logistics and specialty packaging partnerships shorten time-to-market and reduce inventory costs, lowering customer propensity to purely price-shop and increasing contract duration and average deal value.
- DFM support: improves yield, raising realized ASPs
- Embedded NVM/BCD/HV: enable product stickiness
- Integrated supply chain: cuts lead times, lowers churn
- Specialty packaging: opens higher-margin segments
Concentrated buyers drove >45% advanced-node demand; revenues >$150B; US utilization 76.8%
Concentrated customers (Qualcomm, Broadcom, NVIDIA, MediaTek) drove >45% of advanced-node wafer demand in 2024; combined revenues >$150B, strengthening buyer selection power but also enabling long-term, lower-ASP allocation deals. Analog market ≈$60B in 2024; portability across mature nodes and ≈20% yield/perf deltas sustain price pressure. US capacity utilization 76.8% (2024) shifts leverage cyclically; qualification cycles 12–24 months reduce buyer power post-qualification; value-added services added double-digit points to top-tier foundry gross margins in 2024.
| Metric | 2024 Value |
|---|---|
| Top-customer share (advanced nodes) | >45% |
| Combined revenue (top customers) | >$150B |
| Global analog IC market | ≈$60B |
| US capacity utilization | 76.8% |
| Yield/perf delta on porting | ≈20% |
| Qualification cycle | 12–24 months |
| Value-added margin contribution | Double-digit pts (top-tier) |
Full Version Awaits
VIS Porter's Five Forces Analysis
This preview shows the exact VIS Porter's Five Forces Analysis you'll receive immediately after purchase—no placeholders or samples. The document displayed is the complete, professionally formatted file, ready for download and use the moment you buy. You’re previewing the final version: precise, actionable, and available instantly after payment.
Original: $10.00
-65%$10.00
$3.50Description
A Must-Have Tool for Decision-Makers
VIS Porter's Five Forces Analysis highlights buyer/supplier power, rival intensity, threat of entrants and substitutes, and the industry dynamics shaping VIS’s strategic position. This brief snapshot only scratches the surface—unlock the full report for force-by-force ratings, visuals, and actionable insights to inform investments and strategy.
Suppliers Bargaining Power
Concentrated equipment vendors
ASML, Applied Materials, Lam Research and KLA supply the bulk of wafer-fab tools; ASML remains the sole supplier of EUV systems and the top four account for over half of wafer-tool revenue in 2024.
Limited alternatives raise switching costs and delivery risk, with typical new-tool lead times of 12–24 months in 2024 and single-fab capex for leading-edge sites exceeding $15 billion.
VIS must accept vendor roadmaps and service terms, constraining its ability to reprice products quickly and tying capacity expansions to supplier delivery schedules.
Specialty materials dependence
In 2024 silicon wafers are dominated by Shin‑Etsu (about 30–35% share) and SUMCO (roughly 25–30%), while specialty gases are concentrated among Linde/Air Products and photoresists by Merck and Japanese firms; these suppliers control critical upstream capacity.
Stringent purity and process specs narrow feasible suppliers, and dual‑sourcing is possible for some inputs but often infeasible for leading‑edge nodes.
Price volatility and allocation during upcycles—wafer ASPs rose roughly 15–25% in the 2021–22 upcycle and supply tightness reappeared in 2023–24—heighten supplier leverage.
Utilities and ESG constraints
Fabs are power- and water-intensive—advanced fabs in 2024 typically draw 80–120 MW and 1.5–3 million gallons/day, tying VIS to local utility pricing and availability. ESG and regulatory pressure (water reuse mandates, net-zero targets) can add CAPEX/OPEX and limit siting flexibility. Utility outages or rationing create production risks suppliers cannot easily offset. Long-term contracts secure supply but reduce short-term negotiating leverage.
Process IP and EDA ecosystem
Foundry PDKs tightly depend on EDA/IP leaders such as Synopsys and Cadence, which together account for roughly 70% of the EDA market, creating systemic dependence. License models and proprietary interoperability requirements drive strong lock-in; moving tool flows requires months of revalidation and multimillion-dollar qualification programs and carries yield risk. Suppliers use support, certification and verified IP stacks to extract favorable commercial terms.
- PDK dependence: Synopsys/Cadence ~70% EDA market
- Lock-in: proprietary licenses + interoperability
- Switch cost: months of validation, multimillion-dollar programs
- Supplier leverage: support, certification, verified IP
Spare parts and service lock-in
- OEM control of proprietary parts
- SLAs often target 99%+ uptime
- Delays raise cycle time and hurt delivery
- Inventory buffers cut risk, raise working capital
Top-4 suppliers >50% share and EDA ~70% create vendor lock-in with 12–24m lead times
Supplier concentration (ASML, Applied, Lam, KLA) and ASML’s EUV exclusivity give high bargaining power to vendors; top four >50% wafer-tool revenue in 2024.
Long lead times (12–24 months) and costly fab capex (> $15bn per leading-edge site) raise switching costs and tie VIS to supplier roadmaps.
Upstream dominance: Shin‑Etsu ~30–35%, SUMCO ~25–30%; Synopsys/Cadence ~70% EDA share increases lock-in and validation costs.
Resource intensity (80–120 MW, 1.5–3M gal/day) plus SLA/parts control further limit VIS leverage.
| Item | 2024 data |
|---|---|
| Top wafer-tool share | >50% |
| ASML EUV | sole supplier |
| Lead times | 12–24 months |
| Wafer suppliers | Shin‑Etsu 30–35%, SUMCO 25–30% |
| EDA share | Synopsys/Cadence ~70% |
| Fab utilities | 80–120 MW; 1.5–3M gal/day |
What is included in the product
Detailed Word Document
Tailored Porter's Five Forces for VIS, uncovering competitive intensity, buyer/supplier leverage, entry barriers, substitutes and disruptive threats with data-backed strategic commentary for investor decks and plans.
Customizable Excel Spreadsheet
VIS Porter's Five Forces delivers a clean one-sheet summary with customizable pressure levels and an instant spider chart—no macros required—so teams can quickly assess strategic threats and drop-ready visuals into pitch decks or dashboards.
Customers Bargaining Power
Large fabless customers
Top fabless customers such as Qualcomm, Broadcom, NVIDIA and MediaTek concentrated demand and represented over 45% of advanced-node wafer demand in 2024, with combined 2024 revenues exceeding $150B, driving favorable pricing. Curated vendor lists give buyers selection power. Multi-sourcing with peers like UMC and GlobalFoundries increases leverage. Long-term agreements frequently trade lower unit price for allocation security.
Design portability at mature nodes
Analog/HV/mixed-signal blocks can often be ported across comparable mature nodes, increasing buyer walk-away options and pressure on pricing; the global analog IC market was roughly $60B in 2024. Device models and sensitive analog layout dependencies limit perfect portability, with yield and performance delta often affecting costs by ≈20%. VIS can defend via superior PDK quality, higher yields and faster NPI, shortening time-to-market by weeks and preserving margin.
Cyclical demand swings
Downcycles shift bargaining power to customers as idle capacity rises; US industrial capacity utilization averaged 76.8% in 2024, enabling buyers to demand price cuts and more flexible terms; in upcycles allocation scarcity and order backlogs reduce buyer leverage; VIS must balance utilization targets with strategic account commitments to avoid margin-sapping spot discounts while preserving key customer relationships.
Qualification and switching costs
Automotive, industrial and power customers typically require 12–24 month qualification cycles; switching fabs risks performance drift and field failures with remediation often taking months, so buyer leverage falls sharply once parts are qualified, rewarding VIS for demonstrated reliability and process stability.
- Qualification cycles: 12–24 months
- Switching risk: performance drift, months to remediate
- Buyer leverage: low post-qualification
- VIS advantage: reliability/process stability premium
Value-added services
VISs value-added services—DFM support, embedded NVM, BCD and HV process options—create technical differentiation that shifts buyer focus from price to capability, supporting higher ASPs; industry practice in 2024 saw top-tier foundries reporting value-added design services contributing double-digit percentage points to gross margin.
Integrated supply-chain logistics and specialty packaging partnerships shorten time-to-market and reduce inventory costs, lowering customer propensity to purely price-shop and increasing contract duration and average deal value.
- DFM support: improves yield, raising realized ASPs
- Embedded NVM/BCD/HV: enable product stickiness
- Integrated supply chain: cuts lead times, lowers churn
- Specialty packaging: opens higher-margin segments
Concentrated buyers drove >45% advanced-node demand; revenues >$150B; US utilization 76.8%
Concentrated customers (Qualcomm, Broadcom, NVIDIA, MediaTek) drove >45% of advanced-node wafer demand in 2024; combined revenues >$150B, strengthening buyer selection power but also enabling long-term, lower-ASP allocation deals. Analog market ≈$60B in 2024; portability across mature nodes and ≈20% yield/perf deltas sustain price pressure. US capacity utilization 76.8% (2024) shifts leverage cyclically; qualification cycles 12–24 months reduce buyer power post-qualification; value-added services added double-digit points to top-tier foundry gross margins in 2024.
| Metric | 2024 Value |
|---|---|
| Top-customer share (advanced nodes) | >45% |
| Combined revenue (top customers) | >$150B |
| Global analog IC market | ≈$60B |
| US capacity utilization | 76.8% |
| Yield/perf delta on porting | ≈20% |
| Qualification cycle | 12–24 months |
| Value-added margin contribution | Double-digit pts (top-tier) |
Full Version Awaits
VIS Porter's Five Forces Analysis
This preview shows the exact VIS Porter's Five Forces Analysis you'll receive immediately after purchase—no placeholders or samples. The document displayed is the complete, professionally formatted file, ready for download and use the moment you buy. You’re previewing the final version: precise, actionable, and available instantly after payment.











