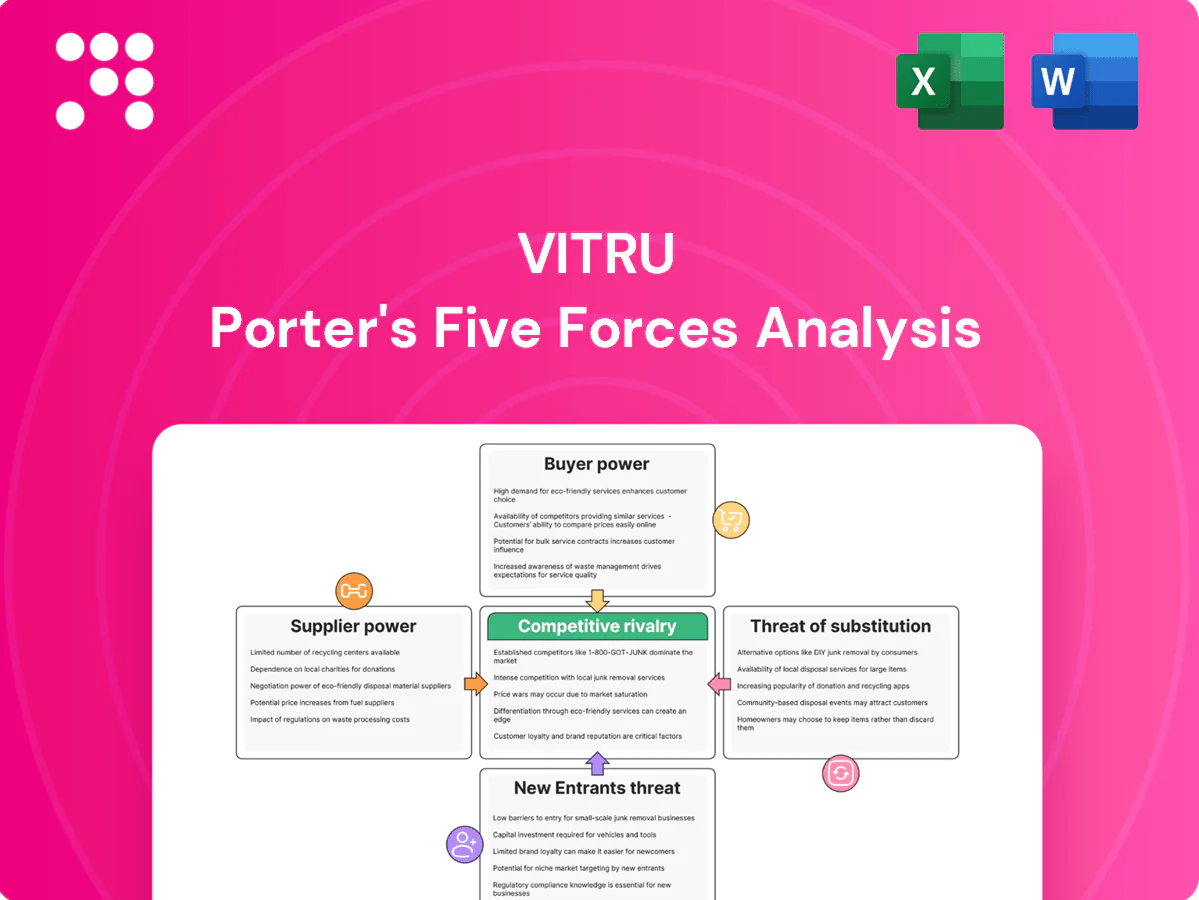
Vitru Porter's Five Forces Analysis

From Overview to Strategy Blueprint
Vitru’s Porter’s Five Forces snapshot highlights competitive intensity, supplier and buyer pressures, substitute threats, and barriers to entry in concise terms. It reveals where Vitru holds leverage and where risks concentrate. This brief preview shows patterns—full analysis quantifies force strength and strategic implications. Unlock the complete report for force-by-force ratings, visuals, and actionable strategy recommendations.
Suppliers Bargaining Power

Dependence on LMS/cloud vendors
Core platform reliability and scalability hinge on a few major cloud/LMS vendors: AWS, Azure and GCP held roughly 33%, 23% and 12% of global cloud market in 2024, and the top three LMS vendors cover an estimated majority of higher-ed deployments. Such concentration gives suppliers leverage on pricing and contract terms. Multi-cloud and in-house tooling mitigate vendor lock-in but add ~20–30% operational complexity and cost. Outages or contract changes can directly degrade learner experience and breach SLAs.
Faculty and content creators
Qualified instructors, tutors and SMEs supply core content and teaching capacity; in 2024 niche STEM and AI instructors commanded 20–40% higher rates than generalists, boosting supplier leverage. Digital scale and modular content reduce dependence on any single academic, with platform course reuse lowering per-course labor share by up to 30%. Long-term contracts and in-house studios further cap supplier bargaining power.

Digital marketing channels
Customer acquisition relies on paid search, social, affiliates and marketplace partners; auction platforms exert pricing power—CPC/CPM rose roughly 15% YoY into 2023–24—while Amazon Ads generated $37.7B in 2023. Strong brand equity and top‑3 organic listings capture about two‑thirds of clicks, reducing paid dependence. Performance-driven mixes and owned media (email, apps) materially cut supplier leverage and lower CAC.

Telecom/proctoring/edtech tools
ISPs, remote proctoring, video and assessment tools are specialized supplier inputs for Vitru; switching costs rise from integrations, data privacy and accreditation compliance, locking platforms into providers. The global edtech market is roughly $400B (2024 est.), while proctoring and assessment vendors proliferate, enabling competitive bidding. Bundling and volume commitments often secure discounts and SLAs.
Physical center (polo) partners
For blended compliance and exams, local physical centers supply facilities and proctors, making them critical suppliers; in underserved regions limited partner options have pushed partner fees materially higher (reported premiums up to 20% in 2024), while standardized contracts and multi-partner networks have driven negotiated fee reductions of ~10% on average; investment in owned centers (capex) cuts long-term dependence and variable cost exposure.
- Supplier concentration: regional scarcity can raise fees
- Contract standardization: improves terms ~10%
- Multi-partner networks: increase leverage
- Owned centers: reduces variable costs and reliance
Supplier risk rises with cloud concentration; edtech market $400B
Supplier power is elevated by cloud/LMS concentration (AWS 33%, Azure 23%, GCP 12% in 2024) and high switching/compliance costs; outages or contract shifts can breach SLAs. Niche STEM/AI instructors commanded 20–40% higher rates in 2024, though modular content cuts per-course labor by ~30%. Ad platforms pushed CAC as CPC/CPM grew ~15% YoY (2023–24), while edtech scale (~$400B in 2024) enables bulk discounts and bidding.
| Metric | 2024 |
|---|---|
| Cloud share (top3) | AWS33%/AZ23%/GCP12% |
| Edtech market | $400B |
| Niche instructor premium | 20–40% |
| CPC/CPM YoY | +15% |
What is included in the product
 Detailed Word Document
Comprehensive Porter's Five Forces analysis tailored for Vitru, uncovering competitive drivers, buyer and supplier power, substitutes, and entry barriers with data-backed insights and strategic commentary; fully editable in Word for use in business plans, investor materials, and internal strategy decks.

 Customizable Excel Spreadsheet
A concise one-sheet Vitru Porter’s Five Forces summary that instantly visualizes competitive pressure with a spider chart and customizable inputs—ready to drop into decks or duplicate for alternative scenarios without any code.
Customers Bargaining Power

Price-sensitive students
Brazilian learners are highly cost-conscious, with about 75% of higher-education enrollments in private institutions driving intense tuition comparisons. Transparent pricing and frequent promotions amplify student bargaining power and churn. Scholarships and installment plans (commonly offered over 12–60 months) narrow price gaps. Strong outcome signaling, such as employability rates, lowers price elasticity by justifying higher fees.
Low switching costs online
Students can switch programs each term with limited sunk costs, keeping customer bargaining power high; the global online education market exceeded $300 billion in 2024, intensifying provider competition. Credit transfer friction and brand prestige create partial stickiness, while superior UX, support, and clear completion pathways raise switching costs. Robust alumni networks and career services further deepen lock-in.

B2B/partner institutions
In 2024 global corporate L&D spend reached an estimated $420 billion, giving institutional buyers scale to negotiate volume discounts typically in the 10–30% range. Concentrated buyers (top 20% of accounts) routinely demand customization and SLAs, driving implementation costs up. Cohort-based programs raise platform utilization by ~15–25% but can compress gross margins by ~5–10%. Multi-year contracts cut churn ~30% and reduce per-seat bargaining power by ~12–20%.

Information-rich choices
Ratings, outcomes data, and social proof raise buyer leverage for Vitru by 2024, with platform analytics showing review-influenced enrollments around 64%, intensifying price and feature negotiations as curricula become easily comparable online. Differentiated certifications and third-party accreditation can command 10-25% price premiums, counterbalancing bargaining power. Transparent outcomes reporting reduces haggling by building trust and shortening sales cycles.
- Ratings drive decisions — 64% influence (2024)
- Comparability increases leverage
- Accreditation = 10-25% premium
- Transparent outcomes cut negotiation time
Financing and payment terms
Access to credit, income-based plans and government aid materially shape affordability, driving buyers to demand flexible terms and low upfront costs; in 2024 many consumers prioritized payment flexibility over price. Partnerships with fintechs meet demand but typically require 15-25% revenue share, while in-house lending or guarantees can restore 5-15% margin at higher credit risk and capital needs.
- Access to credit: primary affordability driver
- Buyer demands: flexible terms, low upfront costs
- Fintech partnerships: 15-25% revenue share
- Own-lending: +5-15% margin, higher risk
Students price-sensitive (~75%); reviews drive 64% enrollments
Students are highly price-sensitive (≈75% private enrollments) and churn-prone due to transparent pricing; reviews drive ~64% of enrollments, boosting bargaining power. Institutional buyers (corporate L&D) negotiate 10–30% discounts as market >$300B (online) and $420B (L&D) in 2024. Accreditation can secure 10–25% premiums; fintech partnerships cost 15–25% revenue share.
| Metric | 2024 |
|---|---|
| Private enrollments | ~75% |
| Review influence | 64% |
| Online market | >$300B |
| Corporate L&D | $420B |
| Accreditation premium | 10–25% |
| Fintech rev share | 15–25% |
What You See Is What You Get
Vitru Porter's Five Forces Analysis
This preview shows the exact document you'll receive immediately after purchase—no surprises or placeholders. It is the full Vitru Porter's Five Forces Analysis, professionally written and formatted for immediate use. Upon payment you’ll get instant access to this identical file, ready to download and apply.

From Overview to Strategy Blueprint
Vitru’s Porter’s Five Forces snapshot highlights competitive intensity, supplier and buyer pressures, substitute threats, and barriers to entry in concise terms. It reveals where Vitru holds leverage and where risks concentrate. This brief preview shows patterns—full analysis quantifies force strength and strategic implications. Unlock the complete report for force-by-force ratings, visuals, and actionable strategy recommendations.
Suppliers Bargaining Power
Dependence on LMS/cloud vendors
Core platform reliability and scalability hinge on a few major cloud/LMS vendors: AWS, Azure and GCP held roughly 33%, 23% and 12% of global cloud market in 2024, and the top three LMS vendors cover an estimated majority of higher-ed deployments. Such concentration gives suppliers leverage on pricing and contract terms. Multi-cloud and in-house tooling mitigate vendor lock-in but add ~20–30% operational complexity and cost. Outages or contract changes can directly degrade learner experience and breach SLAs.
Faculty and content creators
Qualified instructors, tutors and SMEs supply core content and teaching capacity; in 2024 niche STEM and AI instructors commanded 20–40% higher rates than generalists, boosting supplier leverage. Digital scale and modular content reduce dependence on any single academic, with platform course reuse lowering per-course labor share by up to 30%. Long-term contracts and in-house studios further cap supplier bargaining power.
Digital marketing channels
Customer acquisition relies on paid search, social, affiliates and marketplace partners; auction platforms exert pricing power—CPC/CPM rose roughly 15% YoY into 2023–24—while Amazon Ads generated $37.7B in 2023. Strong brand equity and top‑3 organic listings capture about two‑thirds of clicks, reducing paid dependence. Performance-driven mixes and owned media (email, apps) materially cut supplier leverage and lower CAC.
Telecom/proctoring/edtech tools
ISPs, remote proctoring, video and assessment tools are specialized supplier inputs for Vitru; switching costs rise from integrations, data privacy and accreditation compliance, locking platforms into providers. The global edtech market is roughly $400B (2024 est.), while proctoring and assessment vendors proliferate, enabling competitive bidding. Bundling and volume commitments often secure discounts and SLAs.
Physical center (polo) partners
For blended compliance and exams, local physical centers supply facilities and proctors, making them critical suppliers; in underserved regions limited partner options have pushed partner fees materially higher (reported premiums up to 20% in 2024), while standardized contracts and multi-partner networks have driven negotiated fee reductions of ~10% on average; investment in owned centers (capex) cuts long-term dependence and variable cost exposure.
- Supplier concentration: regional scarcity can raise fees
- Contract standardization: improves terms ~10%
- Multi-partner networks: increase leverage
- Owned centers: reduces variable costs and reliance
Supplier risk rises with cloud concentration; edtech market $400B
Supplier power is elevated by cloud/LMS concentration (AWS 33%, Azure 23%, GCP 12% in 2024) and high switching/compliance costs; outages or contract shifts can breach SLAs. Niche STEM/AI instructors commanded 20–40% higher rates in 2024, though modular content cuts per-course labor by ~30%. Ad platforms pushed CAC as CPC/CPM grew ~15% YoY (2023–24), while edtech scale (~$400B in 2024) enables bulk discounts and bidding.
| Metric | 2024 |
|---|---|
| Cloud share (top3) | AWS33%/AZ23%/GCP12% |
| Edtech market | $400B |
| Niche instructor premium | 20–40% |
| CPC/CPM YoY | +15% |
What is included in the product
Detailed Word Document
Comprehensive Porter's Five Forces analysis tailored for Vitru, uncovering competitive drivers, buyer and supplier power, substitutes, and entry barriers with data-backed insights and strategic commentary; fully editable in Word for use in business plans, investor materials, and internal strategy decks.
Customizable Excel Spreadsheet
A concise one-sheet Vitru Porter’s Five Forces summary that instantly visualizes competitive pressure with a spider chart and customizable inputs—ready to drop into decks or duplicate for alternative scenarios without any code.
Customers Bargaining Power
Price-sensitive students
Brazilian learners are highly cost-conscious, with about 75% of higher-education enrollments in private institutions driving intense tuition comparisons. Transparent pricing and frequent promotions amplify student bargaining power and churn. Scholarships and installment plans (commonly offered over 12–60 months) narrow price gaps. Strong outcome signaling, such as employability rates, lowers price elasticity by justifying higher fees.
Low switching costs online
Students can switch programs each term with limited sunk costs, keeping customer bargaining power high; the global online education market exceeded $300 billion in 2024, intensifying provider competition. Credit transfer friction and brand prestige create partial stickiness, while superior UX, support, and clear completion pathways raise switching costs. Robust alumni networks and career services further deepen lock-in.
B2B/partner institutions
In 2024 global corporate L&D spend reached an estimated $420 billion, giving institutional buyers scale to negotiate volume discounts typically in the 10–30% range. Concentrated buyers (top 20% of accounts) routinely demand customization and SLAs, driving implementation costs up. Cohort-based programs raise platform utilization by ~15–25% but can compress gross margins by ~5–10%. Multi-year contracts cut churn ~30% and reduce per-seat bargaining power by ~12–20%.
Information-rich choices
Ratings, outcomes data, and social proof raise buyer leverage for Vitru by 2024, with platform analytics showing review-influenced enrollments around 64%, intensifying price and feature negotiations as curricula become easily comparable online. Differentiated certifications and third-party accreditation can command 10-25% price premiums, counterbalancing bargaining power. Transparent outcomes reporting reduces haggling by building trust and shortening sales cycles.
- Ratings drive decisions — 64% influence (2024)
- Comparability increases leverage
- Accreditation = 10-25% premium
- Transparent outcomes cut negotiation time
Financing and payment terms
Access to credit, income-based plans and government aid materially shape affordability, driving buyers to demand flexible terms and low upfront costs; in 2024 many consumers prioritized payment flexibility over price. Partnerships with fintechs meet demand but typically require 15-25% revenue share, while in-house lending or guarantees can restore 5-15% margin at higher credit risk and capital needs.
- Access to credit: primary affordability driver
- Buyer demands: flexible terms, low upfront costs
- Fintech partnerships: 15-25% revenue share
- Own-lending: +5-15% margin, higher risk
Students price-sensitive (~75%); reviews drive 64% enrollments
Students are highly price-sensitive (≈75% private enrollments) and churn-prone due to transparent pricing; reviews drive ~64% of enrollments, boosting bargaining power. Institutional buyers (corporate L&D) negotiate 10–30% discounts as market >$300B (online) and $420B (L&D) in 2024. Accreditation can secure 10–25% premiums; fintech partnerships cost 15–25% revenue share.
| Metric | 2024 |
|---|---|
| Private enrollments | ~75% |
| Review influence | 64% |
| Online market | >$300B |
| Corporate L&D | $420B |
| Accreditation premium | 10–25% |
| Fintech rev share | 15–25% |
What You See Is What You Get
Vitru Porter's Five Forces Analysis
This preview shows the exact document you'll receive immediately after purchase—no surprises or placeholders. It is the full Vitru Porter's Five Forces Analysis, professionally written and formatted for immediate use. Upon payment you’ll get instant access to this identical file, ready to download and apply.
Original: $10.00
-65%$10.00
$3.50Description
From Overview to Strategy Blueprint
Vitru’s Porter’s Five Forces snapshot highlights competitive intensity, supplier and buyer pressures, substitute threats, and barriers to entry in concise terms. It reveals where Vitru holds leverage and where risks concentrate. This brief preview shows patterns—full analysis quantifies force strength and strategic implications. Unlock the complete report for force-by-force ratings, visuals, and actionable strategy recommendations.
Suppliers Bargaining Power
Dependence on LMS/cloud vendors
Core platform reliability and scalability hinge on a few major cloud/LMS vendors: AWS, Azure and GCP held roughly 33%, 23% and 12% of global cloud market in 2024, and the top three LMS vendors cover an estimated majority of higher-ed deployments. Such concentration gives suppliers leverage on pricing and contract terms. Multi-cloud and in-house tooling mitigate vendor lock-in but add ~20–30% operational complexity and cost. Outages or contract changes can directly degrade learner experience and breach SLAs.
Faculty and content creators
Qualified instructors, tutors and SMEs supply core content and teaching capacity; in 2024 niche STEM and AI instructors commanded 20–40% higher rates than generalists, boosting supplier leverage. Digital scale and modular content reduce dependence on any single academic, with platform course reuse lowering per-course labor share by up to 30%. Long-term contracts and in-house studios further cap supplier bargaining power.
Digital marketing channels
Customer acquisition relies on paid search, social, affiliates and marketplace partners; auction platforms exert pricing power—CPC/CPM rose roughly 15% YoY into 2023–24—while Amazon Ads generated $37.7B in 2023. Strong brand equity and top‑3 organic listings capture about two‑thirds of clicks, reducing paid dependence. Performance-driven mixes and owned media (email, apps) materially cut supplier leverage and lower CAC.
Telecom/proctoring/edtech tools
ISPs, remote proctoring, video and assessment tools are specialized supplier inputs for Vitru; switching costs rise from integrations, data privacy and accreditation compliance, locking platforms into providers. The global edtech market is roughly $400B (2024 est.), while proctoring and assessment vendors proliferate, enabling competitive bidding. Bundling and volume commitments often secure discounts and SLAs.
Physical center (polo) partners
For blended compliance and exams, local physical centers supply facilities and proctors, making them critical suppliers; in underserved regions limited partner options have pushed partner fees materially higher (reported premiums up to 20% in 2024), while standardized contracts and multi-partner networks have driven negotiated fee reductions of ~10% on average; investment in owned centers (capex) cuts long-term dependence and variable cost exposure.
- Supplier concentration: regional scarcity can raise fees
- Contract standardization: improves terms ~10%
- Multi-partner networks: increase leverage
- Owned centers: reduces variable costs and reliance
Supplier risk rises with cloud concentration; edtech market $400B
Supplier power is elevated by cloud/LMS concentration (AWS 33%, Azure 23%, GCP 12% in 2024) and high switching/compliance costs; outages or contract shifts can breach SLAs. Niche STEM/AI instructors commanded 20–40% higher rates in 2024, though modular content cuts per-course labor by ~30%. Ad platforms pushed CAC as CPC/CPM grew ~15% YoY (2023–24), while edtech scale (~$400B in 2024) enables bulk discounts and bidding.
| Metric | 2024 |
|---|---|
| Cloud share (top3) | AWS33%/AZ23%/GCP12% |
| Edtech market | $400B |
| Niche instructor premium | 20–40% |
| CPC/CPM YoY | +15% |
What is included in the product
Detailed Word Document
Comprehensive Porter's Five Forces analysis tailored for Vitru, uncovering competitive drivers, buyer and supplier power, substitutes, and entry barriers with data-backed insights and strategic commentary; fully editable in Word for use in business plans, investor materials, and internal strategy decks.
Customizable Excel Spreadsheet
A concise one-sheet Vitru Porter’s Five Forces summary that instantly visualizes competitive pressure with a spider chart and customizable inputs—ready to drop into decks or duplicate for alternative scenarios without any code.
Customers Bargaining Power
Price-sensitive students
Brazilian learners are highly cost-conscious, with about 75% of higher-education enrollments in private institutions driving intense tuition comparisons. Transparent pricing and frequent promotions amplify student bargaining power and churn. Scholarships and installment plans (commonly offered over 12–60 months) narrow price gaps. Strong outcome signaling, such as employability rates, lowers price elasticity by justifying higher fees.
Low switching costs online
Students can switch programs each term with limited sunk costs, keeping customer bargaining power high; the global online education market exceeded $300 billion in 2024, intensifying provider competition. Credit transfer friction and brand prestige create partial stickiness, while superior UX, support, and clear completion pathways raise switching costs. Robust alumni networks and career services further deepen lock-in.
B2B/partner institutions
In 2024 global corporate L&D spend reached an estimated $420 billion, giving institutional buyers scale to negotiate volume discounts typically in the 10–30% range. Concentrated buyers (top 20% of accounts) routinely demand customization and SLAs, driving implementation costs up. Cohort-based programs raise platform utilization by ~15–25% but can compress gross margins by ~5–10%. Multi-year contracts cut churn ~30% and reduce per-seat bargaining power by ~12–20%.
Information-rich choices
Ratings, outcomes data, and social proof raise buyer leverage for Vitru by 2024, with platform analytics showing review-influenced enrollments around 64%, intensifying price and feature negotiations as curricula become easily comparable online. Differentiated certifications and third-party accreditation can command 10-25% price premiums, counterbalancing bargaining power. Transparent outcomes reporting reduces haggling by building trust and shortening sales cycles.
- Ratings drive decisions — 64% influence (2024)
- Comparability increases leverage
- Accreditation = 10-25% premium
- Transparent outcomes cut negotiation time
Financing and payment terms
Access to credit, income-based plans and government aid materially shape affordability, driving buyers to demand flexible terms and low upfront costs; in 2024 many consumers prioritized payment flexibility over price. Partnerships with fintechs meet demand but typically require 15-25% revenue share, while in-house lending or guarantees can restore 5-15% margin at higher credit risk and capital needs.
- Access to credit: primary affordability driver
- Buyer demands: flexible terms, low upfront costs
- Fintech partnerships: 15-25% revenue share
- Own-lending: +5-15% margin, higher risk
Students price-sensitive (~75%); reviews drive 64% enrollments
Students are highly price-sensitive (≈75% private enrollments) and churn-prone due to transparent pricing; reviews drive ~64% of enrollments, boosting bargaining power. Institutional buyers (corporate L&D) negotiate 10–30% discounts as market >$300B (online) and $420B (L&D) in 2024. Accreditation can secure 10–25% premiums; fintech partnerships cost 15–25% revenue share.
| Metric | 2024 |
|---|---|
| Private enrollments | ~75% |
| Review influence | 64% |
| Online market | >$300B |
| Corporate L&D | $420B |
| Accreditation premium | 10–25% |
| Fintech rev share | 15–25% |
What You See Is What You Get
Vitru Porter's Five Forces Analysis
This preview shows the exact document you'll receive immediately after purchase—no surprises or placeholders. It is the full Vitru Porter's Five Forces Analysis, professionally written and formatted for immediate use. Upon payment you’ll get instant access to this identical file, ready to download and apply.











