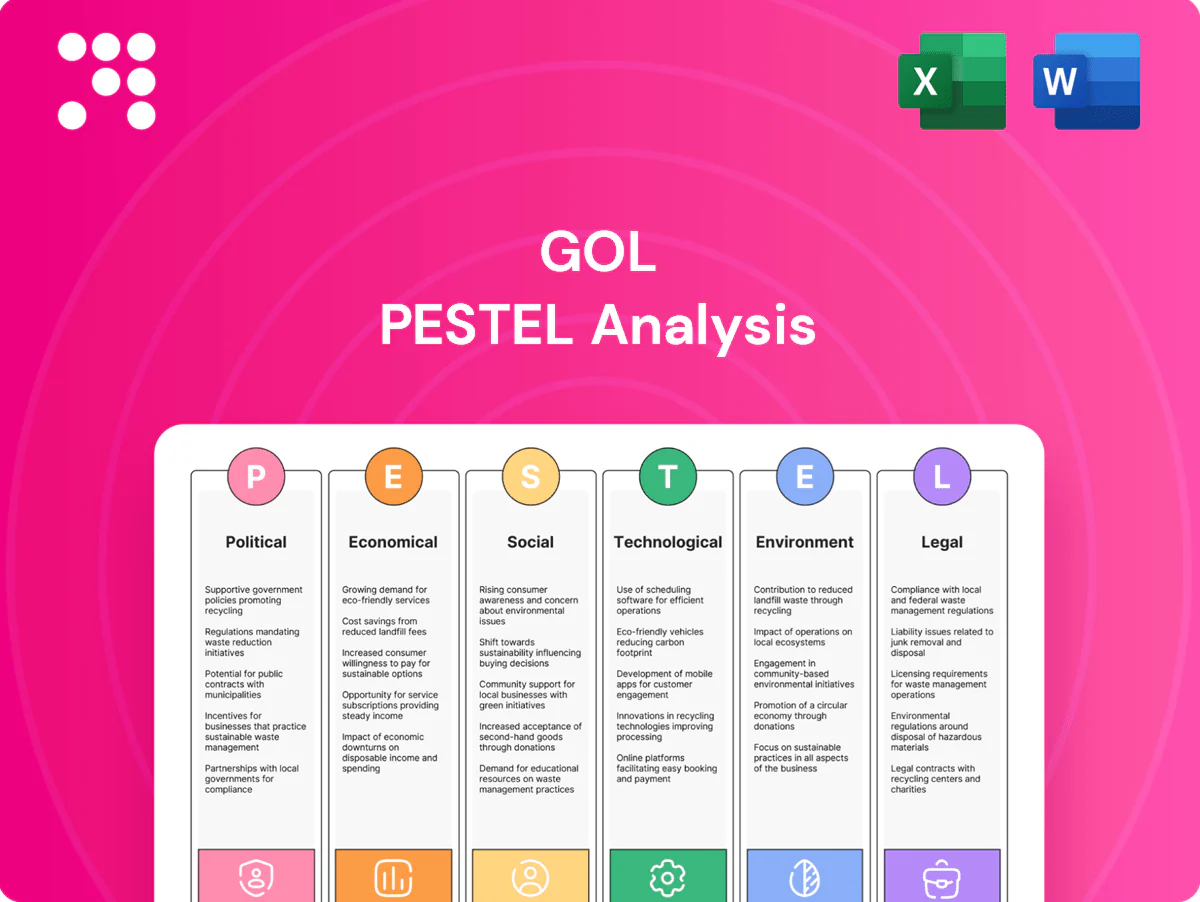
GOL PESTLE Analysis

Make Smarter Strategic Decisions with a Complete PESTEL View
Discover how political, economic, social, technological, legal, and environmental forces are shaping GOL’s strategic outlook in our targeted PESTLE Analysis. This concise briefing highlights key risks and growth levers to inform investor and management decisions. Ready-made and research-backed, it’s ideal for pitches, planning, or due diligence. Purchase the full report for the complete, editable breakdown and actionable recommendations.
Political factors

Brazilian aviation policy and ANAC oversight
Government bodies like ANAC (created 2005) shape slot allocation, route approvals and fare rules, directly affecting GOL’s network flexibility and its 2024 fleet of ~140 aircraft. Shifts in regional connectivity programs can open or restrict markets and routes, altering revenue potential. Stability in ANAC leadership and predictable rulemaking lowers operational uncertainty, while sudden policy changes can quickly change cost structures and service levels.
Airport concessions and infrastructure priorities
Privatization of major airports in Brazil since 2011 has shifted fee-setting and service targets to concessionaires, with contracts typically spanning 25–30 years and tying aeronautical charges to operator investment schedules. Concession clauses therefore shape GOL’s unit costs and capital timing, while politically driven delays to expansions at Congonhas (≈10M pax/yr pre‑pandemic) and Santos Dumont (≈6–8M pax/yr) constrain capacity. These outcomes materially affect GOL’s on‑time performance and growth potential.

Fuel taxation and state-level ICMS variability
State ICMS on jet fuel varies across Brazil, creating route-by-route cost gaps that materially affect unit costs; fuel typically represents about 30% of GOL’s CASK. Political negotiations in 2023–24 yielded several state-level ICMS cuts, improving margins on affected routes. Any reversals or federal harmonization would reshape competitive dynamics, so GOL’s pricing and network decisions must adapt rapidly to shifting tax landscapes.

Bilateral/open-skies agreements in South America
Bilateral air service treaties set frequencies and market access that directly shape route economics for GOL; liberalized deals with neighbors (eg Mercosur partners and Chile) enable network expansion and higher regional ASKs, while protectionist stances cap capacity and block new entrants. Diplomatic shifts therefore convert into measurable changes in load factors and yield on cross-border routes, affecting revenue per available seat kilometer.
- GOL fleet ~140 aircraft — regional growth relies on open-skies
- Liberalization raises ASKs and international revenue share
- Protectionism limits routes, keeping yields higher but volumes lower
Macropolitical stability and election cycles
Policy continuity drives investor confidence, FX stability and demand; Brazil's next general election is scheduled for October 5, 2026, creating cyclical uncertainty that can affect capital costs and booking curves. Election-year delays often defer airport/infrastructure decisions and dampen travel, while labor relations grow more sensitive during political shifts; stable governance aids long-term fleet and route planning for GOL (fleet ≈130 aircraft).
- Investor confidence: policy continuity
- FX & demand: election volatility risk
- Infrastructure: decisions may be deferred
- Labor: heightened sensitivity in political shifts
- Fleet/route: stability supports multi-year planning
ANAC rules, fuel tax swings and airport concessions reshape Brazil carrier capacity before Oct 2026
ANAC (est.2005) controls slot, fare and route rules affecting GOL’s ~140‑aircraft network; regulatory shifts changed costs in 2023–24. State ICMS volatility on jet fuel (fuel ≈30% of CASK) alters route economics. Airport concessions (Congonhas ≈10M pax; Santos Dumont 6–8M) and elections (Oct 5, 2026) drive capacity and investment timing.
| Item | Key figure |
|---|---|
| Fleet | ≈140 |
| Fuel share of CASK | ≈30% |
| Next general election | 5‑Oct‑2026 |
What is included in the product
 Detailed Word Document
Explores how external macro-environmental factors uniquely affect GOL across six dimensions—Political, Economic, Social, Technological, Environmental, and Legal—backed by current data and trends. Designed for executives and investors, it reflects regional market and regulatory dynamics, offers forward-looking insights for scenario planning, and is formatted for direct use in plans, decks, or reports.

 Customizable Excel Spreadsheet
Neatly segmented by PESTLE categories, the GOL PESTLE Analysis delivers a clean, shareable summary that’s easy to drop into presentations or planning sessions, enabling quick alignment across teams and supporting discussions on external risks and market positioning.
Economic factors

GDP growth and demand elasticity
Air travel in Brazil is highly cyclical with GDP; domestic traffic recovered to around 2019 levels by 2022–2023 per ANAC, underscoring sensitivity to macro swings. As a low-cost carrier, GOL benefits from price-sensitive demand during recoveries, but downturns quickly compress yields and load factors. Maintaining strict capacity discipline across cycles is therefore crucial to protect margins and cash flow.
FX exposure: USD costs vs BRL revenues
Aircraft leases, maintenance and fuel for GOL are largely USD‑denominated while revenues are earned in BRL, creating translation and transaction risk; with USD/BRL near 5.1 in mid‑2025 a 10% depreciation of BRL can erode margins materially. GOL hedging policies (covering major fuel and FX exposures) mitigate but do not eliminate volatility. Exchange swings directly affect reported EBIT margins and net leverage through higher BRL debt servicing and lease expense.

Fuel price volatility and hedging
Jet fuel closely tracks Brent crude with regional basis differentials that can widen costs for GOL; fuel historically represents roughly 25–35% of airline operating expenses, so spikes compress margins unless fares reprice fast. Hedge programs seek downside protection while preserving liquidity, often layering collars and swaps to avoid cash strain. Operational efficiencies and fleet renewal with NG/LEAP-equipped aircraft materially reduce fuel burn per ASK, partially offsetting shocks.

Interest rates, inflation, and leverage
High domestic rates lift fleet and working-capital financing costs for GOL as global policy rates remained elevated (US fed funds ~5.25–5.50% mid‑2024/early‑2025), while inflationary pressure in Brazil raised wages, airport fees and supplier contracts; rising-rate debt service limits capex and network growth, making strong cash flow and timely refinancing windows pivotal.
- Higher rates: increases financing costs
- Inflation: pressures wages/fees
- Debt service: constrains growth
- Need: strong cash flow + refinancing
Cargo and ancillary revenue resilience
E-commerce growth in Brazil rose about 11% in 2024 (Ebit/NielsenIQ), bolstering belly cargo yields on domestic routes and improving unit revenue per ASK. GOL reported ancillaries—baggage, seat selection and loyalty—contributed roughly 20% of passenger revenue in 2024, stabilizing unit revenue and cushioning demand dips via mix shift. Optimized product bundles sustain low-fare competitiveness while protecting margins.
- e‑commerce +11% (2024)
- Ancillaries ~20% of passenger revenue (2024)
- Mix shift cushions demand volatility
- Product bundles preserve low‑fare margins
ANAC rules, fuel tax swings and airport concessions reshape Brazil carrier capacity before Oct 2026
Air travel in Brazil is cyclical; domestic traffic recovered to ~2019 levels by 2023, making capacity discipline vital. GOL faces USD‑denominated costs vs BRL revenues (USD/BRL ~5.1 mid‑2025); fuel ~25–35% of costs and ancillaries ~20% of passenger revenue (2024). Elevated rates (US fed ~5.25–5.50%) and inflation raise financing and operating costs.
| Metric | Value |
|---|---|
| USD/BRL | ~5.1 (mid‑2025) |
| Fuel % Opex | 25–35% |
| Ancillaries | ~20% (2024) |
| E‑commerce growth | +11% (2024) |
Preview Before You Purchase
GOL PESTLE Analysis
The preview of the GOL PESTLE Analysis shown here is the exact document you’ll receive after purchase — fully formatted, professionally structured, and ready to use. The content, layout, and insights visible in this sample are identical to the downloadable file delivered upon payment. No placeholders or teasers: what you see is what you’ll own immediately after checkout.

Make Smarter Strategic Decisions with a Complete PESTEL View
Discover how political, economic, social, technological, legal, and environmental forces are shaping GOL’s strategic outlook in our targeted PESTLE Analysis. This concise briefing highlights key risks and growth levers to inform investor and management decisions. Ready-made and research-backed, it’s ideal for pitches, planning, or due diligence. Purchase the full report for the complete, editable breakdown and actionable recommendations.
Political factors
Brazilian aviation policy and ANAC oversight
Government bodies like ANAC (created 2005) shape slot allocation, route approvals and fare rules, directly affecting GOL’s network flexibility and its 2024 fleet of ~140 aircraft. Shifts in regional connectivity programs can open or restrict markets and routes, altering revenue potential. Stability in ANAC leadership and predictable rulemaking lowers operational uncertainty, while sudden policy changes can quickly change cost structures and service levels.
Airport concessions and infrastructure priorities
Privatization of major airports in Brazil since 2011 has shifted fee-setting and service targets to concessionaires, with contracts typically spanning 25–30 years and tying aeronautical charges to operator investment schedules. Concession clauses therefore shape GOL’s unit costs and capital timing, while politically driven delays to expansions at Congonhas (≈10M pax/yr pre‑pandemic) and Santos Dumont (≈6–8M pax/yr) constrain capacity. These outcomes materially affect GOL’s on‑time performance and growth potential.
Fuel taxation and state-level ICMS variability
State ICMS on jet fuel varies across Brazil, creating route-by-route cost gaps that materially affect unit costs; fuel typically represents about 30% of GOL’s CASK. Political negotiations in 2023–24 yielded several state-level ICMS cuts, improving margins on affected routes. Any reversals or federal harmonization would reshape competitive dynamics, so GOL’s pricing and network decisions must adapt rapidly to shifting tax landscapes.
Bilateral/open-skies agreements in South America
Bilateral air service treaties set frequencies and market access that directly shape route economics for GOL; liberalized deals with neighbors (eg Mercosur partners and Chile) enable network expansion and higher regional ASKs, while protectionist stances cap capacity and block new entrants. Diplomatic shifts therefore convert into measurable changes in load factors and yield on cross-border routes, affecting revenue per available seat kilometer.
- GOL fleet ~140 aircraft — regional growth relies on open-skies
- Liberalization raises ASKs and international revenue share
- Protectionism limits routes, keeping yields higher but volumes lower
Macropolitical stability and election cycles
Policy continuity drives investor confidence, FX stability and demand; Brazil's next general election is scheduled for October 5, 2026, creating cyclical uncertainty that can affect capital costs and booking curves. Election-year delays often defer airport/infrastructure decisions and dampen travel, while labor relations grow more sensitive during political shifts; stable governance aids long-term fleet and route planning for GOL (fleet ≈130 aircraft).
- Investor confidence: policy continuity
- FX & demand: election volatility risk
- Infrastructure: decisions may be deferred
- Labor: heightened sensitivity in political shifts
- Fleet/route: stability supports multi-year planning
ANAC rules, fuel tax swings and airport concessions reshape Brazil carrier capacity before Oct 2026
ANAC (est.2005) controls slot, fare and route rules affecting GOL’s ~140‑aircraft network; regulatory shifts changed costs in 2023–24. State ICMS volatility on jet fuel (fuel ≈30% of CASK) alters route economics. Airport concessions (Congonhas ≈10M pax; Santos Dumont 6–8M) and elections (Oct 5, 2026) drive capacity and investment timing.
| Item | Key figure |
|---|---|
| Fleet | ≈140 |
| Fuel share of CASK | ≈30% |
| Next general election | 5‑Oct‑2026 |
What is included in the product
Detailed Word Document
Explores how external macro-environmental factors uniquely affect GOL across six dimensions—Political, Economic, Social, Technological, Environmental, and Legal—backed by current data and trends. Designed for executives and investors, it reflects regional market and regulatory dynamics, offers forward-looking insights for scenario planning, and is formatted for direct use in plans, decks, or reports.
Customizable Excel Spreadsheet
Neatly segmented by PESTLE categories, the GOL PESTLE Analysis delivers a clean, shareable summary that’s easy to drop into presentations or planning sessions, enabling quick alignment across teams and supporting discussions on external risks and market positioning.
Economic factors
GDP growth and demand elasticity
Air travel in Brazil is highly cyclical with GDP; domestic traffic recovered to around 2019 levels by 2022–2023 per ANAC, underscoring sensitivity to macro swings. As a low-cost carrier, GOL benefits from price-sensitive demand during recoveries, but downturns quickly compress yields and load factors. Maintaining strict capacity discipline across cycles is therefore crucial to protect margins and cash flow.
FX exposure: USD costs vs BRL revenues
Aircraft leases, maintenance and fuel for GOL are largely USD‑denominated while revenues are earned in BRL, creating translation and transaction risk; with USD/BRL near 5.1 in mid‑2025 a 10% depreciation of BRL can erode margins materially. GOL hedging policies (covering major fuel and FX exposures) mitigate but do not eliminate volatility. Exchange swings directly affect reported EBIT margins and net leverage through higher BRL debt servicing and lease expense.
Fuel price volatility and hedging
Jet fuel closely tracks Brent crude with regional basis differentials that can widen costs for GOL; fuel historically represents roughly 25–35% of airline operating expenses, so spikes compress margins unless fares reprice fast. Hedge programs seek downside protection while preserving liquidity, often layering collars and swaps to avoid cash strain. Operational efficiencies and fleet renewal with NG/LEAP-equipped aircraft materially reduce fuel burn per ASK, partially offsetting shocks.
Interest rates, inflation, and leverage
High domestic rates lift fleet and working-capital financing costs for GOL as global policy rates remained elevated (US fed funds ~5.25–5.50% mid‑2024/early‑2025), while inflationary pressure in Brazil raised wages, airport fees and supplier contracts; rising-rate debt service limits capex and network growth, making strong cash flow and timely refinancing windows pivotal.
- Higher rates: increases financing costs
- Inflation: pressures wages/fees
- Debt service: constrains growth
- Need: strong cash flow + refinancing
Cargo and ancillary revenue resilience
E-commerce growth in Brazil rose about 11% in 2024 (Ebit/NielsenIQ), bolstering belly cargo yields on domestic routes and improving unit revenue per ASK. GOL reported ancillaries—baggage, seat selection and loyalty—contributed roughly 20% of passenger revenue in 2024, stabilizing unit revenue and cushioning demand dips via mix shift. Optimized product bundles sustain low-fare competitiveness while protecting margins.
- e‑commerce +11% (2024)
- Ancillaries ~20% of passenger revenue (2024)
- Mix shift cushions demand volatility
- Product bundles preserve low‑fare margins
ANAC rules, fuel tax swings and airport concessions reshape Brazil carrier capacity before Oct 2026
Air travel in Brazil is cyclical; domestic traffic recovered to ~2019 levels by 2023, making capacity discipline vital. GOL faces USD‑denominated costs vs BRL revenues (USD/BRL ~5.1 mid‑2025); fuel ~25–35% of costs and ancillaries ~20% of passenger revenue (2024). Elevated rates (US fed ~5.25–5.50%) and inflation raise financing and operating costs.
| Metric | Value |
|---|---|
| USD/BRL | ~5.1 (mid‑2025) |
| Fuel % Opex | 25–35% |
| Ancillaries | ~20% (2024) |
| E‑commerce growth | +11% (2024) |
Preview Before You Purchase
GOL PESTLE Analysis
The preview of the GOL PESTLE Analysis shown here is the exact document you’ll receive after purchase — fully formatted, professionally structured, and ready to use. The content, layout, and insights visible in this sample are identical to the downloadable file delivered upon payment. No placeholders or teasers: what you see is what you’ll own immediately after checkout.
Description
Make Smarter Strategic Decisions with a Complete PESTEL View
Discover how political, economic, social, technological, legal, and environmental forces are shaping GOL’s strategic outlook in our targeted PESTLE Analysis. This concise briefing highlights key risks and growth levers to inform investor and management decisions. Ready-made and research-backed, it’s ideal for pitches, planning, or due diligence. Purchase the full report for the complete, editable breakdown and actionable recommendations.
Political factors
Brazilian aviation policy and ANAC oversight
Government bodies like ANAC (created 2005) shape slot allocation, route approvals and fare rules, directly affecting GOL’s network flexibility and its 2024 fleet of ~140 aircraft. Shifts in regional connectivity programs can open or restrict markets and routes, altering revenue potential. Stability in ANAC leadership and predictable rulemaking lowers operational uncertainty, while sudden policy changes can quickly change cost structures and service levels.
Airport concessions and infrastructure priorities
Privatization of major airports in Brazil since 2011 has shifted fee-setting and service targets to concessionaires, with contracts typically spanning 25–30 years and tying aeronautical charges to operator investment schedules. Concession clauses therefore shape GOL’s unit costs and capital timing, while politically driven delays to expansions at Congonhas (≈10M pax/yr pre‑pandemic) and Santos Dumont (≈6–8M pax/yr) constrain capacity. These outcomes materially affect GOL’s on‑time performance and growth potential.
Fuel taxation and state-level ICMS variability
State ICMS on jet fuel varies across Brazil, creating route-by-route cost gaps that materially affect unit costs; fuel typically represents about 30% of GOL’s CASK. Political negotiations in 2023–24 yielded several state-level ICMS cuts, improving margins on affected routes. Any reversals or federal harmonization would reshape competitive dynamics, so GOL’s pricing and network decisions must adapt rapidly to shifting tax landscapes.
Bilateral/open-skies agreements in South America
Bilateral air service treaties set frequencies and market access that directly shape route economics for GOL; liberalized deals with neighbors (eg Mercosur partners and Chile) enable network expansion and higher regional ASKs, while protectionist stances cap capacity and block new entrants. Diplomatic shifts therefore convert into measurable changes in load factors and yield on cross-border routes, affecting revenue per available seat kilometer.
- GOL fleet ~140 aircraft — regional growth relies on open-skies
- Liberalization raises ASKs and international revenue share
- Protectionism limits routes, keeping yields higher but volumes lower
Macropolitical stability and election cycles
Policy continuity drives investor confidence, FX stability and demand; Brazil's next general election is scheduled for October 5, 2026, creating cyclical uncertainty that can affect capital costs and booking curves. Election-year delays often defer airport/infrastructure decisions and dampen travel, while labor relations grow more sensitive during political shifts; stable governance aids long-term fleet and route planning for GOL (fleet ≈130 aircraft).
- Investor confidence: policy continuity
- FX & demand: election volatility risk
- Infrastructure: decisions may be deferred
- Labor: heightened sensitivity in political shifts
- Fleet/route: stability supports multi-year planning
ANAC rules, fuel tax swings and airport concessions reshape Brazil carrier capacity before Oct 2026
ANAC (est.2005) controls slot, fare and route rules affecting GOL’s ~140‑aircraft network; regulatory shifts changed costs in 2023–24. State ICMS volatility on jet fuel (fuel ≈30% of CASK) alters route economics. Airport concessions (Congonhas ≈10M pax; Santos Dumont 6–8M) and elections (Oct 5, 2026) drive capacity and investment timing.
| Item | Key figure |
|---|---|
| Fleet | ≈140 |
| Fuel share of CASK | ≈30% |
| Next general election | 5‑Oct‑2026 |
What is included in the product
Detailed Word Document
Explores how external macro-environmental factors uniquely affect GOL across six dimensions—Political, Economic, Social, Technological, Environmental, and Legal—backed by current data and trends. Designed for executives and investors, it reflects regional market and regulatory dynamics, offers forward-looking insights for scenario planning, and is formatted for direct use in plans, decks, or reports.
Customizable Excel Spreadsheet
Neatly segmented by PESTLE categories, the GOL PESTLE Analysis delivers a clean, shareable summary that’s easy to drop into presentations or planning sessions, enabling quick alignment across teams and supporting discussions on external risks and market positioning.
Economic factors
GDP growth and demand elasticity
Air travel in Brazil is highly cyclical with GDP; domestic traffic recovered to around 2019 levels by 2022–2023 per ANAC, underscoring sensitivity to macro swings. As a low-cost carrier, GOL benefits from price-sensitive demand during recoveries, but downturns quickly compress yields and load factors. Maintaining strict capacity discipline across cycles is therefore crucial to protect margins and cash flow.
FX exposure: USD costs vs BRL revenues
Aircraft leases, maintenance and fuel for GOL are largely USD‑denominated while revenues are earned in BRL, creating translation and transaction risk; with USD/BRL near 5.1 in mid‑2025 a 10% depreciation of BRL can erode margins materially. GOL hedging policies (covering major fuel and FX exposures) mitigate but do not eliminate volatility. Exchange swings directly affect reported EBIT margins and net leverage through higher BRL debt servicing and lease expense.
Fuel price volatility and hedging
Jet fuel closely tracks Brent crude with regional basis differentials that can widen costs for GOL; fuel historically represents roughly 25–35% of airline operating expenses, so spikes compress margins unless fares reprice fast. Hedge programs seek downside protection while preserving liquidity, often layering collars and swaps to avoid cash strain. Operational efficiencies and fleet renewal with NG/LEAP-equipped aircraft materially reduce fuel burn per ASK, partially offsetting shocks.
Interest rates, inflation, and leverage
High domestic rates lift fleet and working-capital financing costs for GOL as global policy rates remained elevated (US fed funds ~5.25–5.50% mid‑2024/early‑2025), while inflationary pressure in Brazil raised wages, airport fees and supplier contracts; rising-rate debt service limits capex and network growth, making strong cash flow and timely refinancing windows pivotal.
- Higher rates: increases financing costs
- Inflation: pressures wages/fees
- Debt service: constrains growth
- Need: strong cash flow + refinancing
Cargo and ancillary revenue resilience
E-commerce growth in Brazil rose about 11% in 2024 (Ebit/NielsenIQ), bolstering belly cargo yields on domestic routes and improving unit revenue per ASK. GOL reported ancillaries—baggage, seat selection and loyalty—contributed roughly 20% of passenger revenue in 2024, stabilizing unit revenue and cushioning demand dips via mix shift. Optimized product bundles sustain low-fare competitiveness while protecting margins.
- e‑commerce +11% (2024)
- Ancillaries ~20% of passenger revenue (2024)
- Mix shift cushions demand volatility
- Product bundles preserve low‑fare margins
ANAC rules, fuel tax swings and airport concessions reshape Brazil carrier capacity before Oct 2026
Air travel in Brazil is cyclical; domestic traffic recovered to ~2019 levels by 2023, making capacity discipline vital. GOL faces USD‑denominated costs vs BRL revenues (USD/BRL ~5.1 mid‑2025); fuel ~25–35% of costs and ancillaries ~20% of passenger revenue (2024). Elevated rates (US fed ~5.25–5.50%) and inflation raise financing and operating costs.
| Metric | Value |
|---|---|
| USD/BRL | ~5.1 (mid‑2025) |
| Fuel % Opex | 25–35% |
| Ancillaries | ~20% (2024) |
| E‑commerce growth | +11% (2024) |
Preview Before You Purchase
GOL PESTLE Analysis
The preview of the GOL PESTLE Analysis shown here is the exact document you’ll receive after purchase — fully formatted, professionally structured, and ready to use. The content, layout, and insights visible in this sample are identical to the downloadable file delivered upon payment. No placeholders or teasers: what you see is what you’ll own immediately after checkout.











