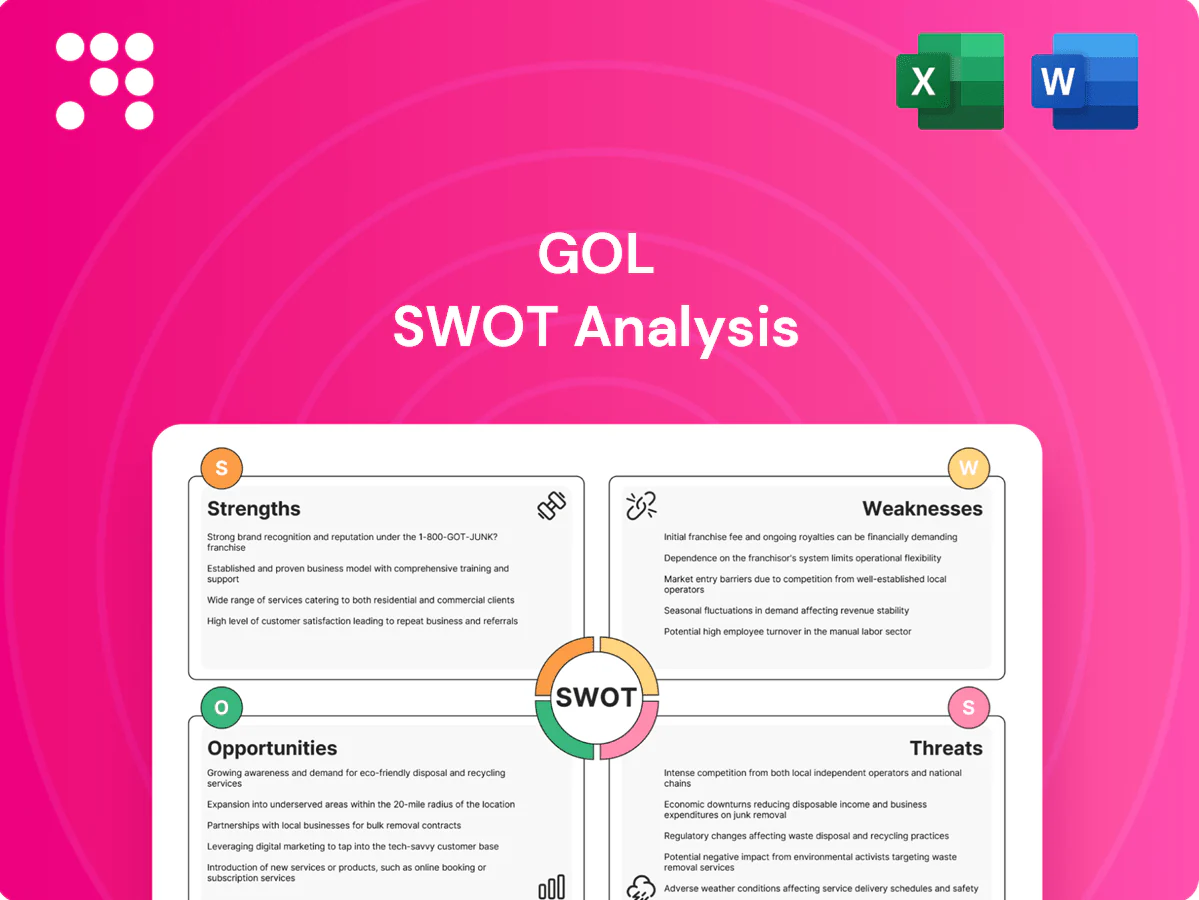
GOL SWOT Analysis

Dive Deeper Into the Company’s Strategic Blueprint
GOL’s strong domestic market position and lean cost base contrast with high leverage and fleet concentration, while rising Brazilian travel demand and potential alliance expansion offer growth paths; volatility in jet fuel, currency swings, and intense low-cost competition are key threats. Purchase the full SWOT analysis for a research-backed, editable Word + Excel package to plan, pitch, or invest with confidence.
Strengths

Low-cost carrier model
GOLs low-cost carrier model—built on lean operations and high aircraft utilization (fleet ~140 Boeing 737s)—enables simplified services and competitive pricing that attracts price-sensitive travelers across Brazil and the region. Cost discipline and load factors around 82% in 2024 allow flexible route adjustments and optimized yields. The model supports rapid demand recovery as macro conditions improve, seen in revenue passenger growth in 2024.
Strong domestic network in Brazil
GOL captures large share on Brazil trunk routes, leveraging a 130+ Boeing 737 fleet and service to over 70 domestic destinations to provide dense frequencies on key city pairs. High frequency supports business and leisure convenience, driving repeat bookings and loyalty accrual. Network depth also boosts cargo uplift and partner connectivity across domestic feed and international interlines.

Loyalty program and partnerships
Smiles loyalty program drives repeat purchases and ancillary revenue by converting flights into a cash-generating retail-like business, and partnerships and interline/codeshare deals extend GOLs network beyond its own metal. Miles issuance creates commercial stickiness with banks and retail partners, making miles a monetizable asset and an adjustable cash-flow lever through segment sales and corporate agreements.

Fleet commonality and operational efficiency
Concentrated Boeing 737 family simplifies training, maintenance and crew scheduling for GOL, reducing complexity across operations. Standardization lowers unit costs and improves utilization, supporting GOL’s all-737 fleet (over 130 aircraft reported in 2024) and easing deployment across variable demand patterns. This operational efficiency underpins strong on-time performance and customer satisfaction metrics.
- All-737 fleet: >130 aircraft (2024)
- Lower maintenance & training complexity
- Higher aircraft utilization and flexible redeployment
- Improved on-time performance and passenger experience
Cargo and ancillary revenue streams
Belly cargo provides yield diversity across GOLs domestic and regional routes, reducing dependence on base fares and smoothing revenue during demand swings. Ancillaries—paid seat selection, baggage fees and onboard sales—boost unit margins and scale with network growth without large capital outlay.
- Belly cargo: revenue diversity
- Ancillaries: higher margins
- Cushions fare volatility
- Scales with route expansion
Low-cost all-737 carrier - high utilization, ~82% load factor and 70+ domestic routes
GOL’s low-cost model and lean ops with an all-Boeing 737 fleet (>130 aircraft in 2024) drive competitive fares and high utilization. Load factor ~82% in 2024 supports yield optimization and rapid demand recovery. Dense domestic network (70+ destinations) and Smiles loyalty monetize repeat sales and partner channels, diversifying revenue via ancillaries and belly cargo.
| Metric | Value | Year |
|---|---|---|
| Fleet (B737) | >130 | 2024 |
| Load factor | ~82% | 2024 |
| Domestic destinations | 70+ | 2024 |
What is included in the product
 Detailed Word Document
Provides a concise SWOT analysis of GOL, highlighting its operational strengths and cost advantages, internal weaknesses such as fleet and liquidity constraints, external opportunities from Latin American travel recovery and ancillary revenue expansion, and threats including fuel price volatility, intense competition, and macroeconomic instability.

 Customizable Excel Spreadsheet
Provides a clear SWOT matrix tailored to GOL for rapid identification of strategic risks and opportunities, enabling executives to prioritize turnaround actions; editable and presentation-ready for fast stakeholder alignment.
Weaknesses

High exposure to Brazilian macroeconomy
GOL’s revenue and demand remain tightly linked to Brazil’s macrocycle, with over 80% of capacity domestic in 2024, so passenger volumes track Brazil’s GDP and consumer confidence. Currency volatility in 2024 amplified cost and fare pressure as BRL swings raised USD-denominated fuel and lease costs. Domestic shocks can quickly compress yields and load factors, and international diversification remains limited.
Fuel and FX sensitivity
Jet fuel is dollar-denominated while a large share of GOLs revenue is in BRL, creating a currency mismatch that raises FX exposure; USD-denominated debt and costs amplify this sensitivity. FX swings inflate CASK and debt servicing, and although hedging reduces risk it cannot eliminate volatility. 2022 oil spikes (Brent ~120 USD/bbl) showed how price jumps rapidly compress margins in competitive markets.

Balance sheet leverage
Airlines carry large lease and financial obligations and GOL is no exception: with a fleet of roughly 140 aircraft, rental and debt service make up a material portion of fixed costs. Elevated leverage limits strategic flexibility, interest and lease expenses compress margins in downturns, and refinancing risk rises sharply when capital markets tighten.

Operational concentration at key hubs
Operational concentration at major Brazilian hubs, notably São Paulo Guarulhos (about 44 million passengers in 2024) and Rio Galeão, exposes GOL to slot limits and severe congestion; delays or closures cascade through its point-to-point network and depress on-time performance. Airport fee and tariff inflation in 2024-25 has pressure on CASK, and limited alternate infrastructure reduces redundancy during disruptions.
- Slot/congestion risk
- Cascade delays hurt punctuality
- Airport cost inflation → higher unit costs
- Low infrastructure redundancy
Competitive intensity in LCC and legacy space
Rivals such as LATAM and Azul compete aggressively on price and frequency across Brazil and nearby markets, while legacy carriers leverage loyalty programs and corporate contracts to protect share; new entrants and ULCC models (e.g., JetSMART expansion) pressure yields and market pricing, contributing to promotional warfare that has weighed on unit revenue recovery in 2024–25.
- Price/frequency competition
- Legacy loyalty/corporate defenses
- ULCC/new entrant yield pressure
- Promotional fare-driven unit revenue weakness
Brazilian carrier: >80% domestic capacity, FX and fuel shock exposure
GOL’s revenue and demand track Brazil’s cycle—domestic capacity >80% in 2024—concentrating volume risk and yield sensitivity. Dollar-denominated jet fuel and leases versus BRL revenue create FX exposure; 2022 Brent spiked to ~120 USD/bbl highlighting margin vulnerability. High fixed lease/debt with ~140-aircraft fleet limits flexibility and congestion at Guarulhos (≈44m pax 2024) amplifies disruption risk.
| Metric | Value |
|---|---|
| Domestic capacity | >80% (2024) |
| Fleet size | ~140 |
| Guarulhos passengers | ≈44m (2024) |
| Brent peak | ~120 USD/bbl (2022) |
Preview the Actual Deliverable
GOL SWOT Analysis
This is the actual GOL SWOT analysis document you’ll receive upon purchase—no surprises, just professional quality. The preview below is taken directly from the full SWOT report you'll get, and purchase unlocks the complete, editable version. You’re viewing a live preview of the real file; the full, detailed report becomes available after checkout.

Dive Deeper Into the Company’s Strategic Blueprint
GOL’s strong domestic market position and lean cost base contrast with high leverage and fleet concentration, while rising Brazilian travel demand and potential alliance expansion offer growth paths; volatility in jet fuel, currency swings, and intense low-cost competition are key threats. Purchase the full SWOT analysis for a research-backed, editable Word + Excel package to plan, pitch, or invest with confidence.
Strengths
Low-cost carrier model
GOLs low-cost carrier model—built on lean operations and high aircraft utilization (fleet ~140 Boeing 737s)—enables simplified services and competitive pricing that attracts price-sensitive travelers across Brazil and the region. Cost discipline and load factors around 82% in 2024 allow flexible route adjustments and optimized yields. The model supports rapid demand recovery as macro conditions improve, seen in revenue passenger growth in 2024.
Strong domestic network in Brazil
GOL captures large share on Brazil trunk routes, leveraging a 130+ Boeing 737 fleet and service to over 70 domestic destinations to provide dense frequencies on key city pairs. High frequency supports business and leisure convenience, driving repeat bookings and loyalty accrual. Network depth also boosts cargo uplift and partner connectivity across domestic feed and international interlines.
Loyalty program and partnerships
Smiles loyalty program drives repeat purchases and ancillary revenue by converting flights into a cash-generating retail-like business, and partnerships and interline/codeshare deals extend GOLs network beyond its own metal. Miles issuance creates commercial stickiness with banks and retail partners, making miles a monetizable asset and an adjustable cash-flow lever through segment sales and corporate agreements.
Fleet commonality and operational efficiency
Concentrated Boeing 737 family simplifies training, maintenance and crew scheduling for GOL, reducing complexity across operations. Standardization lowers unit costs and improves utilization, supporting GOL’s all-737 fleet (over 130 aircraft reported in 2024) and easing deployment across variable demand patterns. This operational efficiency underpins strong on-time performance and customer satisfaction metrics.
- All-737 fleet: >130 aircraft (2024)
- Lower maintenance & training complexity
- Higher aircraft utilization and flexible redeployment
- Improved on-time performance and passenger experience
Cargo and ancillary revenue streams
Belly cargo provides yield diversity across GOLs domestic and regional routes, reducing dependence on base fares and smoothing revenue during demand swings. Ancillaries—paid seat selection, baggage fees and onboard sales—boost unit margins and scale with network growth without large capital outlay.
- Belly cargo: revenue diversity
- Ancillaries: higher margins
- Cushions fare volatility
- Scales with route expansion
Low-cost all-737 carrier - high utilization, ~82% load factor and 70+ domestic routes
GOL’s low-cost model and lean ops with an all-Boeing 737 fleet (>130 aircraft in 2024) drive competitive fares and high utilization. Load factor ~82% in 2024 supports yield optimization and rapid demand recovery. Dense domestic network (70+ destinations) and Smiles loyalty monetize repeat sales and partner channels, diversifying revenue via ancillaries and belly cargo.
| Metric | Value | Year |
|---|---|---|
| Fleet (B737) | >130 | 2024 |
| Load factor | ~82% | 2024 |
| Domestic destinations | 70+ | 2024 |
What is included in the product
Detailed Word Document
Provides a concise SWOT analysis of GOL, highlighting its operational strengths and cost advantages, internal weaknesses such as fleet and liquidity constraints, external opportunities from Latin American travel recovery and ancillary revenue expansion, and threats including fuel price volatility, intense competition, and macroeconomic instability.
Customizable Excel Spreadsheet
Provides a clear SWOT matrix tailored to GOL for rapid identification of strategic risks and opportunities, enabling executives to prioritize turnaround actions; editable and presentation-ready for fast stakeholder alignment.
Weaknesses
High exposure to Brazilian macroeconomy
GOL’s revenue and demand remain tightly linked to Brazil’s macrocycle, with over 80% of capacity domestic in 2024, so passenger volumes track Brazil’s GDP and consumer confidence. Currency volatility in 2024 amplified cost and fare pressure as BRL swings raised USD-denominated fuel and lease costs. Domestic shocks can quickly compress yields and load factors, and international diversification remains limited.
Fuel and FX sensitivity
Jet fuel is dollar-denominated while a large share of GOLs revenue is in BRL, creating a currency mismatch that raises FX exposure; USD-denominated debt and costs amplify this sensitivity. FX swings inflate CASK and debt servicing, and although hedging reduces risk it cannot eliminate volatility. 2022 oil spikes (Brent ~120 USD/bbl) showed how price jumps rapidly compress margins in competitive markets.
Balance sheet leverage
Airlines carry large lease and financial obligations and GOL is no exception: with a fleet of roughly 140 aircraft, rental and debt service make up a material portion of fixed costs. Elevated leverage limits strategic flexibility, interest and lease expenses compress margins in downturns, and refinancing risk rises sharply when capital markets tighten.
Operational concentration at key hubs
Operational concentration at major Brazilian hubs, notably São Paulo Guarulhos (about 44 million passengers in 2024) and Rio Galeão, exposes GOL to slot limits and severe congestion; delays or closures cascade through its point-to-point network and depress on-time performance. Airport fee and tariff inflation in 2024-25 has pressure on CASK, and limited alternate infrastructure reduces redundancy during disruptions.
- Slot/congestion risk
- Cascade delays hurt punctuality
- Airport cost inflation → higher unit costs
- Low infrastructure redundancy
Competitive intensity in LCC and legacy space
Rivals such as LATAM and Azul compete aggressively on price and frequency across Brazil and nearby markets, while legacy carriers leverage loyalty programs and corporate contracts to protect share; new entrants and ULCC models (e.g., JetSMART expansion) pressure yields and market pricing, contributing to promotional warfare that has weighed on unit revenue recovery in 2024–25.
- Price/frequency competition
- Legacy loyalty/corporate defenses
- ULCC/new entrant yield pressure
- Promotional fare-driven unit revenue weakness
Brazilian carrier: >80% domestic capacity, FX and fuel shock exposure
GOL’s revenue and demand track Brazil’s cycle—domestic capacity >80% in 2024—concentrating volume risk and yield sensitivity. Dollar-denominated jet fuel and leases versus BRL revenue create FX exposure; 2022 Brent spiked to ~120 USD/bbl highlighting margin vulnerability. High fixed lease/debt with ~140-aircraft fleet limits flexibility and congestion at Guarulhos (≈44m pax 2024) amplifies disruption risk.
| Metric | Value |
|---|---|
| Domestic capacity | >80% (2024) |
| Fleet size | ~140 |
| Guarulhos passengers | ≈44m (2024) |
| Brent peak | ~120 USD/bbl (2022) |
Preview the Actual Deliverable
GOL SWOT Analysis
This is the actual GOL SWOT analysis document you’ll receive upon purchase—no surprises, just professional quality. The preview below is taken directly from the full SWOT report you'll get, and purchase unlocks the complete, editable version. You’re viewing a live preview of the real file; the full, detailed report becomes available after checkout.
Original: $10.00
-65%$10.00
$3.50Description
Dive Deeper Into the Company’s Strategic Blueprint
GOL’s strong domestic market position and lean cost base contrast with high leverage and fleet concentration, while rising Brazilian travel demand and potential alliance expansion offer growth paths; volatility in jet fuel, currency swings, and intense low-cost competition are key threats. Purchase the full SWOT analysis for a research-backed, editable Word + Excel package to plan, pitch, or invest with confidence.
Strengths
Low-cost carrier model
GOLs low-cost carrier model—built on lean operations and high aircraft utilization (fleet ~140 Boeing 737s)—enables simplified services and competitive pricing that attracts price-sensitive travelers across Brazil and the region. Cost discipline and load factors around 82% in 2024 allow flexible route adjustments and optimized yields. The model supports rapid demand recovery as macro conditions improve, seen in revenue passenger growth in 2024.
Strong domestic network in Brazil
GOL captures large share on Brazil trunk routes, leveraging a 130+ Boeing 737 fleet and service to over 70 domestic destinations to provide dense frequencies on key city pairs. High frequency supports business and leisure convenience, driving repeat bookings and loyalty accrual. Network depth also boosts cargo uplift and partner connectivity across domestic feed and international interlines.
Loyalty program and partnerships
Smiles loyalty program drives repeat purchases and ancillary revenue by converting flights into a cash-generating retail-like business, and partnerships and interline/codeshare deals extend GOLs network beyond its own metal. Miles issuance creates commercial stickiness with banks and retail partners, making miles a monetizable asset and an adjustable cash-flow lever through segment sales and corporate agreements.
Fleet commonality and operational efficiency
Concentrated Boeing 737 family simplifies training, maintenance and crew scheduling for GOL, reducing complexity across operations. Standardization lowers unit costs and improves utilization, supporting GOL’s all-737 fleet (over 130 aircraft reported in 2024) and easing deployment across variable demand patterns. This operational efficiency underpins strong on-time performance and customer satisfaction metrics.
- All-737 fleet: >130 aircraft (2024)
- Lower maintenance & training complexity
- Higher aircraft utilization and flexible redeployment
- Improved on-time performance and passenger experience
Cargo and ancillary revenue streams
Belly cargo provides yield diversity across GOLs domestic and regional routes, reducing dependence on base fares and smoothing revenue during demand swings. Ancillaries—paid seat selection, baggage fees and onboard sales—boost unit margins and scale with network growth without large capital outlay.
- Belly cargo: revenue diversity
- Ancillaries: higher margins
- Cushions fare volatility
- Scales with route expansion
Low-cost all-737 carrier - high utilization, ~82% load factor and 70+ domestic routes
GOL’s low-cost model and lean ops with an all-Boeing 737 fleet (>130 aircraft in 2024) drive competitive fares and high utilization. Load factor ~82% in 2024 supports yield optimization and rapid demand recovery. Dense domestic network (70+ destinations) and Smiles loyalty monetize repeat sales and partner channels, diversifying revenue via ancillaries and belly cargo.
| Metric | Value | Year |
|---|---|---|
| Fleet (B737) | >130 | 2024 |
| Load factor | ~82% | 2024 |
| Domestic destinations | 70+ | 2024 |
What is included in the product
Detailed Word Document
Provides a concise SWOT analysis of GOL, highlighting its operational strengths and cost advantages, internal weaknesses such as fleet and liquidity constraints, external opportunities from Latin American travel recovery and ancillary revenue expansion, and threats including fuel price volatility, intense competition, and macroeconomic instability.
Customizable Excel Spreadsheet
Provides a clear SWOT matrix tailored to GOL for rapid identification of strategic risks and opportunities, enabling executives to prioritize turnaround actions; editable and presentation-ready for fast stakeholder alignment.
Weaknesses
High exposure to Brazilian macroeconomy
GOL’s revenue and demand remain tightly linked to Brazil’s macrocycle, with over 80% of capacity domestic in 2024, so passenger volumes track Brazil’s GDP and consumer confidence. Currency volatility in 2024 amplified cost and fare pressure as BRL swings raised USD-denominated fuel and lease costs. Domestic shocks can quickly compress yields and load factors, and international diversification remains limited.
Fuel and FX sensitivity
Jet fuel is dollar-denominated while a large share of GOLs revenue is in BRL, creating a currency mismatch that raises FX exposure; USD-denominated debt and costs amplify this sensitivity. FX swings inflate CASK and debt servicing, and although hedging reduces risk it cannot eliminate volatility. 2022 oil spikes (Brent ~120 USD/bbl) showed how price jumps rapidly compress margins in competitive markets.
Balance sheet leverage
Airlines carry large lease and financial obligations and GOL is no exception: with a fleet of roughly 140 aircraft, rental and debt service make up a material portion of fixed costs. Elevated leverage limits strategic flexibility, interest and lease expenses compress margins in downturns, and refinancing risk rises sharply when capital markets tighten.
Operational concentration at key hubs
Operational concentration at major Brazilian hubs, notably São Paulo Guarulhos (about 44 million passengers in 2024) and Rio Galeão, exposes GOL to slot limits and severe congestion; delays or closures cascade through its point-to-point network and depress on-time performance. Airport fee and tariff inflation in 2024-25 has pressure on CASK, and limited alternate infrastructure reduces redundancy during disruptions.
- Slot/congestion risk
- Cascade delays hurt punctuality
- Airport cost inflation → higher unit costs
- Low infrastructure redundancy
Competitive intensity in LCC and legacy space
Rivals such as LATAM and Azul compete aggressively on price and frequency across Brazil and nearby markets, while legacy carriers leverage loyalty programs and corporate contracts to protect share; new entrants and ULCC models (e.g., JetSMART expansion) pressure yields and market pricing, contributing to promotional warfare that has weighed on unit revenue recovery in 2024–25.
- Price/frequency competition
- Legacy loyalty/corporate defenses
- ULCC/new entrant yield pressure
- Promotional fare-driven unit revenue weakness
Brazilian carrier: >80% domestic capacity, FX and fuel shock exposure
GOL’s revenue and demand track Brazil’s cycle—domestic capacity >80% in 2024—concentrating volume risk and yield sensitivity. Dollar-denominated jet fuel and leases versus BRL revenue create FX exposure; 2022 Brent spiked to ~120 USD/bbl highlighting margin vulnerability. High fixed lease/debt with ~140-aircraft fleet limits flexibility and congestion at Guarulhos (≈44m pax 2024) amplifies disruption risk.
| Metric | Value |
|---|---|
| Domestic capacity | >80% (2024) |
| Fleet size | ~140 |
| Guarulhos passengers | ≈44m (2024) |
| Brent peak | ~120 USD/bbl (2022) |
Preview the Actual Deliverable
GOL SWOT Analysis
This is the actual GOL SWOT analysis document you’ll receive upon purchase—no surprises, just professional quality. The preview below is taken directly from the full SWOT report you'll get, and purchase unlocks the complete, editable version. You’re viewing a live preview of the real file; the full, detailed report becomes available after checkout.











