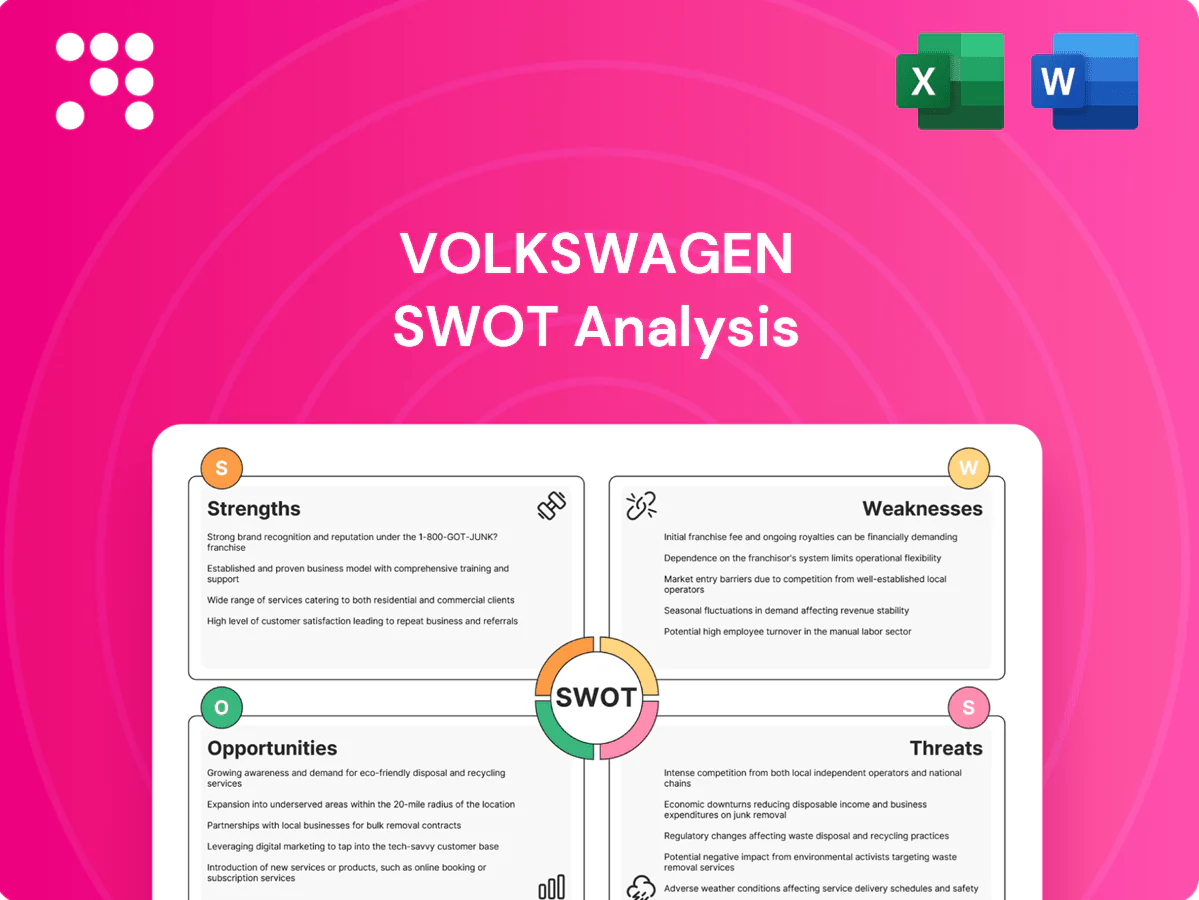
Volkswagen SWOT Analysis

Make Insightful Decisions Backed by Expert Research
Volkswagen’s global scale, strong brand portfolio, and EV investments position it well, but regulatory pressure, supply-chain risks, and legacy combustion exposure are real challenges. Our full SWOT unpacks these dynamics, financial implications, and strategic options. Purchase the complete, editable report to strategize, pitch, or invest with confidence.
Strengths

Iconic multi-brand portfolio
Volkswagen Group spans mass to ultra-luxury—VW, Audi, Porsche, Škoda, SEAT/Cupra, Bentley, Lamborghini, Ducati and MAN/Scania—diversifying revenue and smoothing cycles; Group 2023 revenue reached €279.2bn with 8.67m deliveries. Cross-brand platform and marketing sharing amplifies pricing power and lowers unit costs. Brand depth enables targeted regional mixes and stronger customer lifetime capture across segments.
Global scale & manufacturing
Volkswagen Group leverages roughly 120 production plants across about 20 countries and a global supplier network, enabling scale-driven unit cost advantages and resilient sourcing. Localized manufacturing hedges currency and trade exposure while meeting regional demand quickly. Group volumes near 8 million vehicles in 2024 allow capacity flexing across MQB/MLB/SSP platforms to optimize utilization.

Modular platforms & engineering
Volkswagen’s modular architectures—MQB (introduced 2012), MEB (launched 2019) and the PPE joint platform with Porsche (announced 2021)—enable high component commonality and faster model rollouts across the group that delivers ~8.3 million vehicles annually (2023). Shared R&D and platform reuse spread development costs over large volumes, improving time-to-market and margin potential. Fewer unique components simplifies supplier contracts and quality control, lowering complexity and procurement risk.

Strong captive finance
Volkswagen Financial Services offers financing, leasing and insurance through a captive structure that boosts sell-through, stabilizes residual-value management and increases customer retention. The captive generates recurring fee and interest income that supports Group margins and cash flow. Financing data enhances pricing, credit and risk analytics across sales and aftersales.
- Captive financing improves sell-through
- Supports residual-value management
- Drives recurring fee & interest income
- Rich financing data strengthens pricing & risk models
Premium tech and performance
Brands like Audi and Porsche anchor Volkswagen's perception in engineering, safety and performance, with Porsche selling around 300,000 vehicles in 2023 and commanding substantially higher ASPs than mass VW models. Technology leadership in EVs and ADAS supports higher margins and loyalty; VW Group's advanced driver assistance credentials strengthen regulatory and consumer trust. Motorsport successes and R&D spillovers elevate the entire portfolio.
- Premium halo: Porsche/Audi drive brand equity
- Higher ASPs: premium pricing and loyalty
- Safety/ADAS: regulatory trust and market advantage
- Motorsport/R&D: innovation spillover
Auto group: €279.2bn, 8.67m deliveries, MQB/MEB/PPE
Volkswagen Group's diversified brand portfolio (VW, Audi, Porsche, Bentley, Lamborghini, Škoda, SEAT/Cupra) and premium halo drive pricing and loyalty; Group revenue €279.2bn and 8.67m deliveries in 2023. Modular platforms (MQB/MEB/PPE) and ~120 plants lower unit costs and speed rollouts. Captive finance and R&D/ADAS leadership stabilize margins.
| Metric | Value |
|---|---|
| Revenue (2023) | €279.2bn |
| Deliveries (2023) | 8.67m |
| Porsche sales (2023) | ~300k |
| Production plants | ~120 |
| Key platforms | MQB / MEB / PPE |
What is included in the product
 Detailed Word Document
Delivers a strategic overview of Volkswagen’s internal and external business factors, outlining strengths, weaknesses, opportunities, and threats to map the company’s competitive position, key growth drivers, operational gaps, and the risks shaping its future.

 Customizable Excel Spreadsheet
Delivers a concise Volkswagen SWOT snapshot to quickly align strategy, highlight competitive risks, and relieve decision-making bottlenecks across product, regulatory, and supply-chain pain points.
Weaknesses

Legacy scandal overhang
Diesel emissions issues eroded brand trust and have cost Volkswagen over €30 billion in fines, buybacks and provisions since 2015; reputation recovery demands sustained spend while the group has committed roughly €73 billion to electrification and software through 2025. Some markets (US, parts of Northern Europe) remain sensitive to the diesel legacy, and management bandwidth and capital were diverted from growth initiatives.
Software execution gaps
CARIAD delays and quality issues have slowed infotainment and ADAS rollouts across VW brands, undermining scheduled launches. In-car UX and OTA capabilities still lag best-in-class rivals in several models, weakening customer perception. Rework raises costs and disrupts launch cadence—CARIAD employs about 6,000 engineers and has incurred multimillion-euro remediation bills. Supplier and platform fragmentation further add integration complexity.

High fixed-cost structure
Volkswagen's high fixed-cost structure is driven by a large European manufacturing footprint and extensive IG Metall labor agreements, with the Group employing over 600,000 people, which limits operational flexibility. High break-even volumes make profits vulnerable in downturns. Complex product lines increase inventory and tooling needs. Restructuring carries high direct costs and significant political sensitivity.

China dependency risk
China dependency risk: China accounted for about 30% of Volkswagen Group vehicle deliveries in 2024, making it a major profit pool; rising market-share pressure from local EV makers such as BYD and Chery compresses margins and growth potential. Joint-venture structures limit VW’s agility and add cost layers, while rapid policy shifts or shifts in consumer EV preferences can quickly dent volumes and profitability.
- China ~30% of VW deliveries (2024)
- Local EV competition eroding share
- JV structures reduce agility/margins
- Policy/consumer shifts can rapidly impact volumes
EV profitability transition
- Battery cost: 132 USD/kWh (BNEF 2024)
- EV maintenance revenue down: 30–40%
- Industry price cuts 2024–25 driving ASP pressure
- Stranded-asset risk from ICE-capex
Diesel fines >€30bn and €73bn electrification spend squeeze margins; China ≈30% exposure
Legacy diesel fines >€30bn since 2015 and €73bn committed to electrification to 2025 strain cash and reputation; CARIAD delays (≈6,000 engineers) hamper UX/ADAS launches. High fixed costs (≈600,000 employees) and China dependence (~30% of deliveries in 2024) plus EV margin squeeze (battery ≈132 USD/kWh 2024; aftersales -30–40%) weaken profitability.
| Metric | Value |
|---|---|
| Diesel-related costs | >€30bn |
| Electrification commit | €73bn to 2025 |
| China share (2024) | ≈30% |
| Battery cost (BNEF 2024) | ≈132 USD/kWh |
| Employees | ≈600,000 |
What You See Is What You Get
Volkswagen SWOT Analysis
This is the actual Volkswagen SWOT analysis document you’ll receive upon purchase—no surprises, just professional quality. The preview below is taken directly from the full report and reflects the same editable file included in your download. Buy now to unlock the complete, detailed version.

Make Insightful Decisions Backed by Expert Research
Volkswagen’s global scale, strong brand portfolio, and EV investments position it well, but regulatory pressure, supply-chain risks, and legacy combustion exposure are real challenges. Our full SWOT unpacks these dynamics, financial implications, and strategic options. Purchase the complete, editable report to strategize, pitch, or invest with confidence.
Strengths
Iconic multi-brand portfolio
Volkswagen Group spans mass to ultra-luxury—VW, Audi, Porsche, Škoda, SEAT/Cupra, Bentley, Lamborghini, Ducati and MAN/Scania—diversifying revenue and smoothing cycles; Group 2023 revenue reached €279.2bn with 8.67m deliveries. Cross-brand platform and marketing sharing amplifies pricing power and lowers unit costs. Brand depth enables targeted regional mixes and stronger customer lifetime capture across segments.
Global scale & manufacturing
Volkswagen Group leverages roughly 120 production plants across about 20 countries and a global supplier network, enabling scale-driven unit cost advantages and resilient sourcing. Localized manufacturing hedges currency and trade exposure while meeting regional demand quickly. Group volumes near 8 million vehicles in 2024 allow capacity flexing across MQB/MLB/SSP platforms to optimize utilization.
Modular platforms & engineering
Volkswagen’s modular architectures—MQB (introduced 2012), MEB (launched 2019) and the PPE joint platform with Porsche (announced 2021)—enable high component commonality and faster model rollouts across the group that delivers ~8.3 million vehicles annually (2023). Shared R&D and platform reuse spread development costs over large volumes, improving time-to-market and margin potential. Fewer unique components simplifies supplier contracts and quality control, lowering complexity and procurement risk.
Strong captive finance
Volkswagen Financial Services offers financing, leasing and insurance through a captive structure that boosts sell-through, stabilizes residual-value management and increases customer retention. The captive generates recurring fee and interest income that supports Group margins and cash flow. Financing data enhances pricing, credit and risk analytics across sales and aftersales.
- Captive financing improves sell-through
- Supports residual-value management
- Drives recurring fee & interest income
- Rich financing data strengthens pricing & risk models
Premium tech and performance
Brands like Audi and Porsche anchor Volkswagen's perception in engineering, safety and performance, with Porsche selling around 300,000 vehicles in 2023 and commanding substantially higher ASPs than mass VW models. Technology leadership in EVs and ADAS supports higher margins and loyalty; VW Group's advanced driver assistance credentials strengthen regulatory and consumer trust. Motorsport successes and R&D spillovers elevate the entire portfolio.
- Premium halo: Porsche/Audi drive brand equity
- Higher ASPs: premium pricing and loyalty
- Safety/ADAS: regulatory trust and market advantage
- Motorsport/R&D: innovation spillover
Auto group: €279.2bn, 8.67m deliveries, MQB/MEB/PPE
Volkswagen Group's diversified brand portfolio (VW, Audi, Porsche, Bentley, Lamborghini, Škoda, SEAT/Cupra) and premium halo drive pricing and loyalty; Group revenue €279.2bn and 8.67m deliveries in 2023. Modular platforms (MQB/MEB/PPE) and ~120 plants lower unit costs and speed rollouts. Captive finance and R&D/ADAS leadership stabilize margins.
| Metric | Value |
|---|---|
| Revenue (2023) | €279.2bn |
| Deliveries (2023) | 8.67m |
| Porsche sales (2023) | ~300k |
| Production plants | ~120 |
| Key platforms | MQB / MEB / PPE |
What is included in the product
Detailed Word Document
Delivers a strategic overview of Volkswagen’s internal and external business factors, outlining strengths, weaknesses, opportunities, and threats to map the company’s competitive position, key growth drivers, operational gaps, and the risks shaping its future.
Customizable Excel Spreadsheet
Delivers a concise Volkswagen SWOT snapshot to quickly align strategy, highlight competitive risks, and relieve decision-making bottlenecks across product, regulatory, and supply-chain pain points.
Weaknesses
Legacy scandal overhang
Diesel emissions issues eroded brand trust and have cost Volkswagen over €30 billion in fines, buybacks and provisions since 2015; reputation recovery demands sustained spend while the group has committed roughly €73 billion to electrification and software through 2025. Some markets (US, parts of Northern Europe) remain sensitive to the diesel legacy, and management bandwidth and capital were diverted from growth initiatives.
Software execution gaps
CARIAD delays and quality issues have slowed infotainment and ADAS rollouts across VW brands, undermining scheduled launches. In-car UX and OTA capabilities still lag best-in-class rivals in several models, weakening customer perception. Rework raises costs and disrupts launch cadence—CARIAD employs about 6,000 engineers and has incurred multimillion-euro remediation bills. Supplier and platform fragmentation further add integration complexity.
High fixed-cost structure
Volkswagen's high fixed-cost structure is driven by a large European manufacturing footprint and extensive IG Metall labor agreements, with the Group employing over 600,000 people, which limits operational flexibility. High break-even volumes make profits vulnerable in downturns. Complex product lines increase inventory and tooling needs. Restructuring carries high direct costs and significant political sensitivity.
China dependency risk
China dependency risk: China accounted for about 30% of Volkswagen Group vehicle deliveries in 2024, making it a major profit pool; rising market-share pressure from local EV makers such as BYD and Chery compresses margins and growth potential. Joint-venture structures limit VW’s agility and add cost layers, while rapid policy shifts or shifts in consumer EV preferences can quickly dent volumes and profitability.
- China ~30% of VW deliveries (2024)
- Local EV competition eroding share
- JV structures reduce agility/margins
- Policy/consumer shifts can rapidly impact volumes
EV profitability transition
- Battery cost: 132 USD/kWh (BNEF 2024)
- EV maintenance revenue down: 30–40%
- Industry price cuts 2024–25 driving ASP pressure
- Stranded-asset risk from ICE-capex
Diesel fines >€30bn and €73bn electrification spend squeeze margins; China ≈30% exposure
Legacy diesel fines >€30bn since 2015 and €73bn committed to electrification to 2025 strain cash and reputation; CARIAD delays (≈6,000 engineers) hamper UX/ADAS launches. High fixed costs (≈600,000 employees) and China dependence (~30% of deliveries in 2024) plus EV margin squeeze (battery ≈132 USD/kWh 2024; aftersales -30–40%) weaken profitability.
| Metric | Value |
|---|---|
| Diesel-related costs | >€30bn |
| Electrification commit | €73bn to 2025 |
| China share (2024) | ≈30% |
| Battery cost (BNEF 2024) | ≈132 USD/kWh |
| Employees | ≈600,000 |
What You See Is What You Get
Volkswagen SWOT Analysis
This is the actual Volkswagen SWOT analysis document you’ll receive upon purchase—no surprises, just professional quality. The preview below is taken directly from the full report and reflects the same editable file included in your download. Buy now to unlock the complete, detailed version.
Description
Make Insightful Decisions Backed by Expert Research
Volkswagen’s global scale, strong brand portfolio, and EV investments position it well, but regulatory pressure, supply-chain risks, and legacy combustion exposure are real challenges. Our full SWOT unpacks these dynamics, financial implications, and strategic options. Purchase the complete, editable report to strategize, pitch, or invest with confidence.
Strengths
Iconic multi-brand portfolio
Volkswagen Group spans mass to ultra-luxury—VW, Audi, Porsche, Škoda, SEAT/Cupra, Bentley, Lamborghini, Ducati and MAN/Scania—diversifying revenue and smoothing cycles; Group 2023 revenue reached €279.2bn with 8.67m deliveries. Cross-brand platform and marketing sharing amplifies pricing power and lowers unit costs. Brand depth enables targeted regional mixes and stronger customer lifetime capture across segments.
Global scale & manufacturing
Volkswagen Group leverages roughly 120 production plants across about 20 countries and a global supplier network, enabling scale-driven unit cost advantages and resilient sourcing. Localized manufacturing hedges currency and trade exposure while meeting regional demand quickly. Group volumes near 8 million vehicles in 2024 allow capacity flexing across MQB/MLB/SSP platforms to optimize utilization.
Modular platforms & engineering
Volkswagen’s modular architectures—MQB (introduced 2012), MEB (launched 2019) and the PPE joint platform with Porsche (announced 2021)—enable high component commonality and faster model rollouts across the group that delivers ~8.3 million vehicles annually (2023). Shared R&D and platform reuse spread development costs over large volumes, improving time-to-market and margin potential. Fewer unique components simplifies supplier contracts and quality control, lowering complexity and procurement risk.
Strong captive finance
Volkswagen Financial Services offers financing, leasing and insurance through a captive structure that boosts sell-through, stabilizes residual-value management and increases customer retention. The captive generates recurring fee and interest income that supports Group margins and cash flow. Financing data enhances pricing, credit and risk analytics across sales and aftersales.
- Captive financing improves sell-through
- Supports residual-value management
- Drives recurring fee & interest income
- Rich financing data strengthens pricing & risk models
Premium tech and performance
Brands like Audi and Porsche anchor Volkswagen's perception in engineering, safety and performance, with Porsche selling around 300,000 vehicles in 2023 and commanding substantially higher ASPs than mass VW models. Technology leadership in EVs and ADAS supports higher margins and loyalty; VW Group's advanced driver assistance credentials strengthen regulatory and consumer trust. Motorsport successes and R&D spillovers elevate the entire portfolio.
- Premium halo: Porsche/Audi drive brand equity
- Higher ASPs: premium pricing and loyalty
- Safety/ADAS: regulatory trust and market advantage
- Motorsport/R&D: innovation spillover
Auto group: €279.2bn, 8.67m deliveries, MQB/MEB/PPE
Volkswagen Group's diversified brand portfolio (VW, Audi, Porsche, Bentley, Lamborghini, Škoda, SEAT/Cupra) and premium halo drive pricing and loyalty; Group revenue €279.2bn and 8.67m deliveries in 2023. Modular platforms (MQB/MEB/PPE) and ~120 plants lower unit costs and speed rollouts. Captive finance and R&D/ADAS leadership stabilize margins.
| Metric | Value |
|---|---|
| Revenue (2023) | €279.2bn |
| Deliveries (2023) | 8.67m |
| Porsche sales (2023) | ~300k |
| Production plants | ~120 |
| Key platforms | MQB / MEB / PPE |
What is included in the product
Detailed Word Document
Delivers a strategic overview of Volkswagen’s internal and external business factors, outlining strengths, weaknesses, opportunities, and threats to map the company’s competitive position, key growth drivers, operational gaps, and the risks shaping its future.
Customizable Excel Spreadsheet
Delivers a concise Volkswagen SWOT snapshot to quickly align strategy, highlight competitive risks, and relieve decision-making bottlenecks across product, regulatory, and supply-chain pain points.
Weaknesses
Legacy scandal overhang
Diesel emissions issues eroded brand trust and have cost Volkswagen over €30 billion in fines, buybacks and provisions since 2015; reputation recovery demands sustained spend while the group has committed roughly €73 billion to electrification and software through 2025. Some markets (US, parts of Northern Europe) remain sensitive to the diesel legacy, and management bandwidth and capital were diverted from growth initiatives.
Software execution gaps
CARIAD delays and quality issues have slowed infotainment and ADAS rollouts across VW brands, undermining scheduled launches. In-car UX and OTA capabilities still lag best-in-class rivals in several models, weakening customer perception. Rework raises costs and disrupts launch cadence—CARIAD employs about 6,000 engineers and has incurred multimillion-euro remediation bills. Supplier and platform fragmentation further add integration complexity.
High fixed-cost structure
Volkswagen's high fixed-cost structure is driven by a large European manufacturing footprint and extensive IG Metall labor agreements, with the Group employing over 600,000 people, which limits operational flexibility. High break-even volumes make profits vulnerable in downturns. Complex product lines increase inventory and tooling needs. Restructuring carries high direct costs and significant political sensitivity.
China dependency risk
China dependency risk: China accounted for about 30% of Volkswagen Group vehicle deliveries in 2024, making it a major profit pool; rising market-share pressure from local EV makers such as BYD and Chery compresses margins and growth potential. Joint-venture structures limit VW’s agility and add cost layers, while rapid policy shifts or shifts in consumer EV preferences can quickly dent volumes and profitability.
- China ~30% of VW deliveries (2024)
- Local EV competition eroding share
- JV structures reduce agility/margins
- Policy/consumer shifts can rapidly impact volumes
EV profitability transition
- Battery cost: 132 USD/kWh (BNEF 2024)
- EV maintenance revenue down: 30–40%
- Industry price cuts 2024–25 driving ASP pressure
- Stranded-asset risk from ICE-capex
Diesel fines >€30bn and €73bn electrification spend squeeze margins; China ≈30% exposure
Legacy diesel fines >€30bn since 2015 and €73bn committed to electrification to 2025 strain cash and reputation; CARIAD delays (≈6,000 engineers) hamper UX/ADAS launches. High fixed costs (≈600,000 employees) and China dependence (~30% of deliveries in 2024) plus EV margin squeeze (battery ≈132 USD/kWh 2024; aftersales -30–40%) weaken profitability.
| Metric | Value |
|---|---|
| Diesel-related costs | >€30bn |
| Electrification commit | €73bn to 2025 |
| China share (2024) | ≈30% |
| Battery cost (BNEF 2024) | ≈132 USD/kWh |
| Employees | ≈600,000 |
What You See Is What You Get
Volkswagen SWOT Analysis
This is the actual Volkswagen SWOT analysis document you’ll receive upon purchase—no surprises, just professional quality. The preview below is taken directly from the full report and reflects the same editable file included in your download. Buy now to unlock the complete, detailed version.











