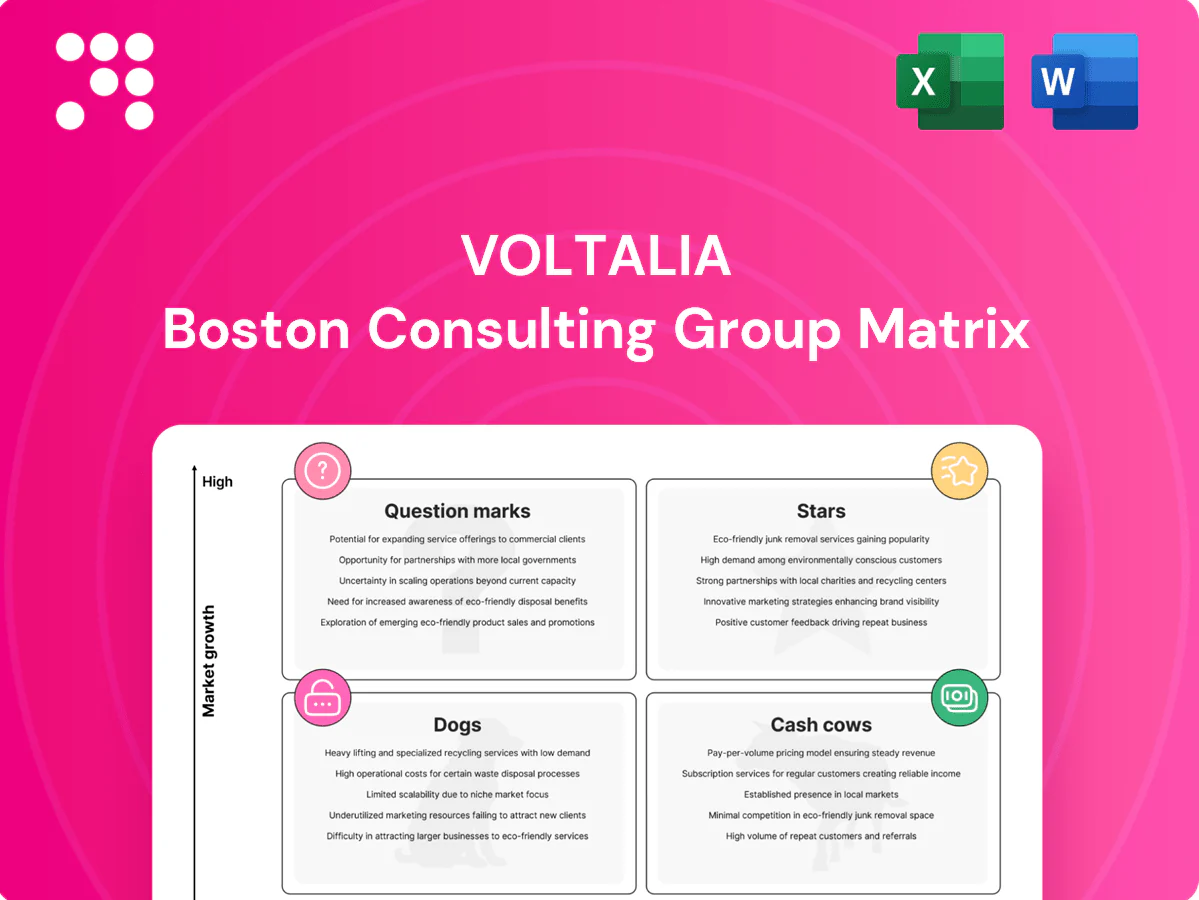
Voltalia Boston Consulting Group Matrix

Download Your Competitive Advantage
Curious where Voltalia’s assets sit — Stars, Cash Cows, Dogs or Question Marks? This preview sketches the map; the full BCG Matrix gives quadrant-by-quadrant placement, data-backed recommendations, and a tactical roadmap you can act on now. Buy the complete report for a ready-to-present Word file plus an editable Excel summary and skip the guesswork. Invest a few minutes, save months of strategy work.
Stars

Utility-scale solar in core Latin America
Utility-scale solar in core Latin America sits in high-growth markets with deep pipelines where Voltalia reported c.2.2 GW operational capacity and a ~4.5 GW development pipeline in 2024, giving it meaningful regional share. Projects are capital hungry but win on volume and bankable PPAs, delivering scale economics. Continue feeding the build–operate–sell loop to defend leadership and turn scale into durable cash generation as growth normalizes.
Onshore wind clusters with long-term PPAs
Wind hubs anchored by long-term PPAs (typically 10–20 years) lead Voltalia’s BCG cluster: contracted offtake gives revenue visibility that de-risks financing and enables scale. Development and construction soak up cash—onshore CAPEX is roughly €1.0–1.5m per MW—but scale and 10–20y contracts justify it. Stay aggressive on repowering (output gains often 30–40%) and co-location to lock market share and repeat wins.

Hybrid parks (solar + wind + storage)
Hybrid parks (solar + wind + storage) are grid-friendly, high-availability assets that align with markets racing to add renewables, as highlighted by IEA 2024 market analysis. Integration complexity creates first-mover, moat-like advantages for Voltalia through proprietary design and ops. Heavy capex and operational sophistication are required, but industry reports (BNEF 2024, IEA 2024) show hybrids boost resilience and capture prices where grid constraints exist.

Corporate PPA origination for multinationals
Corporate demand is surging as multinationals chase net‑zero; global corporate renewable PPA volume reached about 30 GW in 2024, underscoring scale. Voltalia’s development-to-O&M span positions it as a preferred partner, converting long, resource‑intensive sales cycles into large, sticky contracts. Invest in origination teams and advanced analytics to outpace rivals and scale faster.
- ~30 GW global corporate PPAs in 2024
- Voltalia advantage: integrated development to O&M
- Sales cycles long but deals large and sticky
- Priority: scale origination teams + analytics
Project development engine in Europe and Brazil
Project development engine in Europe and Brazil is a Star in Voltalia's BCG matrix in 2024: permitting expertise, land banking and grid access create high entry barriers; the pipeline supplies both own-ops and asset rotations; upfront capex is heavy but successful conversion generates outsized value; continue stacking high-quality sites as markets tighten.
- Permitting moat
- Land bank leverage
- Grid access rarity
- Dual exit pathways
- High upfront, high upside
Utility-scale solar & wind: 2.2 GW ops, ~4.5 GW pipeline
Utility-scale solar and wind hubs are Stars: 2024 ops c.2.2 GW with ~4.5 GW pipeline, corporate PPAs ~30 GW market tailwind. Onshore CAPEX €1.0–1.5m/MW; repowering upsides 30–40%. Hybrid parks and origination scale convert growth into durable cash.
| Metric | 2024 |
|---|---|
| Operational capacity | c.2.2 GW |
| Development pipeline | ~4.5 GW |
| Corporate PPA market | ~30 GW |
| Onshore CAPEX | €1.0–1.5m/MW |
What is included in the product
 Detailed Word Document
In-depth Voltalia BCG Matrix analysis of each business unit with strategic recommendations for Stars, Cash Cows, Question Marks, and Dogs.

 Customizable Excel Spreadsheet
One-page Voltalia BCG Matrix easing portfolio decisions — clean layout, export-ready for PPT and C-level decks.
Cash Cows

Operations & Maintenance for owned fleet
Operations & Maintenance for Voltalia owned fleet delivers stable, recurring revenues from mature assets with disciplined processes and long‑term contracts. Margins improve as scale and predictive maintenance reduce downtime and unit costs. Low incremental capex on operating plants keeps free cash flow positive. Focus remains on maintaining uptime, trimming O&M costs and keeping the fleet humming.
Third-party O&M and asset management
Voltalias third-party O&M and asset management are mature service lines with steady, contract-backed revenue and modest growth; the global renewable O&M market reached about USD 20.6 billion in 2024. Cash-light and people-and-software driven, these services are margin-accretive with typical O&M EBITDA margins in the 15–25% range. They smooth earnings and help fund development while the firm focuses on high-margin clients and standardized service packages.

Long-term contracted solar in mature European markets
Long-term contracted solar assets in mature European markets show low market growth but solid share for Voltalia, whose operational capacity reached about 2.6 GW in 2024, underpinning predictable cash under PPAs and historical FiTs. Routine capex and upgrades suffice; promotion and heavy investment are limited. Strong cash conversion in 2024 supported debt service and dividend distributions, so optimize performance and avoid overinvestment.

EPC services for repeat clients
In 2024 Voltalia's EPC services for repeat clients leveraged repeatable scopes, learned efficiencies and tight cost control to protect margins; project risk was known and margins stemmed from execution discipline. Standard designs and schedule certainty provided supply‑chain throughput without balance‑sheet strain.
- Repeatable scopes
- Learned efficiencies
- Tight cost control
- Schedule certainty
Asset rotation (build–sell) on de-risked projects
Asset rotation monetizes development gains once projects are derisked: buyers pay for contracted cash flows and Voltalia recycles capital into new developments, delivering reliable cash generation rather than hyper-growth. Selective sales fund Stars and support disciplined pipeline expansion; recent disposals have materially improved liquidity and ROIC. This strategy sustains steady free cash flow while enabling targeted growth investments.
- Monetizes derisked projects via sale to yield-focused buyers
- Buyers value contracted cash flows; Voltalia recycles capital
- Not hyper-growth but reliable cash generation
- Selective sales fund Star projects and pipeline scaling
O&M and contracted assets deliver steady, high-conversion cash and fund growth
Operations & Maintenance and long‑term contracted assets generate stable, high‑conversion cash for Voltalia, with 2024 fleet at ~2.6 GW and predictable PPA/FIT revenues. Third‑party O&M backs recurring, cash‑light revenue in a ~USD 20.6bn global market (2024) with typical EBITDA 15–25%. Asset rotation and selective disposals recycle capital to fund Stars while preserving free cash flow and debt service.
| Metric | 2024 |
|---|---|
| Operational capacity | ~2.6 GW |
| Global O&M market | USD 20.6 bn |
| O&M EBITDA range | 15–25% |
Preview = Final Product
Voltalia BCG Matrix
The file you're previewing here is the final Voltalia BCG Matrix you'll receive after purchase. No watermarks, no demo content—just a polished, ready-to-use strategic report. It's built for clarity, with market-backed analysis and clean formatting. After buying you'll get the exact same document instantly, editable and printable. Use it in board meetings, investor decks, or internal planning with zero surprises.

Download Your Competitive Advantage
Curious where Voltalia’s assets sit — Stars, Cash Cows, Dogs or Question Marks? This preview sketches the map; the full BCG Matrix gives quadrant-by-quadrant placement, data-backed recommendations, and a tactical roadmap you can act on now. Buy the complete report for a ready-to-present Word file plus an editable Excel summary and skip the guesswork. Invest a few minutes, save months of strategy work.
Stars
Utility-scale solar in core Latin America
Utility-scale solar in core Latin America sits in high-growth markets with deep pipelines where Voltalia reported c.2.2 GW operational capacity and a ~4.5 GW development pipeline in 2024, giving it meaningful regional share. Projects are capital hungry but win on volume and bankable PPAs, delivering scale economics. Continue feeding the build–operate–sell loop to defend leadership and turn scale into durable cash generation as growth normalizes.
Onshore wind clusters with long-term PPAs
Wind hubs anchored by long-term PPAs (typically 10–20 years) lead Voltalia’s BCG cluster: contracted offtake gives revenue visibility that de-risks financing and enables scale. Development and construction soak up cash—onshore CAPEX is roughly €1.0–1.5m per MW—but scale and 10–20y contracts justify it. Stay aggressive on repowering (output gains often 30–40%) and co-location to lock market share and repeat wins.
Hybrid parks (solar + wind + storage)
Hybrid parks (solar + wind + storage) are grid-friendly, high-availability assets that align with markets racing to add renewables, as highlighted by IEA 2024 market analysis. Integration complexity creates first-mover, moat-like advantages for Voltalia through proprietary design and ops. Heavy capex and operational sophistication are required, but industry reports (BNEF 2024, IEA 2024) show hybrids boost resilience and capture prices where grid constraints exist.
Corporate PPA origination for multinationals
Corporate demand is surging as multinationals chase net‑zero; global corporate renewable PPA volume reached about 30 GW in 2024, underscoring scale. Voltalia’s development-to-O&M span positions it as a preferred partner, converting long, resource‑intensive sales cycles into large, sticky contracts. Invest in origination teams and advanced analytics to outpace rivals and scale faster.
- ~30 GW global corporate PPAs in 2024
- Voltalia advantage: integrated development to O&M
- Sales cycles long but deals large and sticky
- Priority: scale origination teams + analytics
Project development engine in Europe and Brazil
Project development engine in Europe and Brazil is a Star in Voltalia's BCG matrix in 2024: permitting expertise, land banking and grid access create high entry barriers; the pipeline supplies both own-ops and asset rotations; upfront capex is heavy but successful conversion generates outsized value; continue stacking high-quality sites as markets tighten.
- Permitting moat
- Land bank leverage
- Grid access rarity
- Dual exit pathways
- High upfront, high upside
Utility-scale solar & wind: 2.2 GW ops, ~4.5 GW pipeline
Utility-scale solar and wind hubs are Stars: 2024 ops c.2.2 GW with ~4.5 GW pipeline, corporate PPAs ~30 GW market tailwind. Onshore CAPEX €1.0–1.5m/MW; repowering upsides 30–40%. Hybrid parks and origination scale convert growth into durable cash.
| Metric | 2024 |
|---|---|
| Operational capacity | c.2.2 GW |
| Development pipeline | ~4.5 GW |
| Corporate PPA market | ~30 GW |
| Onshore CAPEX | €1.0–1.5m/MW |
What is included in the product
Detailed Word Document
In-depth Voltalia BCG Matrix analysis of each business unit with strategic recommendations for Stars, Cash Cows, Question Marks, and Dogs.
Customizable Excel Spreadsheet
One-page Voltalia BCG Matrix easing portfolio decisions — clean layout, export-ready for PPT and C-level decks.
Cash Cows
Operations & Maintenance for owned fleet
Operations & Maintenance for Voltalia owned fleet delivers stable, recurring revenues from mature assets with disciplined processes and long‑term contracts. Margins improve as scale and predictive maintenance reduce downtime and unit costs. Low incremental capex on operating plants keeps free cash flow positive. Focus remains on maintaining uptime, trimming O&M costs and keeping the fleet humming.
Third-party O&M and asset management
Voltalias third-party O&M and asset management are mature service lines with steady, contract-backed revenue and modest growth; the global renewable O&M market reached about USD 20.6 billion in 2024. Cash-light and people-and-software driven, these services are margin-accretive with typical O&M EBITDA margins in the 15–25% range. They smooth earnings and help fund development while the firm focuses on high-margin clients and standardized service packages.
Long-term contracted solar in mature European markets
Long-term contracted solar assets in mature European markets show low market growth but solid share for Voltalia, whose operational capacity reached about 2.6 GW in 2024, underpinning predictable cash under PPAs and historical FiTs. Routine capex and upgrades suffice; promotion and heavy investment are limited. Strong cash conversion in 2024 supported debt service and dividend distributions, so optimize performance and avoid overinvestment.
EPC services for repeat clients
In 2024 Voltalia's EPC services for repeat clients leveraged repeatable scopes, learned efficiencies and tight cost control to protect margins; project risk was known and margins stemmed from execution discipline. Standard designs and schedule certainty provided supply‑chain throughput without balance‑sheet strain.
- Repeatable scopes
- Learned efficiencies
- Tight cost control
- Schedule certainty
Asset rotation (build–sell) on de-risked projects
Asset rotation monetizes development gains once projects are derisked: buyers pay for contracted cash flows and Voltalia recycles capital into new developments, delivering reliable cash generation rather than hyper-growth. Selective sales fund Stars and support disciplined pipeline expansion; recent disposals have materially improved liquidity and ROIC. This strategy sustains steady free cash flow while enabling targeted growth investments.
- Monetizes derisked projects via sale to yield-focused buyers
- Buyers value contracted cash flows; Voltalia recycles capital
- Not hyper-growth but reliable cash generation
- Selective sales fund Star projects and pipeline scaling
O&M and contracted assets deliver steady, high-conversion cash and fund growth
Operations & Maintenance and long‑term contracted assets generate stable, high‑conversion cash for Voltalia, with 2024 fleet at ~2.6 GW and predictable PPA/FIT revenues. Third‑party O&M backs recurring, cash‑light revenue in a ~USD 20.6bn global market (2024) with typical EBITDA 15–25%. Asset rotation and selective disposals recycle capital to fund Stars while preserving free cash flow and debt service.
| Metric | 2024 |
|---|---|
| Operational capacity | ~2.6 GW |
| Global O&M market | USD 20.6 bn |
| O&M EBITDA range | 15–25% |
Preview = Final Product
Voltalia BCG Matrix
The file you're previewing here is the final Voltalia BCG Matrix you'll receive after purchase. No watermarks, no demo content—just a polished, ready-to-use strategic report. It's built for clarity, with market-backed analysis and clean formatting. After buying you'll get the exact same document instantly, editable and printable. Use it in board meetings, investor decks, or internal planning with zero surprises.
Description
Download Your Competitive Advantage
Curious where Voltalia’s assets sit — Stars, Cash Cows, Dogs or Question Marks? This preview sketches the map; the full BCG Matrix gives quadrant-by-quadrant placement, data-backed recommendations, and a tactical roadmap you can act on now. Buy the complete report for a ready-to-present Word file plus an editable Excel summary and skip the guesswork. Invest a few minutes, save months of strategy work.
Stars
Utility-scale solar in core Latin America
Utility-scale solar in core Latin America sits in high-growth markets with deep pipelines where Voltalia reported c.2.2 GW operational capacity and a ~4.5 GW development pipeline in 2024, giving it meaningful regional share. Projects are capital hungry but win on volume and bankable PPAs, delivering scale economics. Continue feeding the build–operate–sell loop to defend leadership and turn scale into durable cash generation as growth normalizes.
Onshore wind clusters with long-term PPAs
Wind hubs anchored by long-term PPAs (typically 10–20 years) lead Voltalia’s BCG cluster: contracted offtake gives revenue visibility that de-risks financing and enables scale. Development and construction soak up cash—onshore CAPEX is roughly €1.0–1.5m per MW—but scale and 10–20y contracts justify it. Stay aggressive on repowering (output gains often 30–40%) and co-location to lock market share and repeat wins.
Hybrid parks (solar + wind + storage)
Hybrid parks (solar + wind + storage) are grid-friendly, high-availability assets that align with markets racing to add renewables, as highlighted by IEA 2024 market analysis. Integration complexity creates first-mover, moat-like advantages for Voltalia through proprietary design and ops. Heavy capex and operational sophistication are required, but industry reports (BNEF 2024, IEA 2024) show hybrids boost resilience and capture prices where grid constraints exist.
Corporate PPA origination for multinationals
Corporate demand is surging as multinationals chase net‑zero; global corporate renewable PPA volume reached about 30 GW in 2024, underscoring scale. Voltalia’s development-to-O&M span positions it as a preferred partner, converting long, resource‑intensive sales cycles into large, sticky contracts. Invest in origination teams and advanced analytics to outpace rivals and scale faster.
- ~30 GW global corporate PPAs in 2024
- Voltalia advantage: integrated development to O&M
- Sales cycles long but deals large and sticky
- Priority: scale origination teams + analytics
Project development engine in Europe and Brazil
Project development engine in Europe and Brazil is a Star in Voltalia's BCG matrix in 2024: permitting expertise, land banking and grid access create high entry barriers; the pipeline supplies both own-ops and asset rotations; upfront capex is heavy but successful conversion generates outsized value; continue stacking high-quality sites as markets tighten.
- Permitting moat
- Land bank leverage
- Grid access rarity
- Dual exit pathways
- High upfront, high upside
Utility-scale solar & wind: 2.2 GW ops, ~4.5 GW pipeline
Utility-scale solar and wind hubs are Stars: 2024 ops c.2.2 GW with ~4.5 GW pipeline, corporate PPAs ~30 GW market tailwind. Onshore CAPEX €1.0–1.5m/MW; repowering upsides 30–40%. Hybrid parks and origination scale convert growth into durable cash.
| Metric | 2024 |
|---|---|
| Operational capacity | c.2.2 GW |
| Development pipeline | ~4.5 GW |
| Corporate PPA market | ~30 GW |
| Onshore CAPEX | €1.0–1.5m/MW |
What is included in the product
Detailed Word Document
In-depth Voltalia BCG Matrix analysis of each business unit with strategic recommendations for Stars, Cash Cows, Question Marks, and Dogs.
Customizable Excel Spreadsheet
One-page Voltalia BCG Matrix easing portfolio decisions — clean layout, export-ready for PPT and C-level decks.
Cash Cows
Operations & Maintenance for owned fleet
Operations & Maintenance for Voltalia owned fleet delivers stable, recurring revenues from mature assets with disciplined processes and long‑term contracts. Margins improve as scale and predictive maintenance reduce downtime and unit costs. Low incremental capex on operating plants keeps free cash flow positive. Focus remains on maintaining uptime, trimming O&M costs and keeping the fleet humming.
Third-party O&M and asset management
Voltalias third-party O&M and asset management are mature service lines with steady, contract-backed revenue and modest growth; the global renewable O&M market reached about USD 20.6 billion in 2024. Cash-light and people-and-software driven, these services are margin-accretive with typical O&M EBITDA margins in the 15–25% range. They smooth earnings and help fund development while the firm focuses on high-margin clients and standardized service packages.
Long-term contracted solar in mature European markets
Long-term contracted solar assets in mature European markets show low market growth but solid share for Voltalia, whose operational capacity reached about 2.6 GW in 2024, underpinning predictable cash under PPAs and historical FiTs. Routine capex and upgrades suffice; promotion and heavy investment are limited. Strong cash conversion in 2024 supported debt service and dividend distributions, so optimize performance and avoid overinvestment.
EPC services for repeat clients
In 2024 Voltalia's EPC services for repeat clients leveraged repeatable scopes, learned efficiencies and tight cost control to protect margins; project risk was known and margins stemmed from execution discipline. Standard designs and schedule certainty provided supply‑chain throughput without balance‑sheet strain.
- Repeatable scopes
- Learned efficiencies
- Tight cost control
- Schedule certainty
Asset rotation (build–sell) on de-risked projects
Asset rotation monetizes development gains once projects are derisked: buyers pay for contracted cash flows and Voltalia recycles capital into new developments, delivering reliable cash generation rather than hyper-growth. Selective sales fund Stars and support disciplined pipeline expansion; recent disposals have materially improved liquidity and ROIC. This strategy sustains steady free cash flow while enabling targeted growth investments.
- Monetizes derisked projects via sale to yield-focused buyers
- Buyers value contracted cash flows; Voltalia recycles capital
- Not hyper-growth but reliable cash generation
- Selective sales fund Star projects and pipeline scaling
O&M and contracted assets deliver steady, high-conversion cash and fund growth
Operations & Maintenance and long‑term contracted assets generate stable, high‑conversion cash for Voltalia, with 2024 fleet at ~2.6 GW and predictable PPA/FIT revenues. Third‑party O&M backs recurring, cash‑light revenue in a ~USD 20.6bn global market (2024) with typical EBITDA 15–25%. Asset rotation and selective disposals recycle capital to fund Stars while preserving free cash flow and debt service.
| Metric | 2024 |
|---|---|
| Operational capacity | ~2.6 GW |
| Global O&M market | USD 20.6 bn |
| O&M EBITDA range | 15–25% |
Preview = Final Product
Voltalia BCG Matrix
The file you're previewing here is the final Voltalia BCG Matrix you'll receive after purchase. No watermarks, no demo content—just a polished, ready-to-use strategic report. It's built for clarity, with market-backed analysis and clean formatting. After buying you'll get the exact same document instantly, editable and printable. Use it in board meetings, investor decks, or internal planning with zero surprises.











