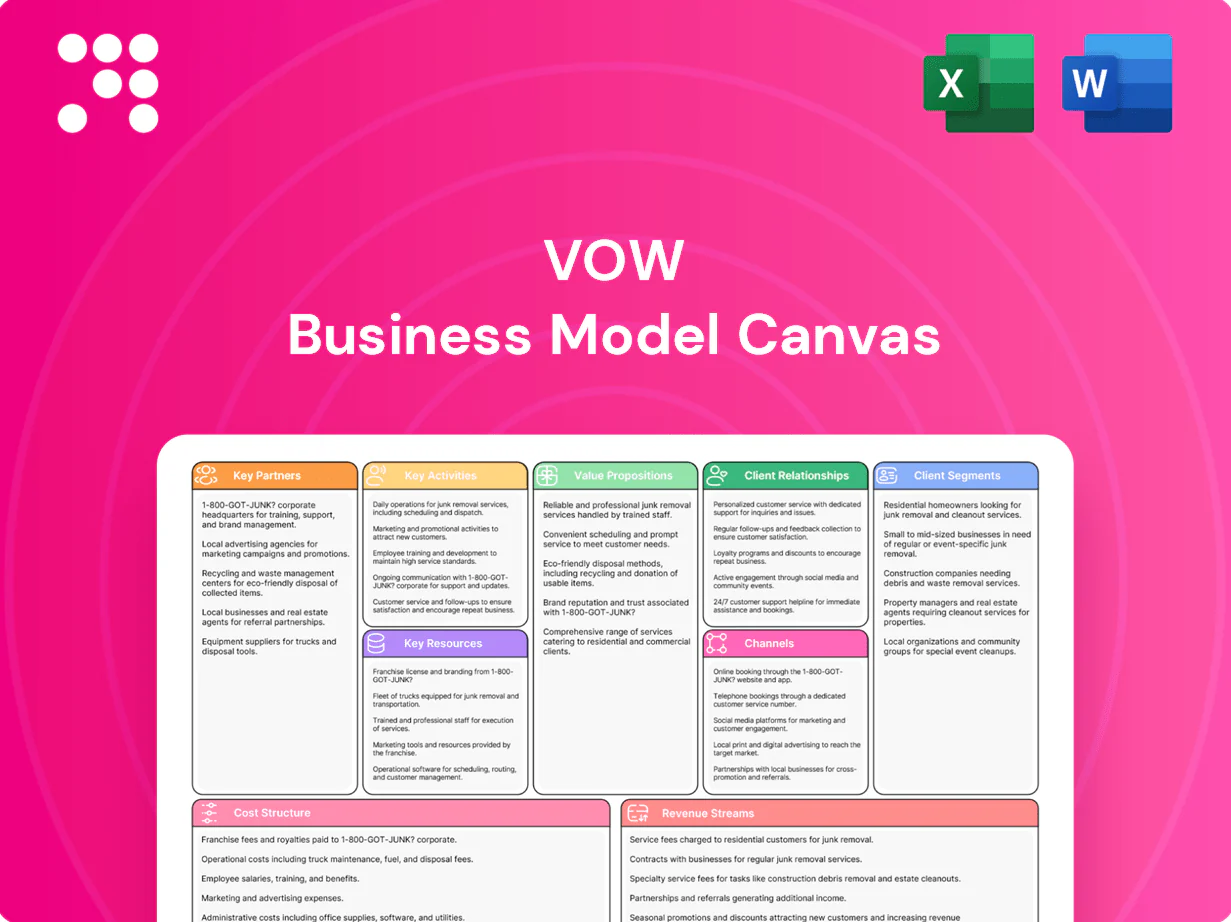
VoW Business Model Canvas

Unlock the strategic Business Model Canvas: value, revenue growth, and market defense
Unlock VoW’s strategic blueprint with the full Business Model Canvas—three clear sections revealing how it creates value, scales revenue, and defends market share. Ideal for entrepreneurs, investors, and consultants seeking actionable insights. Purchase the complete, editable Canvas to benchmark, plan, and execute with confidence.
Partnerships

Shipyards and OEM alliances
Collaborate with shipyards and maritime OEMs to integrate waste-to-energy and purification systems into new builds and retrofits. Joint engineering ensures footprint, power and safety fit, leveraging over 85% of newbuild capacity concentrated in China, South Korea and Japan (2024). Co-bidding improves fleet program win rates and shared warranties reduce operator adoption risk amid shipping CO2 ≈1,000 Mt in 2024.
EPC and integrator partners
Form strategic partnerships with EPCs and systems integrators for turnkey delivery on complex industrial sites; civil, electrical and balance-of-plant scopes typically represent 35–55% of capex. Align contracts on schedule and performance guarantees, with liquidated-damage regimes of 5–10% of contract value common in 2024. Leverage partners to expand into geographies where local execution and local-content rules (affecting 40–60% of procurement in many emerging markets in 2024) are critical.

Feedstock and waste handlers
Coordinate with waste management firms to secure stable feedstock and preprocessing pipelines, targeting contamination rates below 5% and locked offtake logistics to ensure consistent throughput. Co-locate processing with major waste hubs to cut transport costs by up to 30% and improve yield recovery. Structure contracts with 20%+ revenue-sharing on refined outputs to align incentives and accelerate feedstock quality investments.

Energy offtakers and utilities
Partner with utilities and industrial energy users to lock in PPAs for heat, power or syngas, targeting 10-year+ tenors typical in 2024; structure bankable long-term offtakes and revenue waterfalls to meet lender DSCR thresholds (commonly 1.2–1.4) and improve project financeability via predictable cash flows. Align on grid interconnection and metering standards early.
- PPAs: 10+ year tenors (2024)
- Lender DSCR: 1.2–1.4
- Interconnection & metering: contractual alignment
- Predictable cash flows: boost debt sizing
Regulators and R&D institutions
Engage environmental agencies and classification societies to certify VoW systems, aligning with EU Fit for 55 targets and maritime guidance from major societies to ease market entry. Co-develop next-gen processes with universities and labs, leveraging Horizon Europe program funding of €95.5bn (2021–2027) to access R&D grants. Influence evolving emissions and waste treatment standards to shape compliance pathways and secure pilot sites to de-risk innovation and accelerate commercialization.
- Certification partners: environmental agencies, classification societies
- R&D partners: universities, national labs
- Funding lever: Horizon Europe €95.5bn (2021–2027)
- Outcomes: standards influence, pilot sites, de-risked innovation
Alliances target 85% newbuild integration; EPCs cut capex risk
Strategic shipyard and OEM alliances target 85% newbuild integration (China/Korea/Japan, 2024) to scale retrofits. EPC and local partners reduce capex execution risk (civil/BOP 35–55%) and meet local-content 40–60% rules. Feedstock and PPA deals secure throughput (contamination <5%; PPA tenors 10+ yrs) to achieve lender DSCR 1.2–1.4.
| Partner | Metric (2024) |
|---|---|
| Shipyards/OEMs | 85% newbuild capacity |
| EPCs | Capex BOP 35–55% |
| Waste firms | Contamination <5% |
| Offtakers | PPA 10+ yrs, DSCR 1.2–1.4 |
What is included in the product
 Detailed Word Document
Comprehensive, pre-written Business Model Canvas tailored to VoW’s strategy and real-world operations, organized into the 9 classic BMC blocks with full narratives and insights. Includes competitive advantage analysis, linked SWOT, validation using company data, and a clean design for presentations, funding discussions, or internal planning.

 Customizable Excel Spreadsheet
One-page VoW Business Model Canvas condenses strategy into a clean, editable snapshot that saves hours of formatting and helps teams quickly identify core components. Shareable and adaptable, it’s perfect for fast deliverables, comparisons, and collaborative brainstorming.
Activities

Process design and engineering
Develop modular and custom-engineered thermal and purification processes, proven in 2024 to cut on-site construction time by up to 40% while enabling scalable capacity. Conduct feasibility, mass-energy balances and HAZOP to validate designs, targeting ~25–30% electrical efficiency (up to 80% with CHP) and 95% uptime. Configure units per sector-specific waste streams to maximize energy recovery and minimize footprint and OPEX.
Manufacturing and assembly
Build standardized skids and custom systems through a mix of in-house and vetted contract manufacturing, with QA/QC and FAT protocols embedded in every build. Follow ISO 9001-certified quality systems—over 900,000 ISO 9001 certificates worldwide as of 2024—and ensure marine-class approvals from DNV/ABS and relevant industrial certifications. Localize assembly in key markets to shorten lead times and improve service responsiveness.

Project management and commissioning
Manage EPC schedules, site works and stakeholder coordination to keep milestones and control cost exposure; commissioning and performance testing target 95% availability guarantees and first-year performance within 98% of design. Execute commissioning, performance testing and formal handover with documented acceptance. Train operators on SOPs and safety and establish baseline KPIs for guarantees and O&M.

Aftermarket service and O&M
Provide onsite maintenance, remote monitoring and spare parts with LTSA/SLAs guaranteeing 99.9% uptime; perform performance tuning and periodic upgrades. Use predictive analytics to reduce unplanned downtime by up to 30% and improve O&M efficiency; target 95% spare-parts fill rate and measurable SLA-linked service revenue.
- Maintenance, remote monitoring, spare parts
- LTSA/SLA with 99.9% uptime
- Performance tuning & upgrades
- Predictive analytics: ≤30% less downtime
R&D and compliance
R&D focuses on improving yields, emissions control and modularity while maintaining multi-jurisdictional regulatory compliance; in 2024 EU ETS averaged ~€85/t CO2, driving emissions-tech ROI. We file patents and protect know-how, and run pilots to validate new feedstocks and outputs at lab-to-pilot scale before commercialization.
- Innovate: yields, emissions, modularity
- Compliance: cross-border regulatory management
- IP: patents and trade secrets
- Pilots: validate feedstocks/outputs
Modular thermal skids cut build time 40%, deliver 25–30% eff. and 99.9% uptime
Develop modular thermal and purification units (2024: up to 40% on-site construction time cut), target 25–30% electrical efficiency (up to 80% with CHP) and 95% uptime. Manufacture skids with ISO 9001 QA, DNV/ABS approvals, local assembly to reduce lead times. Provide LTSA/SLA with 99.9% uptime, 95% spare-part fill, predictive analytics lowering downtime ~30%.
| Metric | 2024 Value |
|---|---|
| Construction time reduction | 40% |
| Electrical eff. (typical) | 25–30% |
| CHP peak | 80% |
| Uptime SLA | 99.9% |
| Predictive downtime reduction | 30% |
| EU ETS price | €85/t CO2 |
Full Document Unlocks After Purchase
Business Model Canvas
The document you're previewing is the exact VoW Business Model Canvas you'll receive—this is not a mockup or sample. When you purchase, you’ll instantly get the full file formatted exactly as shown, ready to download and edit. Delivered in Word and Excel for immediate use and presentation.

Unlock the strategic Business Model Canvas: value, revenue growth, and market defense
Unlock VoW’s strategic blueprint with the full Business Model Canvas—three clear sections revealing how it creates value, scales revenue, and defends market share. Ideal for entrepreneurs, investors, and consultants seeking actionable insights. Purchase the complete, editable Canvas to benchmark, plan, and execute with confidence.
Partnerships
Shipyards and OEM alliances
Collaborate with shipyards and maritime OEMs to integrate waste-to-energy and purification systems into new builds and retrofits. Joint engineering ensures footprint, power and safety fit, leveraging over 85% of newbuild capacity concentrated in China, South Korea and Japan (2024). Co-bidding improves fleet program win rates and shared warranties reduce operator adoption risk amid shipping CO2 ≈1,000 Mt in 2024.
EPC and integrator partners
Form strategic partnerships with EPCs and systems integrators for turnkey delivery on complex industrial sites; civil, electrical and balance-of-plant scopes typically represent 35–55% of capex. Align contracts on schedule and performance guarantees, with liquidated-damage regimes of 5–10% of contract value common in 2024. Leverage partners to expand into geographies where local execution and local-content rules (affecting 40–60% of procurement in many emerging markets in 2024) are critical.
Feedstock and waste handlers
Coordinate with waste management firms to secure stable feedstock and preprocessing pipelines, targeting contamination rates below 5% and locked offtake logistics to ensure consistent throughput. Co-locate processing with major waste hubs to cut transport costs by up to 30% and improve yield recovery. Structure contracts with 20%+ revenue-sharing on refined outputs to align incentives and accelerate feedstock quality investments.
Energy offtakers and utilities
Partner with utilities and industrial energy users to lock in PPAs for heat, power or syngas, targeting 10-year+ tenors typical in 2024; structure bankable long-term offtakes and revenue waterfalls to meet lender DSCR thresholds (commonly 1.2–1.4) and improve project financeability via predictable cash flows. Align on grid interconnection and metering standards early.
- PPAs: 10+ year tenors (2024)
- Lender DSCR: 1.2–1.4
- Interconnection & metering: contractual alignment
- Predictable cash flows: boost debt sizing
Regulators and R&D institutions
Engage environmental agencies and classification societies to certify VoW systems, aligning with EU Fit for 55 targets and maritime guidance from major societies to ease market entry. Co-develop next-gen processes with universities and labs, leveraging Horizon Europe program funding of €95.5bn (2021–2027) to access R&D grants. Influence evolving emissions and waste treatment standards to shape compliance pathways and secure pilot sites to de-risk innovation and accelerate commercialization.
- Certification partners: environmental agencies, classification societies
- R&D partners: universities, national labs
- Funding lever: Horizon Europe €95.5bn (2021–2027)
- Outcomes: standards influence, pilot sites, de-risked innovation
Alliances target 85% newbuild integration; EPCs cut capex risk
Strategic shipyard and OEM alliances target 85% newbuild integration (China/Korea/Japan, 2024) to scale retrofits. EPC and local partners reduce capex execution risk (civil/BOP 35–55%) and meet local-content 40–60% rules. Feedstock and PPA deals secure throughput (contamination <5%; PPA tenors 10+ yrs) to achieve lender DSCR 1.2–1.4.
| Partner | Metric (2024) |
|---|---|
| Shipyards/OEMs | 85% newbuild capacity |
| EPCs | Capex BOP 35–55% |
| Waste firms | Contamination <5% |
| Offtakers | PPA 10+ yrs, DSCR 1.2–1.4 |
What is included in the product
Detailed Word Document
Comprehensive, pre-written Business Model Canvas tailored to VoW’s strategy and real-world operations, organized into the 9 classic BMC blocks with full narratives and insights. Includes competitive advantage analysis, linked SWOT, validation using company data, and a clean design for presentations, funding discussions, or internal planning.
Customizable Excel Spreadsheet
One-page VoW Business Model Canvas condenses strategy into a clean, editable snapshot that saves hours of formatting and helps teams quickly identify core components. Shareable and adaptable, it’s perfect for fast deliverables, comparisons, and collaborative brainstorming.
Activities
Process design and engineering
Develop modular and custom-engineered thermal and purification processes, proven in 2024 to cut on-site construction time by up to 40% while enabling scalable capacity. Conduct feasibility, mass-energy balances and HAZOP to validate designs, targeting ~25–30% electrical efficiency (up to 80% with CHP) and 95% uptime. Configure units per sector-specific waste streams to maximize energy recovery and minimize footprint and OPEX.
Manufacturing and assembly
Build standardized skids and custom systems through a mix of in-house and vetted contract manufacturing, with QA/QC and FAT protocols embedded in every build. Follow ISO 9001-certified quality systems—over 900,000 ISO 9001 certificates worldwide as of 2024—and ensure marine-class approvals from DNV/ABS and relevant industrial certifications. Localize assembly in key markets to shorten lead times and improve service responsiveness.
Project management and commissioning
Manage EPC schedules, site works and stakeholder coordination to keep milestones and control cost exposure; commissioning and performance testing target 95% availability guarantees and first-year performance within 98% of design. Execute commissioning, performance testing and formal handover with documented acceptance. Train operators on SOPs and safety and establish baseline KPIs for guarantees and O&M.
Aftermarket service and O&M
Provide onsite maintenance, remote monitoring and spare parts with LTSA/SLAs guaranteeing 99.9% uptime; perform performance tuning and periodic upgrades. Use predictive analytics to reduce unplanned downtime by up to 30% and improve O&M efficiency; target 95% spare-parts fill rate and measurable SLA-linked service revenue.
- Maintenance, remote monitoring, spare parts
- LTSA/SLA with 99.9% uptime
- Performance tuning & upgrades
- Predictive analytics: ≤30% less downtime
R&D and compliance
R&D focuses on improving yields, emissions control and modularity while maintaining multi-jurisdictional regulatory compliance; in 2024 EU ETS averaged ~€85/t CO2, driving emissions-tech ROI. We file patents and protect know-how, and run pilots to validate new feedstocks and outputs at lab-to-pilot scale before commercialization.
- Innovate: yields, emissions, modularity
- Compliance: cross-border regulatory management
- IP: patents and trade secrets
- Pilots: validate feedstocks/outputs
Modular thermal skids cut build time 40%, deliver 25–30% eff. and 99.9% uptime
Develop modular thermal and purification units (2024: up to 40% on-site construction time cut), target 25–30% electrical efficiency (up to 80% with CHP) and 95% uptime. Manufacture skids with ISO 9001 QA, DNV/ABS approvals, local assembly to reduce lead times. Provide LTSA/SLA with 99.9% uptime, 95% spare-part fill, predictive analytics lowering downtime ~30%.
| Metric | 2024 Value |
|---|---|
| Construction time reduction | 40% |
| Electrical eff. (typical) | 25–30% |
| CHP peak | 80% |
| Uptime SLA | 99.9% |
| Predictive downtime reduction | 30% |
| EU ETS price | €85/t CO2 |
Full Document Unlocks After Purchase
Business Model Canvas
The document you're previewing is the exact VoW Business Model Canvas you'll receive—this is not a mockup or sample. When you purchase, you’ll instantly get the full file formatted exactly as shown, ready to download and edit. Delivered in Word and Excel for immediate use and presentation.
Original: $10.00
-65%$10.00
$3.50Description
Unlock the strategic Business Model Canvas: value, revenue growth, and market defense
Unlock VoW’s strategic blueprint with the full Business Model Canvas—three clear sections revealing how it creates value, scales revenue, and defends market share. Ideal for entrepreneurs, investors, and consultants seeking actionable insights. Purchase the complete, editable Canvas to benchmark, plan, and execute with confidence.
Partnerships
Shipyards and OEM alliances
Collaborate with shipyards and maritime OEMs to integrate waste-to-energy and purification systems into new builds and retrofits. Joint engineering ensures footprint, power and safety fit, leveraging over 85% of newbuild capacity concentrated in China, South Korea and Japan (2024). Co-bidding improves fleet program win rates and shared warranties reduce operator adoption risk amid shipping CO2 ≈1,000 Mt in 2024.
EPC and integrator partners
Form strategic partnerships with EPCs and systems integrators for turnkey delivery on complex industrial sites; civil, electrical and balance-of-plant scopes typically represent 35–55% of capex. Align contracts on schedule and performance guarantees, with liquidated-damage regimes of 5–10% of contract value common in 2024. Leverage partners to expand into geographies where local execution and local-content rules (affecting 40–60% of procurement in many emerging markets in 2024) are critical.
Feedstock and waste handlers
Coordinate with waste management firms to secure stable feedstock and preprocessing pipelines, targeting contamination rates below 5% and locked offtake logistics to ensure consistent throughput. Co-locate processing with major waste hubs to cut transport costs by up to 30% and improve yield recovery. Structure contracts with 20%+ revenue-sharing on refined outputs to align incentives and accelerate feedstock quality investments.
Energy offtakers and utilities
Partner with utilities and industrial energy users to lock in PPAs for heat, power or syngas, targeting 10-year+ tenors typical in 2024; structure bankable long-term offtakes and revenue waterfalls to meet lender DSCR thresholds (commonly 1.2–1.4) and improve project financeability via predictable cash flows. Align on grid interconnection and metering standards early.
- PPAs: 10+ year tenors (2024)
- Lender DSCR: 1.2–1.4
- Interconnection & metering: contractual alignment
- Predictable cash flows: boost debt sizing
Regulators and R&D institutions
Engage environmental agencies and classification societies to certify VoW systems, aligning with EU Fit for 55 targets and maritime guidance from major societies to ease market entry. Co-develop next-gen processes with universities and labs, leveraging Horizon Europe program funding of €95.5bn (2021–2027) to access R&D grants. Influence evolving emissions and waste treatment standards to shape compliance pathways and secure pilot sites to de-risk innovation and accelerate commercialization.
- Certification partners: environmental agencies, classification societies
- R&D partners: universities, national labs
- Funding lever: Horizon Europe €95.5bn (2021–2027)
- Outcomes: standards influence, pilot sites, de-risked innovation
Alliances target 85% newbuild integration; EPCs cut capex risk
Strategic shipyard and OEM alliances target 85% newbuild integration (China/Korea/Japan, 2024) to scale retrofits. EPC and local partners reduce capex execution risk (civil/BOP 35–55%) and meet local-content 40–60% rules. Feedstock and PPA deals secure throughput (contamination <5%; PPA tenors 10+ yrs) to achieve lender DSCR 1.2–1.4.
| Partner | Metric (2024) |
|---|---|
| Shipyards/OEMs | 85% newbuild capacity |
| EPCs | Capex BOP 35–55% |
| Waste firms | Contamination <5% |
| Offtakers | PPA 10+ yrs, DSCR 1.2–1.4 |
What is included in the product
Detailed Word Document
Comprehensive, pre-written Business Model Canvas tailored to VoW’s strategy and real-world operations, organized into the 9 classic BMC blocks with full narratives and insights. Includes competitive advantage analysis, linked SWOT, validation using company data, and a clean design for presentations, funding discussions, or internal planning.
Customizable Excel Spreadsheet
One-page VoW Business Model Canvas condenses strategy into a clean, editable snapshot that saves hours of formatting and helps teams quickly identify core components. Shareable and adaptable, it’s perfect for fast deliverables, comparisons, and collaborative brainstorming.
Activities
Process design and engineering
Develop modular and custom-engineered thermal and purification processes, proven in 2024 to cut on-site construction time by up to 40% while enabling scalable capacity. Conduct feasibility, mass-energy balances and HAZOP to validate designs, targeting ~25–30% electrical efficiency (up to 80% with CHP) and 95% uptime. Configure units per sector-specific waste streams to maximize energy recovery and minimize footprint and OPEX.
Manufacturing and assembly
Build standardized skids and custom systems through a mix of in-house and vetted contract manufacturing, with QA/QC and FAT protocols embedded in every build. Follow ISO 9001-certified quality systems—over 900,000 ISO 9001 certificates worldwide as of 2024—and ensure marine-class approvals from DNV/ABS and relevant industrial certifications. Localize assembly in key markets to shorten lead times and improve service responsiveness.
Project management and commissioning
Manage EPC schedules, site works and stakeholder coordination to keep milestones and control cost exposure; commissioning and performance testing target 95% availability guarantees and first-year performance within 98% of design. Execute commissioning, performance testing and formal handover with documented acceptance. Train operators on SOPs and safety and establish baseline KPIs for guarantees and O&M.
Aftermarket service and O&M
Provide onsite maintenance, remote monitoring and spare parts with LTSA/SLAs guaranteeing 99.9% uptime; perform performance tuning and periodic upgrades. Use predictive analytics to reduce unplanned downtime by up to 30% and improve O&M efficiency; target 95% spare-parts fill rate and measurable SLA-linked service revenue.
- Maintenance, remote monitoring, spare parts
- LTSA/SLA with 99.9% uptime
- Performance tuning & upgrades
- Predictive analytics: ≤30% less downtime
R&D and compliance
R&D focuses on improving yields, emissions control and modularity while maintaining multi-jurisdictional regulatory compliance; in 2024 EU ETS averaged ~€85/t CO2, driving emissions-tech ROI. We file patents and protect know-how, and run pilots to validate new feedstocks and outputs at lab-to-pilot scale before commercialization.
- Innovate: yields, emissions, modularity
- Compliance: cross-border regulatory management
- IP: patents and trade secrets
- Pilots: validate feedstocks/outputs
Modular thermal skids cut build time 40%, deliver 25–30% eff. and 99.9% uptime
Develop modular thermal and purification units (2024: up to 40% on-site construction time cut), target 25–30% electrical efficiency (up to 80% with CHP) and 95% uptime. Manufacture skids with ISO 9001 QA, DNV/ABS approvals, local assembly to reduce lead times. Provide LTSA/SLA with 99.9% uptime, 95% spare-part fill, predictive analytics lowering downtime ~30%.
| Metric | 2024 Value |
|---|---|
| Construction time reduction | 40% |
| Electrical eff. (typical) | 25–30% |
| CHP peak | 80% |
| Uptime SLA | 99.9% |
| Predictive downtime reduction | 30% |
| EU ETS price | €85/t CO2 |
Full Document Unlocks After Purchase
Business Model Canvas
The document you're previewing is the exact VoW Business Model Canvas you'll receive—this is not a mockup or sample. When you purchase, you’ll instantly get the full file formatted exactly as shown, ready to download and edit. Delivered in Word and Excel for immediate use and presentation.











