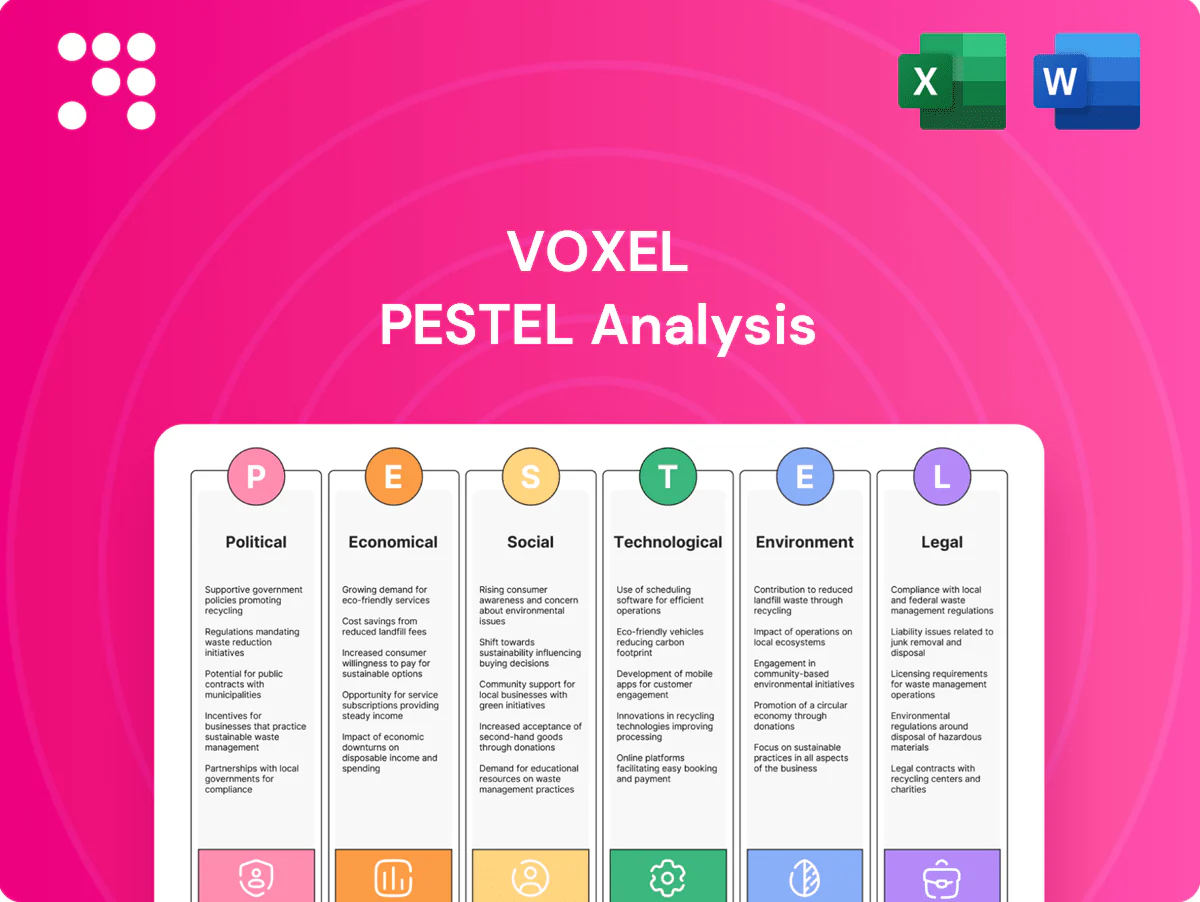
Voxel PESTLE Analysis

Your Shortcut to Market Insight Starts Here
Our Voxel PESTLE Analysis highlights key political, economic, and technological trends shaping the company’s prospects. It reveals regulatory risks, market opportunities, and sustainability pressures investors need to know. Purchase the full analysis for detailed, actionable insights and downloadable templates.
Political factors

NFZ reimbursement policy
Public payer NFZ sets pricing and annual volumes for MRI/CT/X‑ray, and the NFZ 2024 budget of ~PLN 199 billion directly constrains reimbursed service capacity. Changes to NFZ budgets or referral pathways rapidly affect Voxel’s throughput and EBITDA margins by shifting payer mix and utilization. Active advocacy and contract mix management are critical to stabilize revenue against policy shifts. Monitoring annual Health Ministry and NFZ plans helps anticipate volume and price changes.
EU healthcare funding flows
EU cohesion policy (~€373bn for 2021–27) and the Recovery and Resilience Facility (€723.8bn) funnel grants into imaging upgrades and digital health; regional grants can co-finance projects (co‑financing up to ~85% in less-developed regions), materially lowering scanner and IT capex. Political focus on oncology and cardiology pathways directs funds toward related investments, while stark regional disparities demand localized lobbying to secure allocations.

Public–private collaboration climate
Government stance on outsourcing diagnostics drives PPP opportunity: with public procurement in the EU amounting to roughly 14% of GDP, favorable Polish policies can translate into larger hospital service contracts and volume growth for providers. Reversals or tighter budgets (Poland health spending ~6.5% of GDP per OECD data) compress referral volumes. Transparency rules in tenders materially affect win rates, and relationship capital with regional authorities influences access to district-level contracts.

Geopolitical stability and security
Regional tensions raise supply-chain and energy-security risks—EU imported about 40% of its gas from Russia in 2021, highlighting vulnerability; policy responses (energy subsidies, export controls) have altered operating costs since 2022. Migration pressures (UNHCR: 117.3 million forcibly displaced at end-2023) raise diagnostic demand in border regions; contingency planning reduces disruption.
- Supply-chain & energy risk
- Policy-driven cost changes
- Migration boosts border diagnostic demand
- Contingency planning mitigates impact
Health system reform trajectory
Centralization of hospital networks changes referral flows, with OECD data showing imaging capacity varies up to tenfold between countries, altering where high-acuity CT/MRI volumes concentrate.
Wait-time guarantees and priority queues (used in 20+ OECD systems by 2023) reallocate diagnostic volumes toward expedited CT/MRI slots.
Expanded preventive screening (breast, lung) shifts modality mix toward mammography and low-dose CT; pilots often scale nationally, forcing rapid capacity planning and capital investment.
2024 budget cap PLN 199bn limits imaging; EU funds cut scanner capex
NFZ 2024 budget ~PLN 199bn constrains reimbursed MRI/CT/X‑ray volumes and margins; policy shifts quickly change payer mix. EU funds (Cohesion €373bn, RRF €723.8bn) lower capex needs for scanners/IT. Public procurement (~14% GDP) and PPP stance affect contract wins; health spend ~6.5% GDP. Energy/imports and migration alter operating costs and regional demand.
| Metric | Value |
|---|---|
| NFZ 2024 budget | ~PLN 199bn |
| EU funds | Cohesion €373bn; RRF €723.8bn |
| Poland health spend | ~6.5% GDP |
What is included in the product
 Detailed Word Document
Explores how external macro-environmental factors uniquely affect the Voxel across Political, Economic, Social, Technological, Environmental, and Legal dimensions, with each category expanded into practical sub-points and examples specific to the business and region. Backed by current data and forward-looking insights, this PESTLE helps executives, investors, and strategists identify risks, opportunities, and scenario-driven actions.

 Customizable Excel Spreadsheet
A condensed, visually segmented Voxel PESTLE summary that teams can share or drop into presentations to enable quick alignment and informed decisions, with editable notes for local context and stakeholder-ready language for meetings.
Economic factors

Inflation and input costs
Energy, consumables and maintenance inflation—often rising 6–10% annually—squeeze margins in scanner-heavy operations; energy can represent 10–15% of imaging center running costs. NFZ contract indexation typically lags 6–12 months, leaving short-term cost spikes uncovered. Tight cost control, energy hedging and long-term service contracts reduce volatility, while procurement scale can secure 5–15% better terms.
Capex intensity and interest rates
MRI/CT replacements are capex‑intensive—CT units cost roughly $250,000–$2M and MRI $1M–$3M—making refresh cycles highly cyclical. Higher financing costs (Fed funds ~5.25–5.50% in 2024–25) extend payback and delay upgrades. Leasing and vendor financing often cover 30–50% upfront, smoothing cash flow. ROI is highly sensitive to utilization; centers typically need ~10–20 scans/day to reach target returns.

Labor market dynamics
Radiologist and technologist scarcity has pushed wages higher, with median radiologist compensation rising roughly 3% in 2024 to about $450,000 and technologist vacancy rates near 10% in many US markets. Teleradiology, a $3.6–4.1B market in 2023–24, arbitrages regional pay gaps but requires 24/7 coverage to be reliable. Productivity tools and AI can cut per‑study read time ~20%, lowering unit costs. Improved retention reduces churn and recruitment spend.

Payer mix and private demand
Payer mix skewed to out-of-pocket and private insurers drives higher-margin volumes, with private payments commonly 10–30% above Medicare-equivalent rates, boosting unit economics for Voxel.
Macroeconomic slowdowns in 2024 have tempered discretionary diagnostics demand, while corporate wellness contracts—a market ~74 billion USD in 2024—offer diversification.
Pricing strategies must balance access and profitability to retain volume without eroding margins.
- Private reimbursement premium: 10–30% vs Medicare
- Corporate wellness market ~74B USD (2024)
- Slower consumer discretionary spend in 2024 reduces elective diagnostics
- Pricing trade-off: volume vs margin
Currency and import exposure
Equipment, parts and software for Voxel are often euro‑denominated; EUR/PLN averaged about 4.60 in 2024 and traded roughly 4.20–4.90 into H1 2025, so PLN swings materially affect capex and multi‑year service contracts.
Natural hedges from euro revenues are limited; targeted forward contracts and FX options can reduce volatility, while vendor renegotiations can shift or share FX risk.
- Euro costs concentrated in capex
- EUR/PLN avg 4.60 in 2024
- Limited natural euro hedge
- Use forwards/options; renegotiate vendors
2024 budget cap PLN 199bn limits imaging; EU funds cut scanner capex
Energy and consumables inflation (6–10% y/y) and energy ≈10–15% of costs compress margins; NFZ indexation lags 6–12 months. High capex (CT $0.25–2M; MRI $1–3M) and Fed funds ~5.25–5.50% (2024–25) lengthen payback; utilization (≈10–20 scans/day) drives ROI. EUR/PLN ~4.60 (2024) lifts euro‑denominated capex; private pay premium 10–30% improves unit economics.
| Metric | Value |
|---|---|
| Energy cost share | 10–15% |
| Inflation | 6–10% y/y |
| CT/MRI capex | $0.25–2M / $1–3M |
| EUR/PLN | 4.60 (2024) |
Full Version Awaits
Voxel PESTLE Analysis
The preview shown here is the exact Voxel PESTLE Analysis document you’ll receive after purchase—fully formatted and ready to use. This screenshot reflects the real, final file with complete content, structure and professional styling. After payment you’ll instantly download the same ready-to-use Voxel PESTLE Analysis shown here, no placeholders or changes.

Your Shortcut to Market Insight Starts Here
Our Voxel PESTLE Analysis highlights key political, economic, and technological trends shaping the company’s prospects. It reveals regulatory risks, market opportunities, and sustainability pressures investors need to know. Purchase the full analysis for detailed, actionable insights and downloadable templates.
Political factors
NFZ reimbursement policy
Public payer NFZ sets pricing and annual volumes for MRI/CT/X‑ray, and the NFZ 2024 budget of ~PLN 199 billion directly constrains reimbursed service capacity. Changes to NFZ budgets or referral pathways rapidly affect Voxel’s throughput and EBITDA margins by shifting payer mix and utilization. Active advocacy and contract mix management are critical to stabilize revenue against policy shifts. Monitoring annual Health Ministry and NFZ plans helps anticipate volume and price changes.
EU healthcare funding flows
EU cohesion policy (~€373bn for 2021–27) and the Recovery and Resilience Facility (€723.8bn) funnel grants into imaging upgrades and digital health; regional grants can co-finance projects (co‑financing up to ~85% in less-developed regions), materially lowering scanner and IT capex. Political focus on oncology and cardiology pathways directs funds toward related investments, while stark regional disparities demand localized lobbying to secure allocations.
Public–private collaboration climate
Government stance on outsourcing diagnostics drives PPP opportunity: with public procurement in the EU amounting to roughly 14% of GDP, favorable Polish policies can translate into larger hospital service contracts and volume growth for providers. Reversals or tighter budgets (Poland health spending ~6.5% of GDP per OECD data) compress referral volumes. Transparency rules in tenders materially affect win rates, and relationship capital with regional authorities influences access to district-level contracts.
Geopolitical stability and security
Regional tensions raise supply-chain and energy-security risks—EU imported about 40% of its gas from Russia in 2021, highlighting vulnerability; policy responses (energy subsidies, export controls) have altered operating costs since 2022. Migration pressures (UNHCR: 117.3 million forcibly displaced at end-2023) raise diagnostic demand in border regions; contingency planning reduces disruption.
- Supply-chain & energy risk
- Policy-driven cost changes
- Migration boosts border diagnostic demand
- Contingency planning mitigates impact
Health system reform trajectory
Centralization of hospital networks changes referral flows, with OECD data showing imaging capacity varies up to tenfold between countries, altering where high-acuity CT/MRI volumes concentrate.
Wait-time guarantees and priority queues (used in 20+ OECD systems by 2023) reallocate diagnostic volumes toward expedited CT/MRI slots.
Expanded preventive screening (breast, lung) shifts modality mix toward mammography and low-dose CT; pilots often scale nationally, forcing rapid capacity planning and capital investment.
2024 budget cap PLN 199bn limits imaging; EU funds cut scanner capex
NFZ 2024 budget ~PLN 199bn constrains reimbursed MRI/CT/X‑ray volumes and margins; policy shifts quickly change payer mix. EU funds (Cohesion €373bn, RRF €723.8bn) lower capex needs for scanners/IT. Public procurement (~14% GDP) and PPP stance affect contract wins; health spend ~6.5% GDP. Energy/imports and migration alter operating costs and regional demand.
| Metric | Value |
|---|---|
| NFZ 2024 budget | ~PLN 199bn |
| EU funds | Cohesion €373bn; RRF €723.8bn |
| Poland health spend | ~6.5% GDP |
What is included in the product
Detailed Word Document
Explores how external macro-environmental factors uniquely affect the Voxel across Political, Economic, Social, Technological, Environmental, and Legal dimensions, with each category expanded into practical sub-points and examples specific to the business and region. Backed by current data and forward-looking insights, this PESTLE helps executives, investors, and strategists identify risks, opportunities, and scenario-driven actions.
Customizable Excel Spreadsheet
A condensed, visually segmented Voxel PESTLE summary that teams can share or drop into presentations to enable quick alignment and informed decisions, with editable notes for local context and stakeholder-ready language for meetings.
Economic factors
Inflation and input costs
Energy, consumables and maintenance inflation—often rising 6–10% annually—squeeze margins in scanner-heavy operations; energy can represent 10–15% of imaging center running costs. NFZ contract indexation typically lags 6–12 months, leaving short-term cost spikes uncovered. Tight cost control, energy hedging and long-term service contracts reduce volatility, while procurement scale can secure 5–15% better terms.
Capex intensity and interest rates
MRI/CT replacements are capex‑intensive—CT units cost roughly $250,000–$2M and MRI $1M–$3M—making refresh cycles highly cyclical. Higher financing costs (Fed funds ~5.25–5.50% in 2024–25) extend payback and delay upgrades. Leasing and vendor financing often cover 30–50% upfront, smoothing cash flow. ROI is highly sensitive to utilization; centers typically need ~10–20 scans/day to reach target returns.
Labor market dynamics
Radiologist and technologist scarcity has pushed wages higher, with median radiologist compensation rising roughly 3% in 2024 to about $450,000 and technologist vacancy rates near 10% in many US markets. Teleradiology, a $3.6–4.1B market in 2023–24, arbitrages regional pay gaps but requires 24/7 coverage to be reliable. Productivity tools and AI can cut per‑study read time ~20%, lowering unit costs. Improved retention reduces churn and recruitment spend.
Payer mix and private demand
Payer mix skewed to out-of-pocket and private insurers drives higher-margin volumes, with private payments commonly 10–30% above Medicare-equivalent rates, boosting unit economics for Voxel.
Macroeconomic slowdowns in 2024 have tempered discretionary diagnostics demand, while corporate wellness contracts—a market ~74 billion USD in 2024—offer diversification.
Pricing strategies must balance access and profitability to retain volume without eroding margins.
- Private reimbursement premium: 10–30% vs Medicare
- Corporate wellness market ~74B USD (2024)
- Slower consumer discretionary spend in 2024 reduces elective diagnostics
- Pricing trade-off: volume vs margin
Currency and import exposure
Equipment, parts and software for Voxel are often euro‑denominated; EUR/PLN averaged about 4.60 in 2024 and traded roughly 4.20–4.90 into H1 2025, so PLN swings materially affect capex and multi‑year service contracts.
Natural hedges from euro revenues are limited; targeted forward contracts and FX options can reduce volatility, while vendor renegotiations can shift or share FX risk.
- Euro costs concentrated in capex
- EUR/PLN avg 4.60 in 2024
- Limited natural euro hedge
- Use forwards/options; renegotiate vendors
2024 budget cap PLN 199bn limits imaging; EU funds cut scanner capex
Energy and consumables inflation (6–10% y/y) and energy ≈10–15% of costs compress margins; NFZ indexation lags 6–12 months. High capex (CT $0.25–2M; MRI $1–3M) and Fed funds ~5.25–5.50% (2024–25) lengthen payback; utilization (≈10–20 scans/day) drives ROI. EUR/PLN ~4.60 (2024) lifts euro‑denominated capex; private pay premium 10–30% improves unit economics.
| Metric | Value |
|---|---|
| Energy cost share | 10–15% |
| Inflation | 6–10% y/y |
| CT/MRI capex | $0.25–2M / $1–3M |
| EUR/PLN | 4.60 (2024) |
Full Version Awaits
Voxel PESTLE Analysis
The preview shown here is the exact Voxel PESTLE Analysis document you’ll receive after purchase—fully formatted and ready to use. This screenshot reflects the real, final file with complete content, structure and professional styling. After payment you’ll instantly download the same ready-to-use Voxel PESTLE Analysis shown here, no placeholders or changes.
Original: $10.00
-65%$10.00
$3.50Description
Your Shortcut to Market Insight Starts Here
Our Voxel PESTLE Analysis highlights key political, economic, and technological trends shaping the company’s prospects. It reveals regulatory risks, market opportunities, and sustainability pressures investors need to know. Purchase the full analysis for detailed, actionable insights and downloadable templates.
Political factors
NFZ reimbursement policy
Public payer NFZ sets pricing and annual volumes for MRI/CT/X‑ray, and the NFZ 2024 budget of ~PLN 199 billion directly constrains reimbursed service capacity. Changes to NFZ budgets or referral pathways rapidly affect Voxel’s throughput and EBITDA margins by shifting payer mix and utilization. Active advocacy and contract mix management are critical to stabilize revenue against policy shifts. Monitoring annual Health Ministry and NFZ plans helps anticipate volume and price changes.
EU healthcare funding flows
EU cohesion policy (~€373bn for 2021–27) and the Recovery and Resilience Facility (€723.8bn) funnel grants into imaging upgrades and digital health; regional grants can co-finance projects (co‑financing up to ~85% in less-developed regions), materially lowering scanner and IT capex. Political focus on oncology and cardiology pathways directs funds toward related investments, while stark regional disparities demand localized lobbying to secure allocations.
Public–private collaboration climate
Government stance on outsourcing diagnostics drives PPP opportunity: with public procurement in the EU amounting to roughly 14% of GDP, favorable Polish policies can translate into larger hospital service contracts and volume growth for providers. Reversals or tighter budgets (Poland health spending ~6.5% of GDP per OECD data) compress referral volumes. Transparency rules in tenders materially affect win rates, and relationship capital with regional authorities influences access to district-level contracts.
Geopolitical stability and security
Regional tensions raise supply-chain and energy-security risks—EU imported about 40% of its gas from Russia in 2021, highlighting vulnerability; policy responses (energy subsidies, export controls) have altered operating costs since 2022. Migration pressures (UNHCR: 117.3 million forcibly displaced at end-2023) raise diagnostic demand in border regions; contingency planning reduces disruption.
- Supply-chain & energy risk
- Policy-driven cost changes
- Migration boosts border diagnostic demand
- Contingency planning mitigates impact
Health system reform trajectory
Centralization of hospital networks changes referral flows, with OECD data showing imaging capacity varies up to tenfold between countries, altering where high-acuity CT/MRI volumes concentrate.
Wait-time guarantees and priority queues (used in 20+ OECD systems by 2023) reallocate diagnostic volumes toward expedited CT/MRI slots.
Expanded preventive screening (breast, lung) shifts modality mix toward mammography and low-dose CT; pilots often scale nationally, forcing rapid capacity planning and capital investment.
2024 budget cap PLN 199bn limits imaging; EU funds cut scanner capex
NFZ 2024 budget ~PLN 199bn constrains reimbursed MRI/CT/X‑ray volumes and margins; policy shifts quickly change payer mix. EU funds (Cohesion €373bn, RRF €723.8bn) lower capex needs for scanners/IT. Public procurement (~14% GDP) and PPP stance affect contract wins; health spend ~6.5% GDP. Energy/imports and migration alter operating costs and regional demand.
| Metric | Value |
|---|---|
| NFZ 2024 budget | ~PLN 199bn |
| EU funds | Cohesion €373bn; RRF €723.8bn |
| Poland health spend | ~6.5% GDP |
What is included in the product
Detailed Word Document
Explores how external macro-environmental factors uniquely affect the Voxel across Political, Economic, Social, Technological, Environmental, and Legal dimensions, with each category expanded into practical sub-points and examples specific to the business and region. Backed by current data and forward-looking insights, this PESTLE helps executives, investors, and strategists identify risks, opportunities, and scenario-driven actions.
Customizable Excel Spreadsheet
A condensed, visually segmented Voxel PESTLE summary that teams can share or drop into presentations to enable quick alignment and informed decisions, with editable notes for local context and stakeholder-ready language for meetings.
Economic factors
Inflation and input costs
Energy, consumables and maintenance inflation—often rising 6–10% annually—squeeze margins in scanner-heavy operations; energy can represent 10–15% of imaging center running costs. NFZ contract indexation typically lags 6–12 months, leaving short-term cost spikes uncovered. Tight cost control, energy hedging and long-term service contracts reduce volatility, while procurement scale can secure 5–15% better terms.
Capex intensity and interest rates
MRI/CT replacements are capex‑intensive—CT units cost roughly $250,000–$2M and MRI $1M–$3M—making refresh cycles highly cyclical. Higher financing costs (Fed funds ~5.25–5.50% in 2024–25) extend payback and delay upgrades. Leasing and vendor financing often cover 30–50% upfront, smoothing cash flow. ROI is highly sensitive to utilization; centers typically need ~10–20 scans/day to reach target returns.
Labor market dynamics
Radiologist and technologist scarcity has pushed wages higher, with median radiologist compensation rising roughly 3% in 2024 to about $450,000 and technologist vacancy rates near 10% in many US markets. Teleradiology, a $3.6–4.1B market in 2023–24, arbitrages regional pay gaps but requires 24/7 coverage to be reliable. Productivity tools and AI can cut per‑study read time ~20%, lowering unit costs. Improved retention reduces churn and recruitment spend.
Payer mix and private demand
Payer mix skewed to out-of-pocket and private insurers drives higher-margin volumes, with private payments commonly 10–30% above Medicare-equivalent rates, boosting unit economics for Voxel.
Macroeconomic slowdowns in 2024 have tempered discretionary diagnostics demand, while corporate wellness contracts—a market ~74 billion USD in 2024—offer diversification.
Pricing strategies must balance access and profitability to retain volume without eroding margins.
- Private reimbursement premium: 10–30% vs Medicare
- Corporate wellness market ~74B USD (2024)
- Slower consumer discretionary spend in 2024 reduces elective diagnostics
- Pricing trade-off: volume vs margin
Currency and import exposure
Equipment, parts and software for Voxel are often euro‑denominated; EUR/PLN averaged about 4.60 in 2024 and traded roughly 4.20–4.90 into H1 2025, so PLN swings materially affect capex and multi‑year service contracts.
Natural hedges from euro revenues are limited; targeted forward contracts and FX options can reduce volatility, while vendor renegotiations can shift or share FX risk.
- Euro costs concentrated in capex
- EUR/PLN avg 4.60 in 2024
- Limited natural euro hedge
- Use forwards/options; renegotiate vendors
2024 budget cap PLN 199bn limits imaging; EU funds cut scanner capex
Energy and consumables inflation (6–10% y/y) and energy ≈10–15% of costs compress margins; NFZ indexation lags 6–12 months. High capex (CT $0.25–2M; MRI $1–3M) and Fed funds ~5.25–5.50% (2024–25) lengthen payback; utilization (≈10–20 scans/day) drives ROI. EUR/PLN ~4.60 (2024) lifts euro‑denominated capex; private pay premium 10–30% improves unit economics.
| Metric | Value |
|---|---|
| Energy cost share | 10–15% |
| Inflation | 6–10% y/y |
| CT/MRI capex | $0.25–2M / $1–3M |
| EUR/PLN | 4.60 (2024) |
Full Version Awaits
Voxel PESTLE Analysis
The preview shown here is the exact Voxel PESTLE Analysis document you’ll receive after purchase—fully formatted and ready to use. This screenshot reflects the real, final file with complete content, structure and professional styling. After payment you’ll instantly download the same ready-to-use Voxel PESTLE Analysis shown here, no placeholders or changes.











