VPG Porter's Five Forces Analysis

A Must-Have Tool for Decision-Makers
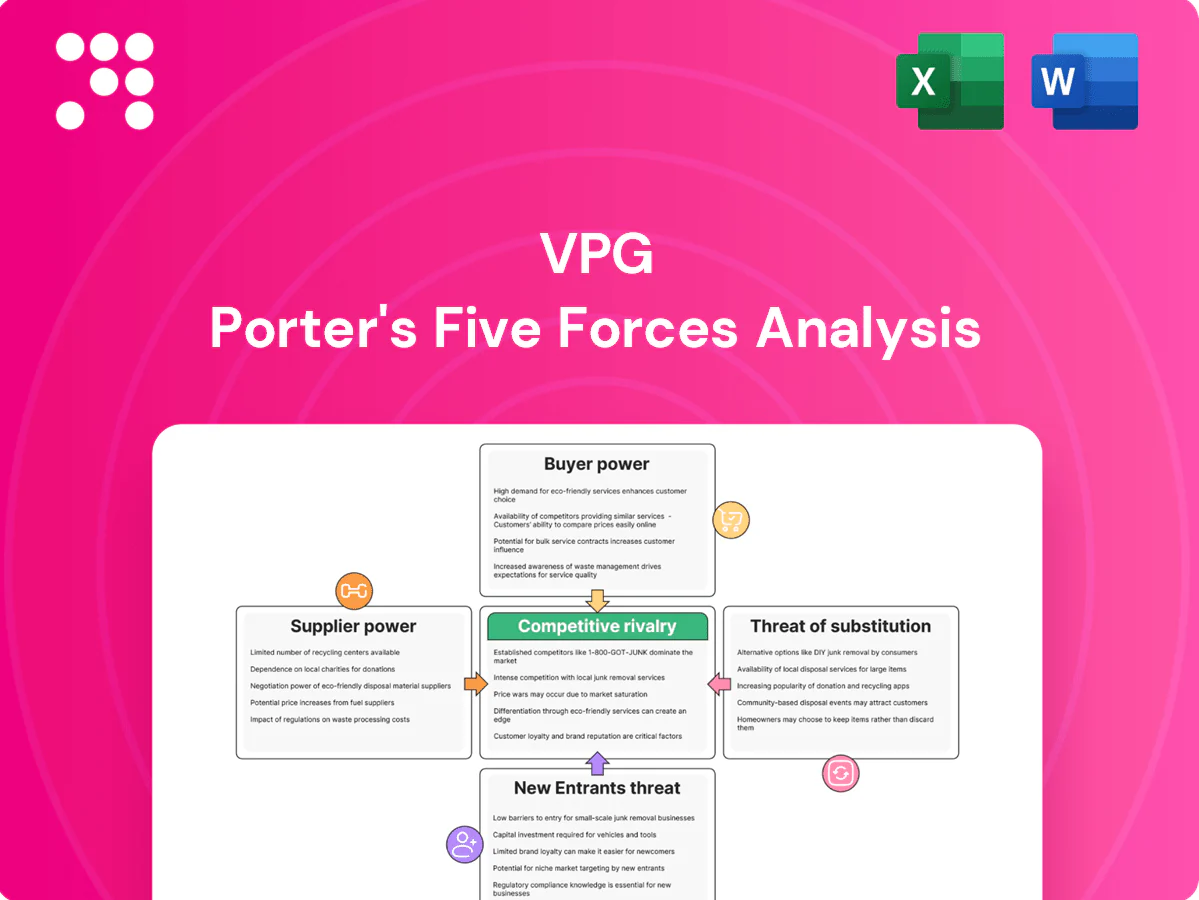
VPG’s Porter's Five Forces snapshot highlights key competitive pressures shaping its market position, from buyer leverage to competitive rivalry. The brief identifies threats like substitutes and potential entrants while noting supplier influence and industry intensity. This preview only scratches the surface—unlock the full Porter's Five Forces Analysis for force-by-force ratings, visuals, and actionable strategy insights.
Suppliers Bargaining Power

Specialty alloy and foil dependence
Ultra-flat precision foils and niche alloys (e.g., NiCr, Constantan) come from a highly concentrated supplier base, elevating supplier leverage; tight specs such as tolerances around ±0.1% and TCRs below 50 ppm/°C limit substitution. Long lead times of 12–20 weeks amplify schedule risk and force buffer inventories of 3–6 months. VPG reduces exposure via multi-sourcing and qualifying alternates, but switching remains slow and costly.
Process chemicals and photolithography inputs
Photoresists, etchants and high‑purity chemicals from major suppliers such as Merck, JSR and Fujifilm are critical to foil resistor and strain gage fabrication, and quality drift can cut yields and give suppliers leverage on specs and pricing. Regulatory compliance (RoHS/REACH) has narrowed the pool of approved inputs, and long validation cycles of roughly 6–18 months further reduce VPG’s negotiating flexibility.

Precision manufacturing equipment vendors
Custom tooling, metrology and laser-trimming systems come from specialized OEMs with typical capex of $0.2–$2.0M per line, and integration complexity creates quasi-lock-in. Service contracts and spare parts—with aftermarket margins often 30–50%—can add roughly 20–40% to lifecycle costs. VPG limits exposure through preventive maintenance programs and dual-vendor sourcing where technically feasible.

Geopolitical and logistics exposure
Metals and chemicals face geopolitical, tariff, and freight volatility that suppliers can pass through. US steel tariffs remain at 25% and aluminum at 10% (2024), while container spot rates in 2024 sat roughly 50–70% below 2021 peaks, leaving uneven pass-through risk. Regional supplier concentration heightens disruption risk; VPG’s global footprint can rebalance sourcing but qualification barriers slow pivots. Hedging and long-term agreements partially stabilize costs.
- Tariffs: US steel 25%, aluminum 10% (2024)
- Freight: 2024 container rates ~50–70% below 2021 peaks
- Sourcing: regional concentration raises disruption risk; global footprint aids rebalancing
- Mitigation: hedges and long-term contracts provide partial cost stability
Switching costs and qualification
Changing upstream specs requires formal requalification to preserve performance and certifications, typically delaying transitions by 3–9 months and tempering buyer price pushback; in 2024, 68% of manufacturing procurement teams cited qualification timelines as the top barrier to supplier change.
- Requalification delays: 3–9 months
- Buyer resistance falls as change costs rise
- Suppliers leverage known change costs to strengthen pricing
- Scorecards and VMI cut friction but not dependency
Supplier power: 12–20 weeks, 3–9 month requal, 30–50% margins
Supplier power is high due to concentrated specialty foil/alloy and chemical suppliers, tight specs and long lead times (12–20 weeks) that limit substitution. Requalification delays (3–9 months) and regulatory constraints (RoHS/REACH) increase switching costs; aftermarket margins of 30–50% and 2024 tariffs (US steel 25%, aluminum 10%) elevate pass-through risk. VPG mitigates via multi-sourcing, hedges and long-term contracts.
| Metric | 2024 Value | Impact |
|---|---|---|
| Lead time | 12–20 weeks | Inventory buffer 3–6 months |
| Requalification | 3–9 months | Limits switching |
| Aftermarket margin | 30–50% | Higher lifecycle cost |
| Tariffs | Steel 25%, Al 10% | Cost pass-through |
What is included in the product
 Detailed Word Document
Uncovers key drivers of competition, customer influence, and market entry risks tailored to VPG; evaluates supplier and buyer power, threat of substitutes and entrants, and competitive rivalry to reveal pricing, profitability, and strategic vulnerabilities.

 Customizable Excel Spreadsheet
VPG Porter's Five Forces delivers a single-sheet, customizable snapshot of competitive pressure—complete with an instant spider chart—so teams can quickly assess threats, adapt assumptions, and paste-ready slides for fast decision-making.
Customers Bargaining Power

Concentrated OEM customers
Aerospace, medical and automotive OEMs are large, sophisticated buyers with strong procurement leverage: by 2024 Boeing and Airbus together held roughly 85% of the large commercial aircraft market, the top five auto OEMs produced about 50% of global light vehicles, and the top 10 medtech firms accounted for roughly 60% of device revenue. Their volume commitments drive pricing pressure and tighter service terms, and consolidation increases negotiating clout. Design-in status and Tier‑1 performance differentiation, however, limit pure price competition by raising switching costs and protecting margin for specialized suppliers.
High switching costs via design-in
Precision resistors, strain gages and transducers are typically design‑in components with qualification cycles in 2024 commonly spanning 6–18 months, creating high switching costs. Requalification, compliance and downtime often deter changes, with requalification programs regularly costing six figures and line downtime measured in thousands per day, lowering buyer power post‑design‑in. Upfront, buyers push for NPI samples and 5–15% price concessions to win the socket.

Quality, traceability, and certification demands
Buyers demand AS9100 and ISO 13485 certification plus AIAG PPAP-level documentation (levels 1–4), raising service intensity and documentation burden. Customers expect tight process capability (Cpk commonly ≥1.33 and ≥1.67 for critical features), full lot traceability and root-cause failure analysis support. These requirements increase VPG’s cost-to-serve and give buyers negotiation levers; conversely, demonstrable premium reliability enables value-based pricing.

Total cost and performance trade-offs
End-users trade accuracy, stability and drift against unit price; in 2024 regulated and mission-critical buyers increasingly prioritize performance and accept higher premiums, reducing their bargaining leverage, while cost-sensitive industrial purchasers drive competitive bid processes.
- Performance-sensitive: lower buyer power
- Cost-sensitive: competitive bidding
- Lifecycle costs (calibration, failures) shape final terms
Channel dynamics and lead-time expectations
Distributors and integrators aggregate demand to extract 5–15% volume discounts; buyers increasingly demand lead times under 4 weeks and implement buffer-stock equal to ~15–20% of monthly usage. OTIF targets near 95% drive penalties typically 1–3% of invoice value and determine preferred-vendor status. Long-term contracts with CPI-linked clauses (CPI ~3–4% in 2024) reduce price volatility but cap upside.
- Aggregated discounts: 5–15%
- Lead-time expectation: <4 weeks
- Buffer stock: 15–20% monthly usage
- OTIF target: ~95%; penalties 1–3%
- Price indexation: CPI ~3–4% (2024)
Concentrated OEMs wield big leverage; suppliers face 5-15% discounts
Large OEMs and distributors wield strong leverage—Boeing+Airbus ~85% large-aircraft, top auto OEMs ~50% vehicles—pressuring prices and terms, while design‑in, certifications and long qualification (6–18 months) raise switching costs and protect specialized suppliers. Buyers extract 5–15% discounts, demand <4‑week lead times and ~95% OTIF; performance‑sensitive buyers accept premiums, lowering their bargaining power.
| Buyer | Leverage | 2024 metric |
|---|---|---|
| Large OEMs | High | Market share concentration: 85%/50% |
| Distributors | Medium | Discounts 5–15% |
| Buyers | Operational | Lead time <4w; OTIF ~95% |
Preview the Actual Deliverable
VPG Porter's Five Forces Analysis
This preview shows the exact VPG Porter's Five Forces Analysis you'll receive immediately after purchase—no surprises, no placeholders. The document displayed here is the fully formatted, professional analysis ready for download and use the moment you buy. You're viewing the complete deliverable: the same file you'll get instantly after payment.

A Must-Have Tool for Decision-Makers
VPG’s Porter's Five Forces snapshot highlights key competitive pressures shaping its market position, from buyer leverage to competitive rivalry. The brief identifies threats like substitutes and potential entrants while noting supplier influence and industry intensity. This preview only scratches the surface—unlock the full Porter's Five Forces Analysis for force-by-force ratings, visuals, and actionable strategy insights.
Suppliers Bargaining Power
Specialty alloy and foil dependence
Ultra-flat precision foils and niche alloys (e.g., NiCr, Constantan) come from a highly concentrated supplier base, elevating supplier leverage; tight specs such as tolerances around ±0.1% and TCRs below 50 ppm/°C limit substitution. Long lead times of 12–20 weeks amplify schedule risk and force buffer inventories of 3–6 months. VPG reduces exposure via multi-sourcing and qualifying alternates, but switching remains slow and costly.
Process chemicals and photolithography inputs
Photoresists, etchants and high‑purity chemicals from major suppliers such as Merck, JSR and Fujifilm are critical to foil resistor and strain gage fabrication, and quality drift can cut yields and give suppliers leverage on specs and pricing. Regulatory compliance (RoHS/REACH) has narrowed the pool of approved inputs, and long validation cycles of roughly 6–18 months further reduce VPG’s negotiating flexibility.
Precision manufacturing equipment vendors
Custom tooling, metrology and laser-trimming systems come from specialized OEMs with typical capex of $0.2–$2.0M per line, and integration complexity creates quasi-lock-in. Service contracts and spare parts—with aftermarket margins often 30–50%—can add roughly 20–40% to lifecycle costs. VPG limits exposure through preventive maintenance programs and dual-vendor sourcing where technically feasible.
Geopolitical and logistics exposure
Metals and chemicals face geopolitical, tariff, and freight volatility that suppliers can pass through. US steel tariffs remain at 25% and aluminum at 10% (2024), while container spot rates in 2024 sat roughly 50–70% below 2021 peaks, leaving uneven pass-through risk. Regional supplier concentration heightens disruption risk; VPG’s global footprint can rebalance sourcing but qualification barriers slow pivots. Hedging and long-term agreements partially stabilize costs.
- Tariffs: US steel 25%, aluminum 10% (2024)
- Freight: 2024 container rates ~50–70% below 2021 peaks
- Sourcing: regional concentration raises disruption risk; global footprint aids rebalancing
- Mitigation: hedges and long-term contracts provide partial cost stability
Switching costs and qualification
Changing upstream specs requires formal requalification to preserve performance and certifications, typically delaying transitions by 3–9 months and tempering buyer price pushback; in 2024, 68% of manufacturing procurement teams cited qualification timelines as the top barrier to supplier change.
- Requalification delays: 3–9 months
- Buyer resistance falls as change costs rise
- Suppliers leverage known change costs to strengthen pricing
- Scorecards and VMI cut friction but not dependency
Supplier power: 12–20 weeks, 3–9 month requal, 30–50% margins
Supplier power is high due to concentrated specialty foil/alloy and chemical suppliers, tight specs and long lead times (12–20 weeks) that limit substitution. Requalification delays (3–9 months) and regulatory constraints (RoHS/REACH) increase switching costs; aftermarket margins of 30–50% and 2024 tariffs (US steel 25%, aluminum 10%) elevate pass-through risk. VPG mitigates via multi-sourcing, hedges and long-term contracts.
| Metric | 2024 Value | Impact |
|---|---|---|
| Lead time | 12–20 weeks | Inventory buffer 3–6 months |
| Requalification | 3–9 months | Limits switching |
| Aftermarket margin | 30–50% | Higher lifecycle cost |
| Tariffs | Steel 25%, Al 10% | Cost pass-through |
What is included in the product
Detailed Word Document
Uncovers key drivers of competition, customer influence, and market entry risks tailored to VPG; evaluates supplier and buyer power, threat of substitutes and entrants, and competitive rivalry to reveal pricing, profitability, and strategic vulnerabilities.
Customizable Excel Spreadsheet
VPG Porter's Five Forces delivers a single-sheet, customizable snapshot of competitive pressure—complete with an instant spider chart—so teams can quickly assess threats, adapt assumptions, and paste-ready slides for fast decision-making.
Customers Bargaining Power
Concentrated OEM customers
Aerospace, medical and automotive OEMs are large, sophisticated buyers with strong procurement leverage: by 2024 Boeing and Airbus together held roughly 85% of the large commercial aircraft market, the top five auto OEMs produced about 50% of global light vehicles, and the top 10 medtech firms accounted for roughly 60% of device revenue. Their volume commitments drive pricing pressure and tighter service terms, and consolidation increases negotiating clout. Design-in status and Tier‑1 performance differentiation, however, limit pure price competition by raising switching costs and protecting margin for specialized suppliers.
High switching costs via design-in
Precision resistors, strain gages and transducers are typically design‑in components with qualification cycles in 2024 commonly spanning 6–18 months, creating high switching costs. Requalification, compliance and downtime often deter changes, with requalification programs regularly costing six figures and line downtime measured in thousands per day, lowering buyer power post‑design‑in. Upfront, buyers push for NPI samples and 5–15% price concessions to win the socket.
Quality, traceability, and certification demands
Buyers demand AS9100 and ISO 13485 certification plus AIAG PPAP-level documentation (levels 1–4), raising service intensity and documentation burden. Customers expect tight process capability (Cpk commonly ≥1.33 and ≥1.67 for critical features), full lot traceability and root-cause failure analysis support. These requirements increase VPG’s cost-to-serve and give buyers negotiation levers; conversely, demonstrable premium reliability enables value-based pricing.
Total cost and performance trade-offs
End-users trade accuracy, stability and drift against unit price; in 2024 regulated and mission-critical buyers increasingly prioritize performance and accept higher premiums, reducing their bargaining leverage, while cost-sensitive industrial purchasers drive competitive bid processes.
- Performance-sensitive: lower buyer power
- Cost-sensitive: competitive bidding
- Lifecycle costs (calibration, failures) shape final terms
Channel dynamics and lead-time expectations
Distributors and integrators aggregate demand to extract 5–15% volume discounts; buyers increasingly demand lead times under 4 weeks and implement buffer-stock equal to ~15–20% of monthly usage. OTIF targets near 95% drive penalties typically 1–3% of invoice value and determine preferred-vendor status. Long-term contracts with CPI-linked clauses (CPI ~3–4% in 2024) reduce price volatility but cap upside.
- Aggregated discounts: 5–15%
- Lead-time expectation: <4 weeks
- Buffer stock: 15–20% monthly usage
- OTIF target: ~95%; penalties 1–3%
- Price indexation: CPI ~3–4% (2024)
Concentrated OEMs wield big leverage; suppliers face 5-15% discounts
Large OEMs and distributors wield strong leverage—Boeing+Airbus ~85% large-aircraft, top auto OEMs ~50% vehicles—pressuring prices and terms, while design‑in, certifications and long qualification (6–18 months) raise switching costs and protect specialized suppliers. Buyers extract 5–15% discounts, demand <4‑week lead times and ~95% OTIF; performance‑sensitive buyers accept premiums, lowering their bargaining power.
| Buyer | Leverage | 2024 metric |
|---|---|---|
| Large OEMs | High | Market share concentration: 85%/50% |
| Distributors | Medium | Discounts 5–15% |
| Buyers | Operational | Lead time <4w; OTIF ~95% |
Preview the Actual Deliverable
VPG Porter's Five Forces Analysis
This preview shows the exact VPG Porter's Five Forces Analysis you'll receive immediately after purchase—no surprises, no placeholders. The document displayed here is the fully formatted, professional analysis ready for download and use the moment you buy. You're viewing the complete deliverable: the same file you'll get instantly after payment.
Description
A Must-Have Tool for Decision-Makers
VPG’s Porter's Five Forces snapshot highlights key competitive pressures shaping its market position, from buyer leverage to competitive rivalry. The brief identifies threats like substitutes and potential entrants while noting supplier influence and industry intensity. This preview only scratches the surface—unlock the full Porter's Five Forces Analysis for force-by-force ratings, visuals, and actionable strategy insights.
Suppliers Bargaining Power
Specialty alloy and foil dependence
Ultra-flat precision foils and niche alloys (e.g., NiCr, Constantan) come from a highly concentrated supplier base, elevating supplier leverage; tight specs such as tolerances around ±0.1% and TCRs below 50 ppm/°C limit substitution. Long lead times of 12–20 weeks amplify schedule risk and force buffer inventories of 3–6 months. VPG reduces exposure via multi-sourcing and qualifying alternates, but switching remains slow and costly.
Process chemicals and photolithography inputs
Photoresists, etchants and high‑purity chemicals from major suppliers such as Merck, JSR and Fujifilm are critical to foil resistor and strain gage fabrication, and quality drift can cut yields and give suppliers leverage on specs and pricing. Regulatory compliance (RoHS/REACH) has narrowed the pool of approved inputs, and long validation cycles of roughly 6–18 months further reduce VPG’s negotiating flexibility.
Precision manufacturing equipment vendors
Custom tooling, metrology and laser-trimming systems come from specialized OEMs with typical capex of $0.2–$2.0M per line, and integration complexity creates quasi-lock-in. Service contracts and spare parts—with aftermarket margins often 30–50%—can add roughly 20–40% to lifecycle costs. VPG limits exposure through preventive maintenance programs and dual-vendor sourcing where technically feasible.
Geopolitical and logistics exposure
Metals and chemicals face geopolitical, tariff, and freight volatility that suppliers can pass through. US steel tariffs remain at 25% and aluminum at 10% (2024), while container spot rates in 2024 sat roughly 50–70% below 2021 peaks, leaving uneven pass-through risk. Regional supplier concentration heightens disruption risk; VPG’s global footprint can rebalance sourcing but qualification barriers slow pivots. Hedging and long-term agreements partially stabilize costs.
- Tariffs: US steel 25%, aluminum 10% (2024)
- Freight: 2024 container rates ~50–70% below 2021 peaks
- Sourcing: regional concentration raises disruption risk; global footprint aids rebalancing
- Mitigation: hedges and long-term contracts provide partial cost stability
Switching costs and qualification
Changing upstream specs requires formal requalification to preserve performance and certifications, typically delaying transitions by 3–9 months and tempering buyer price pushback; in 2024, 68% of manufacturing procurement teams cited qualification timelines as the top barrier to supplier change.
- Requalification delays: 3–9 months
- Buyer resistance falls as change costs rise
- Suppliers leverage known change costs to strengthen pricing
- Scorecards and VMI cut friction but not dependency
Supplier power: 12–20 weeks, 3–9 month requal, 30–50% margins
Supplier power is high due to concentrated specialty foil/alloy and chemical suppliers, tight specs and long lead times (12–20 weeks) that limit substitution. Requalification delays (3–9 months) and regulatory constraints (RoHS/REACH) increase switching costs; aftermarket margins of 30–50% and 2024 tariffs (US steel 25%, aluminum 10%) elevate pass-through risk. VPG mitigates via multi-sourcing, hedges and long-term contracts.
| Metric | 2024 Value | Impact |
|---|---|---|
| Lead time | 12–20 weeks | Inventory buffer 3–6 months |
| Requalification | 3–9 months | Limits switching |
| Aftermarket margin | 30–50% | Higher lifecycle cost |
| Tariffs | Steel 25%, Al 10% | Cost pass-through |
What is included in the product
Detailed Word Document
Uncovers key drivers of competition, customer influence, and market entry risks tailored to VPG; evaluates supplier and buyer power, threat of substitutes and entrants, and competitive rivalry to reveal pricing, profitability, and strategic vulnerabilities.
Customizable Excel Spreadsheet
VPG Porter's Five Forces delivers a single-sheet, customizable snapshot of competitive pressure—complete with an instant spider chart—so teams can quickly assess threats, adapt assumptions, and paste-ready slides for fast decision-making.
Customers Bargaining Power
Concentrated OEM customers
Aerospace, medical and automotive OEMs are large, sophisticated buyers with strong procurement leverage: by 2024 Boeing and Airbus together held roughly 85% of the large commercial aircraft market, the top five auto OEMs produced about 50% of global light vehicles, and the top 10 medtech firms accounted for roughly 60% of device revenue. Their volume commitments drive pricing pressure and tighter service terms, and consolidation increases negotiating clout. Design-in status and Tier‑1 performance differentiation, however, limit pure price competition by raising switching costs and protecting margin for specialized suppliers.
High switching costs via design-in
Precision resistors, strain gages and transducers are typically design‑in components with qualification cycles in 2024 commonly spanning 6–18 months, creating high switching costs. Requalification, compliance and downtime often deter changes, with requalification programs regularly costing six figures and line downtime measured in thousands per day, lowering buyer power post‑design‑in. Upfront, buyers push for NPI samples and 5–15% price concessions to win the socket.
Quality, traceability, and certification demands
Buyers demand AS9100 and ISO 13485 certification plus AIAG PPAP-level documentation (levels 1–4), raising service intensity and documentation burden. Customers expect tight process capability (Cpk commonly ≥1.33 and ≥1.67 for critical features), full lot traceability and root-cause failure analysis support. These requirements increase VPG’s cost-to-serve and give buyers negotiation levers; conversely, demonstrable premium reliability enables value-based pricing.
Total cost and performance trade-offs
End-users trade accuracy, stability and drift against unit price; in 2024 regulated and mission-critical buyers increasingly prioritize performance and accept higher premiums, reducing their bargaining leverage, while cost-sensitive industrial purchasers drive competitive bid processes.
- Performance-sensitive: lower buyer power
- Cost-sensitive: competitive bidding
- Lifecycle costs (calibration, failures) shape final terms
Channel dynamics and lead-time expectations
Distributors and integrators aggregate demand to extract 5–15% volume discounts; buyers increasingly demand lead times under 4 weeks and implement buffer-stock equal to ~15–20% of monthly usage. OTIF targets near 95% drive penalties typically 1–3% of invoice value and determine preferred-vendor status. Long-term contracts with CPI-linked clauses (CPI ~3–4% in 2024) reduce price volatility but cap upside.
- Aggregated discounts: 5–15%
- Lead-time expectation: <4 weeks
- Buffer stock: 15–20% monthly usage
- OTIF target: ~95%; penalties 1–3%
- Price indexation: CPI ~3–4% (2024)
Concentrated OEMs wield big leverage; suppliers face 5-15% discounts
Large OEMs and distributors wield strong leverage—Boeing+Airbus ~85% large-aircraft, top auto OEMs ~50% vehicles—pressuring prices and terms, while design‑in, certifications and long qualification (6–18 months) raise switching costs and protect specialized suppliers. Buyers extract 5–15% discounts, demand <4‑week lead times and ~95% OTIF; performance‑sensitive buyers accept premiums, lowering their bargaining power.
| Buyer | Leverage | 2024 metric |
|---|---|---|
| Large OEMs | High | Market share concentration: 85%/50% |
| Distributors | Medium | Discounts 5–15% |
| Buyers | Operational | Lead time <4w; OTIF ~95% |
Preview the Actual Deliverable
VPG Porter's Five Forces Analysis
This preview shows the exact VPG Porter's Five Forces Analysis you'll receive immediately after purchase—no surprises, no placeholders. The document displayed here is the fully formatted, professional analysis ready for download and use the moment you buy. You're viewing the complete deliverable: the same file you'll get instantly after payment.











