Wabag Boston Consulting Group Matrix

Unlock Strategic Clarity
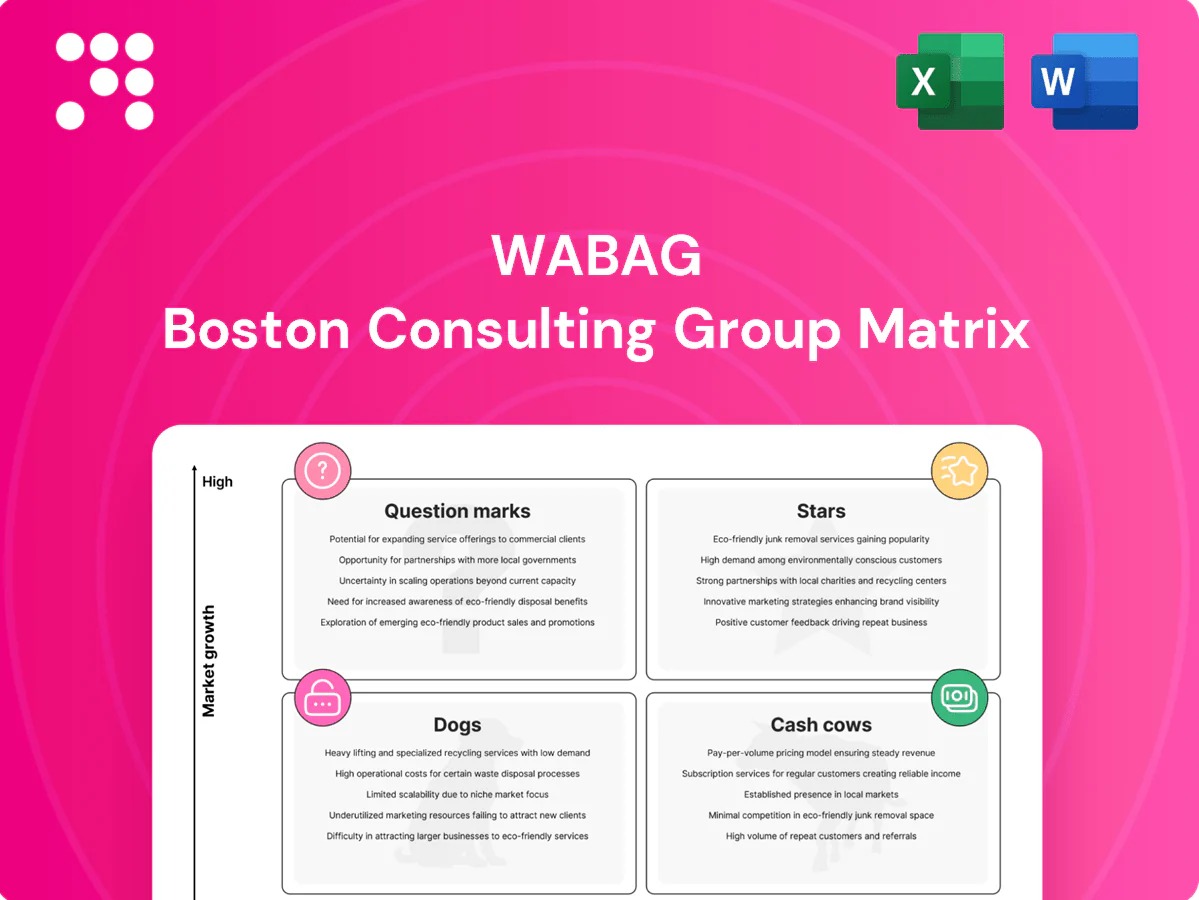
Want a quick, honest read on where Wabag’s products sit—Stars, Cash Cows, Dogs, or Question Marks? This snapshot teases the signals; the full Wabag BCG Matrix gives you quadrant-by-quadrant placement, actionable recommendations, and a ready-to-use Word report plus an Excel summary. Skip the guesswork—buy the full matrix for data-backed strategy you can implement right away. It’s pragmatic, visual, and built to help you decide where to invest, divest, or double down.
Stars

Large municipal wastewater EPC in high-growth regions
These large municipal wastewater EPCs sit squarely in fast-growing urban centers — 56% of the world lived in cities in 2024 (≈4.5bn), driving exploding demand for municipal sanitation. Wabag’s scale and references sustain healthy win rates and pipeline conversion, but projects require steady bid investment and flawless execution so cash-in closely matches cash-out. Hold share now; they compound into long-term market leadership.
Seawater desalination mega-projects in water-scarce markets
Middle East, North Africa and parts of India offer a strong growth runway as the global desalination market was estimated at about USD 15.6 billion in 2024; MENA remains the largest regional demand base. WABAG’s tech partnerships and delivery track record position it near the front of the pack, supported by a multi-year project pipeline. Capex-heavy bids require aggressive working capital and tight risk control; keep investing to convert pipeline into sustained dominance.

Industrial water reuse for heavy industries
Refining, chemicals and metals face rising regulatory and cost pressure to recycle as industry accounts for about 22% of global freshwater withdrawals (UN data); Wabag’s process know-how enables high-recovery systems that command premium pricing and higher margin projects. Sales cycles remain long but order visibility and project volumes rose in 2024 as clients prioritize circular water strategies. Aggressive marketing and deployment of reference plants is essential to lock share before rivals scale up.

Advanced membrane/MBR solutions
High-performance membranes and MBRs are becoming the default for space-limited, high-quality effluent, delivering >99% pathogen removal and compact footprints that can cut plant area by ~50%. Wabag’s end-to-end integration and O&M capability is a clear differentiator. Scaling is capital- and talent-intensive, soaking cash while revenue ramps; early backing can convert into a sustainable margin engine.
- Market fit: space-limited, high-quality demand
- Tech edge: >99% pathogen removal
- Wabag strength: systems integration + O&M
- Investment profile: high capex/talent, cash burn then margin
Design–build–operate concessions with performance guarantees
Design–build–operate concessions with performance guarantees fit where municipalities buy outcomes not equipment; Wabag’s model leverages 10–25 year contracts and presence in 30+ countries to capture lifecycle value. Strong lifetime revenues create stickiness and defensible positions, but require upfront capex, bonding and deep O&M capability. Maintaining service KPIs converts these into annuity-style revenue streams.
- 10–25 year contracts
- 30+ country footprint
- Requires upfront capex & bonding
- Drives annuity-style lifetime value
Urban surge fuels sanitation & desal — 56% (~4.5bn), USD15.6bn
Wabag’s municipal EPCs and desal Stars sit in fast urban growth: 56% of world in cities in 2024 (~4.5bn), driving large sanitation demand. Desal market ≈USD15.6bn in 2024 with MENA lead; Wabag’s 30+ country footprint, 10–25yr concessions and systems/O&M edge support high-margin scale but require upfront capex and working-capital intensity.
| Metric | 2024 |
|---|---|
| Urban population | 56% (~4.5bn) |
| Desal market | USD15.6bn |
| Footprint | 30+ countries |
| Contract length | 10–25 yrs |
What is included in the product
 Detailed Word Document
In-depth BCG Matrix review of Wabag’s units with strategic guidance on Stars, Cash Cows, Question Marks and Dogs.

 Customizable Excel Spreadsheet
One-page Wabag BCG Matrix that clears strategic clutter—spot growth gaps fast and calm stakeholder debates.
Cash Cows

Long-term O&M contracts for existing plants
Long-term O&M contracts deliver steady volumes, predictable margins and low growth for Wabag; the company services an installed base of about 18,000 MLD (2024), giving strong renewal leverage and low churn. O&M is working-capital light versus EPC, making it highly cash-generative. Strategy: milk the cash, tighten SLAs to reduce penalties, and upsell minor upgrades and consumables to lift recurring revenue.
Retrofits and upgrades of legacy treatment assets
Mature cities need capacity tweaks, energy savings (up to 30% from motor and aeration retrofits) and compliance updates, driving a large retrofit pipeline in 2024. Scope is repeatable with known risks and delivers decent gross margins (~18–22%) and predictable cash flow. Sales effort is modest due to strong referenceability; standardized retrofit kits can widen margins further by 3–5 percentage points.

Conventional sewage treatment in stable municipalities
Conventional sewage treatment in stable municipalities sits in a mature market with well-known competitors and standard specs, where Wabag’s operations run efficiently with minimal surprises. Industry reports show the global municipal wastewater market growing modestly at about 5% CAGR to 2028, reflecting flat near-term growth while backlog conversion remains steady. Strategy: maintain share, avoid price wars, and keep costs lean to protect margins.

Aftermarket parts and lifecycle services
Aftermarket parts and lifecycle services—spare parts, membranes, and media changes—are small-ticket, high-frequency cash cows for WABAG, leveraging a large installed base that makes demand sticky and highly forecastable in 2024. Limited selling costs and strong contribution margins arise from repeat consumable sales and routine service visits. Systematizing the supply chain protects margin and reduces stockouts, improving service levels and profitability.
- spare-parts: repeatable, high-frequency
- membranes-media: predictable replacement cycles
- installed-base: demand visibility, retention
- supply-chain: margin protection, lower OPEX
PPP annuity revenues from commissioned assets
PPP annuity revenues from commissioned assets deliver steady, predictable cash once projects are operational, shifting risks to performance and receivable collections rather than market growth; Wabag’s diversified backlog (≈INR 9,400 crore as of Mar 2024) underpins recurring cash generation. Governance and collections discipline, not sales, protect margins and liquidity; deploy free cash to fund the next growth bets.
- Cash profile: predictable availability payments
- Risks: performance, receivables
- Priority: strong governance & collections
- Use: fund capex/M&A
O&M & aftermarket: steady cash from ~18,000 MLD; backlog INR 9,400 cr
Wabag cash cows: O&M and aftermarket deliver steady, high-conversion cash from an installed base of ~18,000 MLD (2024) with O&M gross margins ~18–22% and aftermarket contribution margins ~25–35%. Retrofit/upgrades yield repeatable projects with energy savings up to 30%. Backlog ~INR 9,400 crore (Mar 2024) underpins PPP annuity cashflows.
| Metric | Value (2024) |
|---|---|
| Installed base | ~18,000 MLD |
| Backlog | ≈INR 9,400 crore |
| O&M gross margin | 18–22% |
| Aftermarket margin | 25–35% |
| Retrofit energy saving | up to 30% |
Full Transparency, Always
Wabag BCG Matrix
The file you're previewing is the exact Wabag BCG Matrix you'll receive after purchase—no watermarks, no demo pages, just the finished, professionally formatted report. It’s built for strategic clarity and immediate use, so you can edit, print, or present without extra work. Purchase unlocks the same document shown here—delivered instantly to your inbox and ready to plug into planning or investor decks.

Unlock Strategic Clarity
Want a quick, honest read on where Wabag’s products sit—Stars, Cash Cows, Dogs, or Question Marks? This snapshot teases the signals; the full Wabag BCG Matrix gives you quadrant-by-quadrant placement, actionable recommendations, and a ready-to-use Word report plus an Excel summary. Skip the guesswork—buy the full matrix for data-backed strategy you can implement right away. It’s pragmatic, visual, and built to help you decide where to invest, divest, or double down.
Stars
Large municipal wastewater EPC in high-growth regions
These large municipal wastewater EPCs sit squarely in fast-growing urban centers — 56% of the world lived in cities in 2024 (≈4.5bn), driving exploding demand for municipal sanitation. Wabag’s scale and references sustain healthy win rates and pipeline conversion, but projects require steady bid investment and flawless execution so cash-in closely matches cash-out. Hold share now; they compound into long-term market leadership.
Seawater desalination mega-projects in water-scarce markets
Middle East, North Africa and parts of India offer a strong growth runway as the global desalination market was estimated at about USD 15.6 billion in 2024; MENA remains the largest regional demand base. WABAG’s tech partnerships and delivery track record position it near the front of the pack, supported by a multi-year project pipeline. Capex-heavy bids require aggressive working capital and tight risk control; keep investing to convert pipeline into sustained dominance.
Industrial water reuse for heavy industries
Refining, chemicals and metals face rising regulatory and cost pressure to recycle as industry accounts for about 22% of global freshwater withdrawals (UN data); Wabag’s process know-how enables high-recovery systems that command premium pricing and higher margin projects. Sales cycles remain long but order visibility and project volumes rose in 2024 as clients prioritize circular water strategies. Aggressive marketing and deployment of reference plants is essential to lock share before rivals scale up.
Advanced membrane/MBR solutions
High-performance membranes and MBRs are becoming the default for space-limited, high-quality effluent, delivering >99% pathogen removal and compact footprints that can cut plant area by ~50%. Wabag’s end-to-end integration and O&M capability is a clear differentiator. Scaling is capital- and talent-intensive, soaking cash while revenue ramps; early backing can convert into a sustainable margin engine.
- Market fit: space-limited, high-quality demand
- Tech edge: >99% pathogen removal
- Wabag strength: systems integration + O&M
- Investment profile: high capex/talent, cash burn then margin
Design–build–operate concessions with performance guarantees
Design–build–operate concessions with performance guarantees fit where municipalities buy outcomes not equipment; Wabag’s model leverages 10–25 year contracts and presence in 30+ countries to capture lifecycle value. Strong lifetime revenues create stickiness and defensible positions, but require upfront capex, bonding and deep O&M capability. Maintaining service KPIs converts these into annuity-style revenue streams.
- 10–25 year contracts
- 30+ country footprint
- Requires upfront capex & bonding
- Drives annuity-style lifetime value
Urban surge fuels sanitation & desal — 56% (~4.5bn), USD15.6bn
Wabag’s municipal EPCs and desal Stars sit in fast urban growth: 56% of world in cities in 2024 (~4.5bn), driving large sanitation demand. Desal market ≈USD15.6bn in 2024 with MENA lead; Wabag’s 30+ country footprint, 10–25yr concessions and systems/O&M edge support high-margin scale but require upfront capex and working-capital intensity.
| Metric | 2024 |
|---|---|
| Urban population | 56% (~4.5bn) |
| Desal market | USD15.6bn |
| Footprint | 30+ countries |
| Contract length | 10–25 yrs |
What is included in the product
Detailed Word Document
In-depth BCG Matrix review of Wabag’s units with strategic guidance on Stars, Cash Cows, Question Marks and Dogs.
Customizable Excel Spreadsheet
One-page Wabag BCG Matrix that clears strategic clutter—spot growth gaps fast and calm stakeholder debates.
Cash Cows
Long-term O&M contracts for existing plants
Long-term O&M contracts deliver steady volumes, predictable margins and low growth for Wabag; the company services an installed base of about 18,000 MLD (2024), giving strong renewal leverage and low churn. O&M is working-capital light versus EPC, making it highly cash-generative. Strategy: milk the cash, tighten SLAs to reduce penalties, and upsell minor upgrades and consumables to lift recurring revenue.
Retrofits and upgrades of legacy treatment assets
Mature cities need capacity tweaks, energy savings (up to 30% from motor and aeration retrofits) and compliance updates, driving a large retrofit pipeline in 2024. Scope is repeatable with known risks and delivers decent gross margins (~18–22%) and predictable cash flow. Sales effort is modest due to strong referenceability; standardized retrofit kits can widen margins further by 3–5 percentage points.
Conventional sewage treatment in stable municipalities
Conventional sewage treatment in stable municipalities sits in a mature market with well-known competitors and standard specs, where Wabag’s operations run efficiently with minimal surprises. Industry reports show the global municipal wastewater market growing modestly at about 5% CAGR to 2028, reflecting flat near-term growth while backlog conversion remains steady. Strategy: maintain share, avoid price wars, and keep costs lean to protect margins.
Aftermarket parts and lifecycle services
Aftermarket parts and lifecycle services—spare parts, membranes, and media changes—are small-ticket, high-frequency cash cows for WABAG, leveraging a large installed base that makes demand sticky and highly forecastable in 2024. Limited selling costs and strong contribution margins arise from repeat consumable sales and routine service visits. Systematizing the supply chain protects margin and reduces stockouts, improving service levels and profitability.
- spare-parts: repeatable, high-frequency
- membranes-media: predictable replacement cycles
- installed-base: demand visibility, retention
- supply-chain: margin protection, lower OPEX
PPP annuity revenues from commissioned assets
PPP annuity revenues from commissioned assets deliver steady, predictable cash once projects are operational, shifting risks to performance and receivable collections rather than market growth; Wabag’s diversified backlog (≈INR 9,400 crore as of Mar 2024) underpins recurring cash generation. Governance and collections discipline, not sales, protect margins and liquidity; deploy free cash to fund the next growth bets.
- Cash profile: predictable availability payments
- Risks: performance, receivables
- Priority: strong governance & collections
- Use: fund capex/M&A
O&M & aftermarket: steady cash from ~18,000 MLD; backlog INR 9,400 cr
Wabag cash cows: O&M and aftermarket deliver steady, high-conversion cash from an installed base of ~18,000 MLD (2024) with O&M gross margins ~18–22% and aftermarket contribution margins ~25–35%. Retrofit/upgrades yield repeatable projects with energy savings up to 30%. Backlog ~INR 9,400 crore (Mar 2024) underpins PPP annuity cashflows.
| Metric | Value (2024) |
|---|---|
| Installed base | ~18,000 MLD |
| Backlog | ≈INR 9,400 crore |
| O&M gross margin | 18–22% |
| Aftermarket margin | 25–35% |
| Retrofit energy saving | up to 30% |
Full Transparency, Always
Wabag BCG Matrix
The file you're previewing is the exact Wabag BCG Matrix you'll receive after purchase—no watermarks, no demo pages, just the finished, professionally formatted report. It’s built for strategic clarity and immediate use, so you can edit, print, or present without extra work. Purchase unlocks the same document shown here—delivered instantly to your inbox and ready to plug into planning or investor decks.
Original: $10.00
-65%$10.00
$3.50Description
Unlock Strategic Clarity
Want a quick, honest read on where Wabag’s products sit—Stars, Cash Cows, Dogs, or Question Marks? This snapshot teases the signals; the full Wabag BCG Matrix gives you quadrant-by-quadrant placement, actionable recommendations, and a ready-to-use Word report plus an Excel summary. Skip the guesswork—buy the full matrix for data-backed strategy you can implement right away. It’s pragmatic, visual, and built to help you decide where to invest, divest, or double down.
Stars
Large municipal wastewater EPC in high-growth regions
These large municipal wastewater EPCs sit squarely in fast-growing urban centers — 56% of the world lived in cities in 2024 (≈4.5bn), driving exploding demand for municipal sanitation. Wabag’s scale and references sustain healthy win rates and pipeline conversion, but projects require steady bid investment and flawless execution so cash-in closely matches cash-out. Hold share now; they compound into long-term market leadership.
Seawater desalination mega-projects in water-scarce markets
Middle East, North Africa and parts of India offer a strong growth runway as the global desalination market was estimated at about USD 15.6 billion in 2024; MENA remains the largest regional demand base. WABAG’s tech partnerships and delivery track record position it near the front of the pack, supported by a multi-year project pipeline. Capex-heavy bids require aggressive working capital and tight risk control; keep investing to convert pipeline into sustained dominance.
Industrial water reuse for heavy industries
Refining, chemicals and metals face rising regulatory and cost pressure to recycle as industry accounts for about 22% of global freshwater withdrawals (UN data); Wabag’s process know-how enables high-recovery systems that command premium pricing and higher margin projects. Sales cycles remain long but order visibility and project volumes rose in 2024 as clients prioritize circular water strategies. Aggressive marketing and deployment of reference plants is essential to lock share before rivals scale up.
Advanced membrane/MBR solutions
High-performance membranes and MBRs are becoming the default for space-limited, high-quality effluent, delivering >99% pathogen removal and compact footprints that can cut plant area by ~50%. Wabag’s end-to-end integration and O&M capability is a clear differentiator. Scaling is capital- and talent-intensive, soaking cash while revenue ramps; early backing can convert into a sustainable margin engine.
- Market fit: space-limited, high-quality demand
- Tech edge: >99% pathogen removal
- Wabag strength: systems integration + O&M
- Investment profile: high capex/talent, cash burn then margin
Design–build–operate concessions with performance guarantees
Design–build–operate concessions with performance guarantees fit where municipalities buy outcomes not equipment; Wabag’s model leverages 10–25 year contracts and presence in 30+ countries to capture lifecycle value. Strong lifetime revenues create stickiness and defensible positions, but require upfront capex, bonding and deep O&M capability. Maintaining service KPIs converts these into annuity-style revenue streams.
- 10–25 year contracts
- 30+ country footprint
- Requires upfront capex & bonding
- Drives annuity-style lifetime value
Urban surge fuels sanitation & desal — 56% (~4.5bn), USD15.6bn
Wabag’s municipal EPCs and desal Stars sit in fast urban growth: 56% of world in cities in 2024 (~4.5bn), driving large sanitation demand. Desal market ≈USD15.6bn in 2024 with MENA lead; Wabag’s 30+ country footprint, 10–25yr concessions and systems/O&M edge support high-margin scale but require upfront capex and working-capital intensity.
| Metric | 2024 |
|---|---|
| Urban population | 56% (~4.5bn) |
| Desal market | USD15.6bn |
| Footprint | 30+ countries |
| Contract length | 10–25 yrs |
What is included in the product
Detailed Word Document
In-depth BCG Matrix review of Wabag’s units with strategic guidance on Stars, Cash Cows, Question Marks and Dogs.
Customizable Excel Spreadsheet
One-page Wabag BCG Matrix that clears strategic clutter—spot growth gaps fast and calm stakeholder debates.
Cash Cows
Long-term O&M contracts for existing plants
Long-term O&M contracts deliver steady volumes, predictable margins and low growth for Wabag; the company services an installed base of about 18,000 MLD (2024), giving strong renewal leverage and low churn. O&M is working-capital light versus EPC, making it highly cash-generative. Strategy: milk the cash, tighten SLAs to reduce penalties, and upsell minor upgrades and consumables to lift recurring revenue.
Retrofits and upgrades of legacy treatment assets
Mature cities need capacity tweaks, energy savings (up to 30% from motor and aeration retrofits) and compliance updates, driving a large retrofit pipeline in 2024. Scope is repeatable with known risks and delivers decent gross margins (~18–22%) and predictable cash flow. Sales effort is modest due to strong referenceability; standardized retrofit kits can widen margins further by 3–5 percentage points.
Conventional sewage treatment in stable municipalities
Conventional sewage treatment in stable municipalities sits in a mature market with well-known competitors and standard specs, where Wabag’s operations run efficiently with minimal surprises. Industry reports show the global municipal wastewater market growing modestly at about 5% CAGR to 2028, reflecting flat near-term growth while backlog conversion remains steady. Strategy: maintain share, avoid price wars, and keep costs lean to protect margins.
Aftermarket parts and lifecycle services
Aftermarket parts and lifecycle services—spare parts, membranes, and media changes—are small-ticket, high-frequency cash cows for WABAG, leveraging a large installed base that makes demand sticky and highly forecastable in 2024. Limited selling costs and strong contribution margins arise from repeat consumable sales and routine service visits. Systematizing the supply chain protects margin and reduces stockouts, improving service levels and profitability.
- spare-parts: repeatable, high-frequency
- membranes-media: predictable replacement cycles
- installed-base: demand visibility, retention
- supply-chain: margin protection, lower OPEX
PPP annuity revenues from commissioned assets
PPP annuity revenues from commissioned assets deliver steady, predictable cash once projects are operational, shifting risks to performance and receivable collections rather than market growth; Wabag’s diversified backlog (≈INR 9,400 crore as of Mar 2024) underpins recurring cash generation. Governance and collections discipline, not sales, protect margins and liquidity; deploy free cash to fund the next growth bets.
- Cash profile: predictable availability payments
- Risks: performance, receivables
- Priority: strong governance & collections
- Use: fund capex/M&A
O&M & aftermarket: steady cash from ~18,000 MLD; backlog INR 9,400 cr
Wabag cash cows: O&M and aftermarket deliver steady, high-conversion cash from an installed base of ~18,000 MLD (2024) with O&M gross margins ~18–22% and aftermarket contribution margins ~25–35%. Retrofit/upgrades yield repeatable projects with energy savings up to 30%. Backlog ~INR 9,400 crore (Mar 2024) underpins PPP annuity cashflows.
| Metric | Value (2024) |
|---|---|
| Installed base | ~18,000 MLD |
| Backlog | ≈INR 9,400 crore |
| O&M gross margin | 18–22% |
| Aftermarket margin | 25–35% |
| Retrofit energy saving | up to 30% |
Full Transparency, Always
Wabag BCG Matrix
The file you're previewing is the exact Wabag BCG Matrix you'll receive after purchase—no watermarks, no demo pages, just the finished, professionally formatted report. It’s built for strategic clarity and immediate use, so you can edit, print, or present without extra work. Purchase unlocks the same document shown here—delivered instantly to your inbox and ready to plug into planning or investor decks.











