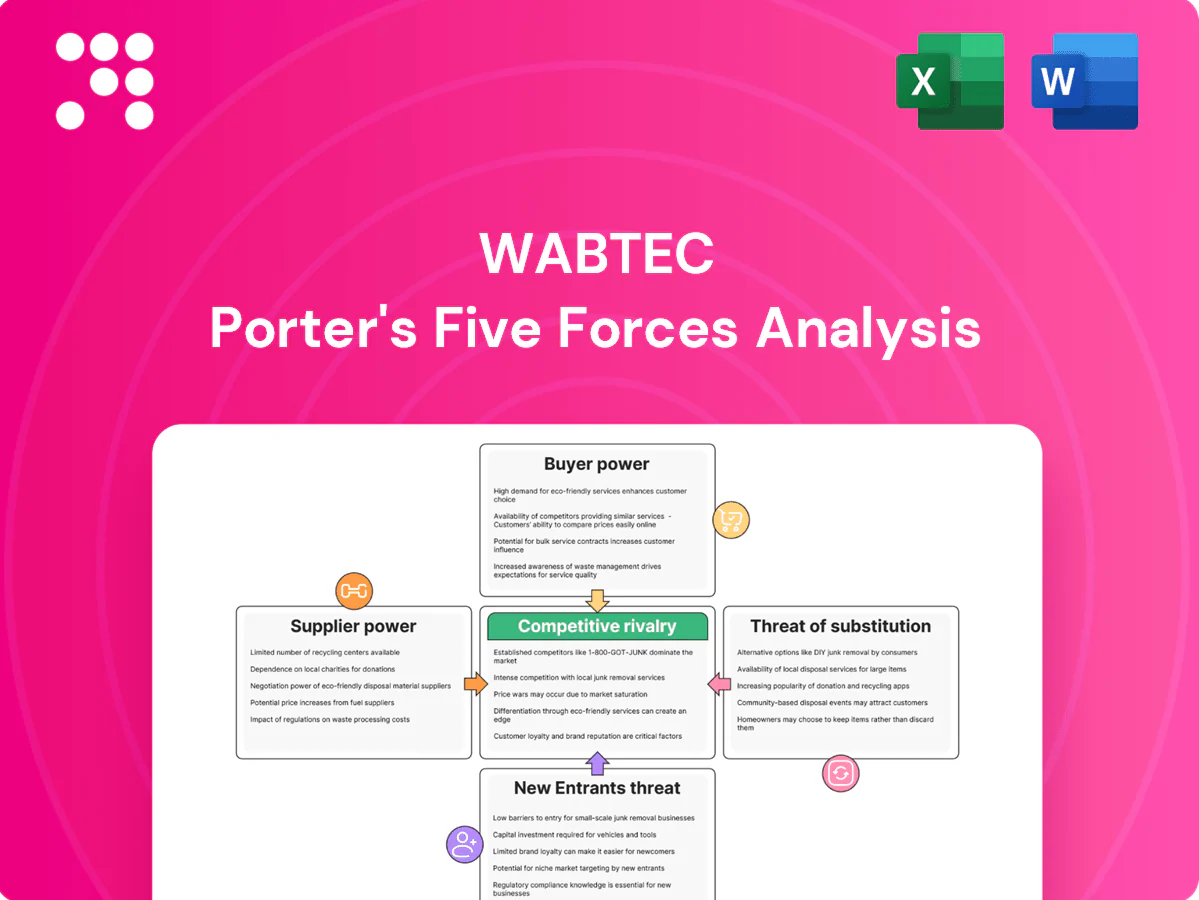
Wabtec Porter's Five Forces Analysis

Go Beyond the Preview—Access the Full Strategic Report
Wabtec faces moderate supplier leverage, intense rivalry from OEMs and rail service specialists, and evolving substitute and entrant risks driven by tech and sustainability trends. This snapshot highlights key pressure points and strategic levers for management and investors. Ready to move beyond the basics? Get a full strategic breakdown of Wabtec’s market position and competitive intensity today.
Suppliers Bargaining Power

Concentrated critical components
Locomotive engines, power electronics and specialized braking parts come from a limited pool of certified suppliers, restricting substitution and elevating supplier leverage; dual‑sourcing is pursued but depth is uneven, leaving platforms vulnerable to disruptions that can ripple across programs; Wabtec employed about 27,000 people in 2024, underscoring scale but not eliminating supplier concentration risk.
Commodity vs. specialty inputs
Steel, copper and castings remain largely commoditized—copper averaged about $8,500/tonne in 2024—allowing Wabtec to blunt supplier power via hedging and scale buys. Specialty alloys, semiconductors and proprietary software stacks are far less fungible and command premiums, shifting supplier influence upward as electronics now comprise a growing share of system costs. Rigorous design-to-cost and value-engineering programs help Wabtec rebalance terms and reduce exposure to high-margin, single-source components.

Long-term contracts and certifications
Qualification cycles and safety certifications in rail supply typically take 12–24 months as of 2024, creating substantial switching frictions for Wabtec. Multi‑year supply agreements (commonly 3–5 years) lock price and volume but often embed escalation clauses tied to input costs. Suppliers holding unique certifications secure stronger bargaining room and premium leverage. Wabtec’s frame agreements prioritize price concessions in exchange for reliability and continuity.

Global logistics and lead times
Extended lead times in chips, IGBT modules, and sensors averaged 16–24 weeks in 2024, strengthening supplier bargaining power. Freight volatility and geopolitical risks raise buffer-stock and carrying costs by an estimated 2–4% of inventory value. Localized sourcing lowers exposure but narrows vendor choice; digital supply-chain visibility can cut delays by about 20%.
- Lead times: 16–24 weeks (2024)
- Buffer cost impact: +2–4% inventory value
- Localized sourcing: fewer vendors, lower risk
- Digital visibility: ~20% delay reduction
Backward integration limits
Wabtec selectively in-sources high-value modules but full vertical integration is impractical given scale: tooling and capex barriers preserve specialized supplier niches; many vendor setups run into multi-million dollar investments per program. Co-development ties designs to specific vendors, raising dependency, while IP-sharing secures parts access but increases switching costs; Wabtec reported about $7.6bn revenue in fiscal 2024.
- Tooling/capex: sustains supplier niches
- Co-development: design lock-in, higher dependency
- IP-sharing: access secured, switching costs up
- Selective in-sourcing: focuses on high-value modules
Vendor concentration boosts leverage; 16-24wk chip lead times
Critical assemblies come from few certified vendors, raising supplier leverage despite Wabtec’s scale (revenue ~$7.6bn in 2024). Commodities like copper (~$8,500/tonne in 2024) are hedged, but semiconductors and specialty alloys drive premium pricing and longer lead times. Qualification cycles (12–24 months) and 16–24 week chip lead times increase switching costs; buffering adds ~2–4% inventory cost.
| Metric | 2024 |
|---|---|
| Revenue | $7.6bn |
| Copper price | $8,500/tonne |
| Chip lead time | 16–24 weeks |
| Qualification | 12–24 months |
| Buffer cost | +2–4% |
What is included in the product
 Detailed Word Document
Comprehensive Porter's Five Forces assessment of Wabtec, uncovering competitive intensity, buyer and supplier power, threat of substitutes and new entrants, plus strategic implications and emerging disruptive risks; editable for reports, investor decks, or academic use.

 Customizable Excel Spreadsheet
A concise one-sheet Porter's Five Forces for Wabtec that visualizes competitive pressures with an editable spider chart for fast strategic decisions. No macros, simple layout to copy into decks—swap in your own data and duplicate tabs for scenario analysis.
Customers Bargaining Power

Highly concentrated customers
North American demand is concentrated: seven Class I railroads plus major transit authorities like NY MTA and CTA drive most volume, giving a small buyer set outsized leverage. Their professional procurement and competitive RFPs increase pressure on price and terms. Framework agreements commonly span 3–5 years and can be worth hundreds of millions, pushing transparency and penalties. Losing a bid can cost multi‑year share and revenue streams.
High switching costs, yet bid pressure
Installed base, deep software integration and rigorous safety approvals create strong platform lock‑in for Wabtec, yet buyers still run competitive tenders at overhaul or fleet refresh cycles (often ~20 years), using dual‑approval sourcing to keep suppliers price‑disciplined; performance guarantees and 99%+ uptime SLAs are increasingly decisive in win rates.

Lifecycle and total cost focus
Rail customers plan 30–50 year asset lives and optimize total cost of ownership across decades, trading upfront capex for reliability, fuel-efficiency gains (commonly up to 10–15%) and maintenance savings (often 20–25%). Outcome-based, lifecycle service contracts increasingly shift performance and residual-value risk to suppliers. Real-time telemetry and predictive-maintenance tools cut unplanned downtime by as much as 30%, giving buyers stronger negotiating leverage.

Budget and funding cyclicality
Customer bargaining strengthens with budget cyclicality: freight capex tracks volumes and commodities, driving tougher price demands in downturns; Wabtec reported a backlog of about $6.6B at mid‑2024, which smooths but does not remove cycles. Transit procurement depends on stop‑start government funding, and escalation clauses face pushback when demand weakens.
- Freight capex sensitivity: high
- Transit funding volatility: creates stop‑start buying
- Backlog: cushions but not immune (~$6.6B mid‑2024)
- Escalation clauses: contested in low demand
Standardization vs customization
Buyers push for standardized interoperability to avoid vendor lock-in, yet local regulations and varied route profiles force Wabtec to deliver customization, constraining substitutes; Wabtec reported $8.1 billion revenue in 2024, driven largely by service and aftermarket contracts. Tailored software and condition-based maintenance increase customer stickiness, though interface standards (e.g., AAR, IEEE) allow partial component swaps.
- Standardization reduces switching costs
- Customization due to regs/routes limits alternatives
- CBM/software increases retention
- Standards enable partial interoperability
Buyers drive price pressure; platform lock-in, CBM and $6.6B backlog cushion
Concentrated buyer base (Class I rail + major transit) and professional RFPs exert strong price/term pressure; losing bids costs multi‑year share. Wabtec benefits from platform lock‑in, CBM and 99%+ uptime SLAs, but buyers use lifecycle tenders and dual‑sourcing to discipline pricing. Backlog $6.6B (mid‑2024) vs revenue $8.1B (2024) cushions cycles but buyers retain leverage.
| Metric | Value |
|---|---|
| Backlog (mid‑2024) | $6.6B |
| Revenue (2024) | $8.1B |
| Uptime SLA | 99%+ |
| TCO gains cited | Fuel 10–15%, Maint 20–25% |
| Downtime cut via CBM | ~30% |
Full Version Awaits
Wabtec Porter's Five Forces Analysis
This preview shows the exact Wabtec Porter's Five Forces analysis you'll receive immediately after purchase—fully formatted, complete, and ready for use. No placeholders or samples: the file available for download is precisely this document. You’ll get instant access to this same, professionally prepared file upon payment.

Go Beyond the Preview—Access the Full Strategic Report
Wabtec faces moderate supplier leverage, intense rivalry from OEMs and rail service specialists, and evolving substitute and entrant risks driven by tech and sustainability trends. This snapshot highlights key pressure points and strategic levers for management and investors. Ready to move beyond the basics? Get a full strategic breakdown of Wabtec’s market position and competitive intensity today.
Suppliers Bargaining Power
Concentrated critical components
Locomotive engines, power electronics and specialized braking parts come from a limited pool of certified suppliers, restricting substitution and elevating supplier leverage; dual‑sourcing is pursued but depth is uneven, leaving platforms vulnerable to disruptions that can ripple across programs; Wabtec employed about 27,000 people in 2024, underscoring scale but not eliminating supplier concentration risk.
Commodity vs. specialty inputs
Steel, copper and castings remain largely commoditized—copper averaged about $8,500/tonne in 2024—allowing Wabtec to blunt supplier power via hedging and scale buys. Specialty alloys, semiconductors and proprietary software stacks are far less fungible and command premiums, shifting supplier influence upward as electronics now comprise a growing share of system costs. Rigorous design-to-cost and value-engineering programs help Wabtec rebalance terms and reduce exposure to high-margin, single-source components.
Long-term contracts and certifications
Qualification cycles and safety certifications in rail supply typically take 12–24 months as of 2024, creating substantial switching frictions for Wabtec. Multi‑year supply agreements (commonly 3–5 years) lock price and volume but often embed escalation clauses tied to input costs. Suppliers holding unique certifications secure stronger bargaining room and premium leverage. Wabtec’s frame agreements prioritize price concessions in exchange for reliability and continuity.
Global logistics and lead times
Extended lead times in chips, IGBT modules, and sensors averaged 16–24 weeks in 2024, strengthening supplier bargaining power. Freight volatility and geopolitical risks raise buffer-stock and carrying costs by an estimated 2–4% of inventory value. Localized sourcing lowers exposure but narrows vendor choice; digital supply-chain visibility can cut delays by about 20%.
- Lead times: 16–24 weeks (2024)
- Buffer cost impact: +2–4% inventory value
- Localized sourcing: fewer vendors, lower risk
- Digital visibility: ~20% delay reduction
Backward integration limits
Wabtec selectively in-sources high-value modules but full vertical integration is impractical given scale: tooling and capex barriers preserve specialized supplier niches; many vendor setups run into multi-million dollar investments per program. Co-development ties designs to specific vendors, raising dependency, while IP-sharing secures parts access but increases switching costs; Wabtec reported about $7.6bn revenue in fiscal 2024.
- Tooling/capex: sustains supplier niches
- Co-development: design lock-in, higher dependency
- IP-sharing: access secured, switching costs up
- Selective in-sourcing: focuses on high-value modules
Vendor concentration boosts leverage; 16-24wk chip lead times
Critical assemblies come from few certified vendors, raising supplier leverage despite Wabtec’s scale (revenue ~$7.6bn in 2024). Commodities like copper (~$8,500/tonne in 2024) are hedged, but semiconductors and specialty alloys drive premium pricing and longer lead times. Qualification cycles (12–24 months) and 16–24 week chip lead times increase switching costs; buffering adds ~2–4% inventory cost.
| Metric | 2024 |
|---|---|
| Revenue | $7.6bn |
| Copper price | $8,500/tonne |
| Chip lead time | 16–24 weeks |
| Qualification | 12–24 months |
| Buffer cost | +2–4% |
What is included in the product
Detailed Word Document
Comprehensive Porter's Five Forces assessment of Wabtec, uncovering competitive intensity, buyer and supplier power, threat of substitutes and new entrants, plus strategic implications and emerging disruptive risks; editable for reports, investor decks, or academic use.
Customizable Excel Spreadsheet
A concise one-sheet Porter's Five Forces for Wabtec that visualizes competitive pressures with an editable spider chart for fast strategic decisions. No macros, simple layout to copy into decks—swap in your own data and duplicate tabs for scenario analysis.
Customers Bargaining Power
Highly concentrated customers
North American demand is concentrated: seven Class I railroads plus major transit authorities like NY MTA and CTA drive most volume, giving a small buyer set outsized leverage. Their professional procurement and competitive RFPs increase pressure on price and terms. Framework agreements commonly span 3–5 years and can be worth hundreds of millions, pushing transparency and penalties. Losing a bid can cost multi‑year share and revenue streams.
High switching costs, yet bid pressure
Installed base, deep software integration and rigorous safety approvals create strong platform lock‑in for Wabtec, yet buyers still run competitive tenders at overhaul or fleet refresh cycles (often ~20 years), using dual‑approval sourcing to keep suppliers price‑disciplined; performance guarantees and 99%+ uptime SLAs are increasingly decisive in win rates.
Lifecycle and total cost focus
Rail customers plan 30–50 year asset lives and optimize total cost of ownership across decades, trading upfront capex for reliability, fuel-efficiency gains (commonly up to 10–15%) and maintenance savings (often 20–25%). Outcome-based, lifecycle service contracts increasingly shift performance and residual-value risk to suppliers. Real-time telemetry and predictive-maintenance tools cut unplanned downtime by as much as 30%, giving buyers stronger negotiating leverage.
Budget and funding cyclicality
Customer bargaining strengthens with budget cyclicality: freight capex tracks volumes and commodities, driving tougher price demands in downturns; Wabtec reported a backlog of about $6.6B at mid‑2024, which smooths but does not remove cycles. Transit procurement depends on stop‑start government funding, and escalation clauses face pushback when demand weakens.
- Freight capex sensitivity: high
- Transit funding volatility: creates stop‑start buying
- Backlog: cushions but not immune (~$6.6B mid‑2024)
- Escalation clauses: contested in low demand
Standardization vs customization
Buyers push for standardized interoperability to avoid vendor lock-in, yet local regulations and varied route profiles force Wabtec to deliver customization, constraining substitutes; Wabtec reported $8.1 billion revenue in 2024, driven largely by service and aftermarket contracts. Tailored software and condition-based maintenance increase customer stickiness, though interface standards (e.g., AAR, IEEE) allow partial component swaps.
- Standardization reduces switching costs
- Customization due to regs/routes limits alternatives
- CBM/software increases retention
- Standards enable partial interoperability
Buyers drive price pressure; platform lock-in, CBM and $6.6B backlog cushion
Concentrated buyer base (Class I rail + major transit) and professional RFPs exert strong price/term pressure; losing bids costs multi‑year share. Wabtec benefits from platform lock‑in, CBM and 99%+ uptime SLAs, but buyers use lifecycle tenders and dual‑sourcing to discipline pricing. Backlog $6.6B (mid‑2024) vs revenue $8.1B (2024) cushions cycles but buyers retain leverage.
| Metric | Value |
|---|---|
| Backlog (mid‑2024) | $6.6B |
| Revenue (2024) | $8.1B |
| Uptime SLA | 99%+ |
| TCO gains cited | Fuel 10–15%, Maint 20–25% |
| Downtime cut via CBM | ~30% |
Full Version Awaits
Wabtec Porter's Five Forces Analysis
This preview shows the exact Wabtec Porter's Five Forces analysis you'll receive immediately after purchase—fully formatted, complete, and ready for use. No placeholders or samples: the file available for download is precisely this document. You’ll get instant access to this same, professionally prepared file upon payment.
Description
Go Beyond the Preview—Access the Full Strategic Report
Wabtec faces moderate supplier leverage, intense rivalry from OEMs and rail service specialists, and evolving substitute and entrant risks driven by tech and sustainability trends. This snapshot highlights key pressure points and strategic levers for management and investors. Ready to move beyond the basics? Get a full strategic breakdown of Wabtec’s market position and competitive intensity today.
Suppliers Bargaining Power
Concentrated critical components
Locomotive engines, power electronics and specialized braking parts come from a limited pool of certified suppliers, restricting substitution and elevating supplier leverage; dual‑sourcing is pursued but depth is uneven, leaving platforms vulnerable to disruptions that can ripple across programs; Wabtec employed about 27,000 people in 2024, underscoring scale but not eliminating supplier concentration risk.
Commodity vs. specialty inputs
Steel, copper and castings remain largely commoditized—copper averaged about $8,500/tonne in 2024—allowing Wabtec to blunt supplier power via hedging and scale buys. Specialty alloys, semiconductors and proprietary software stacks are far less fungible and command premiums, shifting supplier influence upward as electronics now comprise a growing share of system costs. Rigorous design-to-cost and value-engineering programs help Wabtec rebalance terms and reduce exposure to high-margin, single-source components.
Long-term contracts and certifications
Qualification cycles and safety certifications in rail supply typically take 12–24 months as of 2024, creating substantial switching frictions for Wabtec. Multi‑year supply agreements (commonly 3–5 years) lock price and volume but often embed escalation clauses tied to input costs. Suppliers holding unique certifications secure stronger bargaining room and premium leverage. Wabtec’s frame agreements prioritize price concessions in exchange for reliability and continuity.
Global logistics and lead times
Extended lead times in chips, IGBT modules, and sensors averaged 16–24 weeks in 2024, strengthening supplier bargaining power. Freight volatility and geopolitical risks raise buffer-stock and carrying costs by an estimated 2–4% of inventory value. Localized sourcing lowers exposure but narrows vendor choice; digital supply-chain visibility can cut delays by about 20%.
- Lead times: 16–24 weeks (2024)
- Buffer cost impact: +2–4% inventory value
- Localized sourcing: fewer vendors, lower risk
- Digital visibility: ~20% delay reduction
Backward integration limits
Wabtec selectively in-sources high-value modules but full vertical integration is impractical given scale: tooling and capex barriers preserve specialized supplier niches; many vendor setups run into multi-million dollar investments per program. Co-development ties designs to specific vendors, raising dependency, while IP-sharing secures parts access but increases switching costs; Wabtec reported about $7.6bn revenue in fiscal 2024.
- Tooling/capex: sustains supplier niches
- Co-development: design lock-in, higher dependency
- IP-sharing: access secured, switching costs up
- Selective in-sourcing: focuses on high-value modules
Vendor concentration boosts leverage; 16-24wk chip lead times
Critical assemblies come from few certified vendors, raising supplier leverage despite Wabtec’s scale (revenue ~$7.6bn in 2024). Commodities like copper (~$8,500/tonne in 2024) are hedged, but semiconductors and specialty alloys drive premium pricing and longer lead times. Qualification cycles (12–24 months) and 16–24 week chip lead times increase switching costs; buffering adds ~2–4% inventory cost.
| Metric | 2024 |
|---|---|
| Revenue | $7.6bn |
| Copper price | $8,500/tonne |
| Chip lead time | 16–24 weeks |
| Qualification | 12–24 months |
| Buffer cost | +2–4% |
What is included in the product
Detailed Word Document
Comprehensive Porter's Five Forces assessment of Wabtec, uncovering competitive intensity, buyer and supplier power, threat of substitutes and new entrants, plus strategic implications and emerging disruptive risks; editable for reports, investor decks, or academic use.
Customizable Excel Spreadsheet
A concise one-sheet Porter's Five Forces for Wabtec that visualizes competitive pressures with an editable spider chart for fast strategic decisions. No macros, simple layout to copy into decks—swap in your own data and duplicate tabs for scenario analysis.
Customers Bargaining Power
Highly concentrated customers
North American demand is concentrated: seven Class I railroads plus major transit authorities like NY MTA and CTA drive most volume, giving a small buyer set outsized leverage. Their professional procurement and competitive RFPs increase pressure on price and terms. Framework agreements commonly span 3–5 years and can be worth hundreds of millions, pushing transparency and penalties. Losing a bid can cost multi‑year share and revenue streams.
High switching costs, yet bid pressure
Installed base, deep software integration and rigorous safety approvals create strong platform lock‑in for Wabtec, yet buyers still run competitive tenders at overhaul or fleet refresh cycles (often ~20 years), using dual‑approval sourcing to keep suppliers price‑disciplined; performance guarantees and 99%+ uptime SLAs are increasingly decisive in win rates.
Lifecycle and total cost focus
Rail customers plan 30–50 year asset lives and optimize total cost of ownership across decades, trading upfront capex for reliability, fuel-efficiency gains (commonly up to 10–15%) and maintenance savings (often 20–25%). Outcome-based, lifecycle service contracts increasingly shift performance and residual-value risk to suppliers. Real-time telemetry and predictive-maintenance tools cut unplanned downtime by as much as 30%, giving buyers stronger negotiating leverage.
Budget and funding cyclicality
Customer bargaining strengthens with budget cyclicality: freight capex tracks volumes and commodities, driving tougher price demands in downturns; Wabtec reported a backlog of about $6.6B at mid‑2024, which smooths but does not remove cycles. Transit procurement depends on stop‑start government funding, and escalation clauses face pushback when demand weakens.
- Freight capex sensitivity: high
- Transit funding volatility: creates stop‑start buying
- Backlog: cushions but not immune (~$6.6B mid‑2024)
- Escalation clauses: contested in low demand
Standardization vs customization
Buyers push for standardized interoperability to avoid vendor lock-in, yet local regulations and varied route profiles force Wabtec to deliver customization, constraining substitutes; Wabtec reported $8.1 billion revenue in 2024, driven largely by service and aftermarket contracts. Tailored software and condition-based maintenance increase customer stickiness, though interface standards (e.g., AAR, IEEE) allow partial component swaps.
- Standardization reduces switching costs
- Customization due to regs/routes limits alternatives
- CBM/software increases retention
- Standards enable partial interoperability
Buyers drive price pressure; platform lock-in, CBM and $6.6B backlog cushion
Concentrated buyer base (Class I rail + major transit) and professional RFPs exert strong price/term pressure; losing bids costs multi‑year share. Wabtec benefits from platform lock‑in, CBM and 99%+ uptime SLAs, but buyers use lifecycle tenders and dual‑sourcing to discipline pricing. Backlog $6.6B (mid‑2024) vs revenue $8.1B (2024) cushions cycles but buyers retain leverage.
| Metric | Value |
|---|---|
| Backlog (mid‑2024) | $6.6B |
| Revenue (2024) | $8.1B |
| Uptime SLA | 99%+ |
| TCO gains cited | Fuel 10–15%, Maint 20–25% |
| Downtime cut via CBM | ~30% |
Full Version Awaits
Wabtec Porter's Five Forces Analysis
This preview shows the exact Wabtec Porter's Five Forces analysis you'll receive immediately after purchase—fully formatted, complete, and ready for use. No placeholders or samples: the file available for download is precisely this document. You’ll get instant access to this same, professionally prepared file upon payment.











