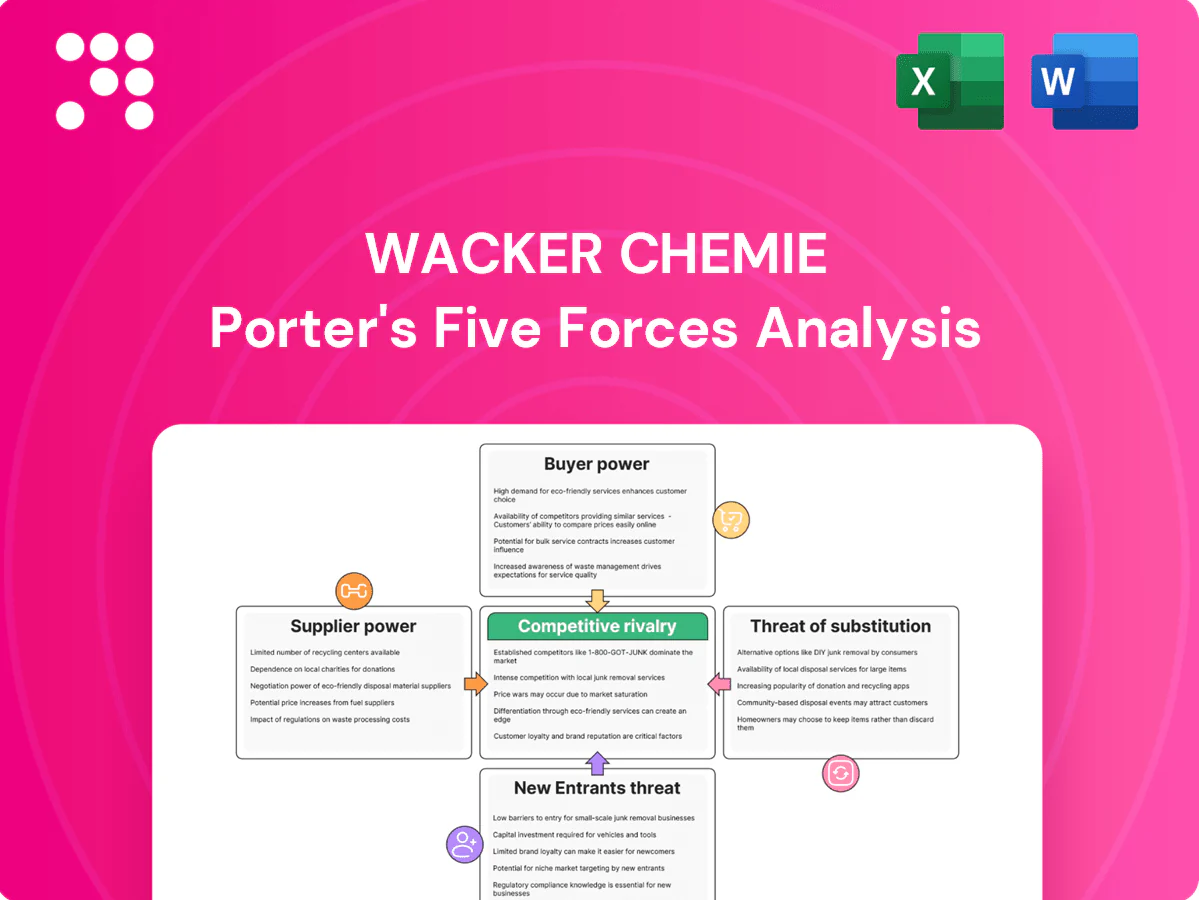
Wacker Chemie Porter's Five Forces Analysis

From Overview to Strategy Blueprint
Wacker Chemie's Porter’s Five Forces snapshot shows intense industry rivalry, significant barriers to entry, moderate supplier and buyer power, and limited substitution threats driven by specialized chemistries. Capital intensity and scale favor incumbents while raw-material volatility raises supplier influence. This brief snapshot only scratches the surface. Unlock the full Porter's Five Forces Analysis to explore Wacker Chemie’s competitive dynamics, market pressures, and strategic advantages in detail.
Suppliers Bargaining Power

Energy intensity and utilities
Polysilicon and silicone production are highly electricity-intensive—polysilicon typically requires about 50–60 kWh/kg—so power providers hold significant leverage over Wacker. 2024 European wholesale power volatility, with day-ahead peaks often exceeding €100/MWh, shows price spikes and grid constraints can materially hit margins and output. Long-term power contracts and multi-site diversification mitigate exposure. Low-cost, reliable energy access is a strategic sourcing priority for Wacker.
Silicon metal and key monomers
Wacker depends on metallurgical‑grade silicon and specialty monomers sourced from a small set of qualified suppliers, while China supplies roughly 85% of global silicon metal capacity (2024), concentrating upstream leverage.
Stringent quality specs for polysilicon precursors and monomers increase switching costs, giving suppliers pricing power.
Multi‑sourcing and regional procurement lower disruption risk but do not eliminate it; price volatility for silicon and key monomers transmits unevenly across Wacker product lines.

Specialty catalysts and additives
Specialty catalysts and functional additives for Wacker come from niche vendors (e.g., platinum-based chemistries) with strict qualification cycles of 6–18 months, raising effective switching costs. In tight markets suppliers can push prices and extend lead times up to 6 months. Inventory buffers of 3–6 months and limited reformulation options partially blunt supplier leverage.

Process equipment and technology providers
High-purity reactors, filtration and control systems are sourced from a small supplier pool, and in 2024 extended lead times and concentrated maintenance support intensified vendor dependency for Wacker.
CAPEX cycles in 2024 further concentrated bargaining power with OEMs during peak procurement windows, raising switching costs and price vulnerability.
Strategic partnerships, standardization and long-term service contracts in 2024 reduced supply risk and improved commercial terms where implemented.
- Supplier concentration: small pool for critical equipment
- Lead times/maintenance: create vendor dependency
- CAPEX cycles: concentrate OEM bargaining power
- Mitigants: partnerships, standardization, service contracts
Logistics and hazardous handling
Chemical logistics, cold-chain and hazardous handling require certified carriers (ADR, IMDG, IATA DGR) and specialized equipment; the global chemical logistics market was estimated near USD 226.5 billion in 2024, increasing carriers' leverage where capacity or regulatory complexity tightens. Port congestion and national constraints amplify provider power, while dedicated contracts, multimodal routing and proximity to customers limit freight exposure and disruption risk.
- Certified carriers: ADR/IMDG/IATA
- Market size 2024: ≈USD 226.5bn
- Mitigation: dedicated contracts, multimodal
- Proximity: lowers freight and disruption risk
Energy costs and China supply concentration amplify supplier leverage
Energy intensity (50–60 kWh/kg polysilicon) and 2024 EU day‑ahead peaks >€100/MWh give power suppliers high leverage; long‑term contracts and site diversification mitigate risk. China supplied ~85% of global silicon metal capacity (2024), concentrating upstream bargaining power. Certified chemical logistics market ≈USD 226.5bn (2024) and extended lead times raise carrier leverage despite dedicated contracts.
| Supplier factor | 2024 metric | Impact on Wacker |
|---|---|---|
| Energy | 50–60 kWh/kg; peaks >€100/MWh | Margin volatility |
| Silicon supply | China ≈85% capacity | Price/availability risk |
| Logistics | Market ≈USD 226.5bn | Freight dependency |
| Equipment/OEMs | Long lead times, peak CAPEX | Switching costs |
What is included in the product
 Detailed Word Document
Uncovers key drivers of competition, customer influence, and market entry risks for Wacker Chemie through a detailed Porter's Five Forces assessment; evaluates supplier and buyer power, threat of substitutes and new entrants, and competitive rivalry to assess pricing and profitability pressures. Identifies disruptive forces and strategic levers to protect market share and guide investment or corporate strategy.

 Customizable Excel Spreadsheet
A concise one-sheet Porter's Five Forces for Wacker Chemie—instantly revealing competitive pressures with an editable radar chart; customize inputs for regulation shifts, feedstock volatility, or new entrants and drop directly into decks or Excel dashboards.
Customers Bargaining Power

Consolidated industrial customers
Major auto, electronics and construction buyers (OEMs and tier-1 suppliers) purchase at scale and extract concessions through framework agreements and competitive auctions, which can compress selling prices by up to 15% in commodity segments. Long-term volume commitments help Wacker stabilize plant utilization but often at tighter mid-single-digit margin dilution. Supplier performance metrics—on-time delivery, quality defect rates and sustainability scores—drive share-of-wallet and contract renewals.
Qualification and switching costs
Many Wacker Chemie applications require rigorous technical approval—qualification often spans 3–6 months—creating high switching barriers for buyers. Once qualified, customers risk downtime and costly revalidation, deterring supplier changes for mission-critical grades and tempering price sensitivity. Value-in-use pricing and co-development projects further deepen stickiness through tailored formulations and joint IP.

Price sensitivity in cyclical end-markets
Customers become highly price-sensitive in construction and solar downturns, where 2023 global PV additions (approximately 402 GW) pressured polysilicon/silicone demand and increased discounting. Buyers shift to lower-spec products when margins compress, while premium specialty silicones show greater resilience versus commoditized dispersions. Dynamic pricing and product-mix management are essential to protect margins.

Demand for sustainability and compliance
Customers increasingly demand low-carbon, regulatory-compliant chemistries, with industry surveys indicating about 70% of B2B buyers factor ESG into supplier selection; ESG strength narrows pricing latitude and raises contractual requirements. Traceability and third-party audits typically add roughly 1–3% to cost-to-serve, while green premiums of about 5–15% apply but vary by end-use.
- ESG drives vendor selection (~70% buyers)
- Traceability/audits add ~1–3% servicing cost
- Green premiums ~5–15%, application-dependent
Access to alternatives and dual sourcing
Global buyers often maintain dual-source strategies, raising bargaining power for Wacker as Asia accounted for over 50% of global chemical production in 2024, expanding options for comparable grades. Availability of comparable grades from top peers and regional Asian producers increases pressure on prices for standard products. Strong product differentiation and specialty grades are essential to defend margins.
- Dual-sourcing: reduces supply risk, increases buyer leverage
- Asia >50%: expands alternatives for standard grades (2024)
- Peers' comparable grades: greater price pressure
- Differentiation: key to margin protection
OEM contracts force 15% cuts; ESG, Asia shift supplier leverage
Large OEMs/tier-1 buyers extract concessions (up to 15% price compression in commodity segments) via volume contracts; long-term commitments stabilize utilization but dilute margins mid-single digits. Qualification (3–6 months) and co-development raise switching costs, yet downturns (2023 PV 402 GW) increase price sensitivity. ESG influences ~70% of buyers; Asia >50% of chemical output (2024) expands sourcing options.
| Metric | Value |
|---|---|
| Max price compression | ~15% |
| PV additions (2023) | 402 GW |
| Asia share (2024) | >50% |
| Buyers factoring ESG | ~70% |
Preview Before You Purchase
Wacker Chemie Porter's Five Forces Analysis
The Wacker Chemie Porter’s Five Forces analysis evaluates competitive rivalry, supplier and buyer power, threat of substitutes, and barriers to entry to clarify strategic risks and opportunities for investors and managers. This preview shows the exact document you'll receive immediately after purchase—no surprises, no placeholders. The file is professionally formatted, data-driven, and ready for immediate use.

From Overview to Strategy Blueprint
Wacker Chemie's Porter’s Five Forces snapshot shows intense industry rivalry, significant barriers to entry, moderate supplier and buyer power, and limited substitution threats driven by specialized chemistries. Capital intensity and scale favor incumbents while raw-material volatility raises supplier influence. This brief snapshot only scratches the surface. Unlock the full Porter's Five Forces Analysis to explore Wacker Chemie’s competitive dynamics, market pressures, and strategic advantages in detail.
Suppliers Bargaining Power
Energy intensity and utilities
Polysilicon and silicone production are highly electricity-intensive—polysilicon typically requires about 50–60 kWh/kg—so power providers hold significant leverage over Wacker. 2024 European wholesale power volatility, with day-ahead peaks often exceeding €100/MWh, shows price spikes and grid constraints can materially hit margins and output. Long-term power contracts and multi-site diversification mitigate exposure. Low-cost, reliable energy access is a strategic sourcing priority for Wacker.
Silicon metal and key monomers
Wacker depends on metallurgical‑grade silicon and specialty monomers sourced from a small set of qualified suppliers, while China supplies roughly 85% of global silicon metal capacity (2024), concentrating upstream leverage.
Stringent quality specs for polysilicon precursors and monomers increase switching costs, giving suppliers pricing power.
Multi‑sourcing and regional procurement lower disruption risk but do not eliminate it; price volatility for silicon and key monomers transmits unevenly across Wacker product lines.
Specialty catalysts and additives
Specialty catalysts and functional additives for Wacker come from niche vendors (e.g., platinum-based chemistries) with strict qualification cycles of 6–18 months, raising effective switching costs. In tight markets suppliers can push prices and extend lead times up to 6 months. Inventory buffers of 3–6 months and limited reformulation options partially blunt supplier leverage.
Process equipment and technology providers
High-purity reactors, filtration and control systems are sourced from a small supplier pool, and in 2024 extended lead times and concentrated maintenance support intensified vendor dependency for Wacker.
CAPEX cycles in 2024 further concentrated bargaining power with OEMs during peak procurement windows, raising switching costs and price vulnerability.
Strategic partnerships, standardization and long-term service contracts in 2024 reduced supply risk and improved commercial terms where implemented.
- Supplier concentration: small pool for critical equipment
- Lead times/maintenance: create vendor dependency
- CAPEX cycles: concentrate OEM bargaining power
- Mitigants: partnerships, standardization, service contracts
Logistics and hazardous handling
Chemical logistics, cold-chain and hazardous handling require certified carriers (ADR, IMDG, IATA DGR) and specialized equipment; the global chemical logistics market was estimated near USD 226.5 billion in 2024, increasing carriers' leverage where capacity or regulatory complexity tightens. Port congestion and national constraints amplify provider power, while dedicated contracts, multimodal routing and proximity to customers limit freight exposure and disruption risk.
- Certified carriers: ADR/IMDG/IATA
- Market size 2024: ≈USD 226.5bn
- Mitigation: dedicated contracts, multimodal
- Proximity: lowers freight and disruption risk
Energy costs and China supply concentration amplify supplier leverage
Energy intensity (50–60 kWh/kg polysilicon) and 2024 EU day‑ahead peaks >€100/MWh give power suppliers high leverage; long‑term contracts and site diversification mitigate risk. China supplied ~85% of global silicon metal capacity (2024), concentrating upstream bargaining power. Certified chemical logistics market ≈USD 226.5bn (2024) and extended lead times raise carrier leverage despite dedicated contracts.
| Supplier factor | 2024 metric | Impact on Wacker |
|---|---|---|
| Energy | 50–60 kWh/kg; peaks >€100/MWh | Margin volatility |
| Silicon supply | China ≈85% capacity | Price/availability risk |
| Logistics | Market ≈USD 226.5bn | Freight dependency |
| Equipment/OEMs | Long lead times, peak CAPEX | Switching costs |
What is included in the product
Detailed Word Document
Uncovers key drivers of competition, customer influence, and market entry risks for Wacker Chemie through a detailed Porter's Five Forces assessment; evaluates supplier and buyer power, threat of substitutes and new entrants, and competitive rivalry to assess pricing and profitability pressures. Identifies disruptive forces and strategic levers to protect market share and guide investment or corporate strategy.
Customizable Excel Spreadsheet
A concise one-sheet Porter's Five Forces for Wacker Chemie—instantly revealing competitive pressures with an editable radar chart; customize inputs for regulation shifts, feedstock volatility, or new entrants and drop directly into decks or Excel dashboards.
Customers Bargaining Power
Consolidated industrial customers
Major auto, electronics and construction buyers (OEMs and tier-1 suppliers) purchase at scale and extract concessions through framework agreements and competitive auctions, which can compress selling prices by up to 15% in commodity segments. Long-term volume commitments help Wacker stabilize plant utilization but often at tighter mid-single-digit margin dilution. Supplier performance metrics—on-time delivery, quality defect rates and sustainability scores—drive share-of-wallet and contract renewals.
Qualification and switching costs
Many Wacker Chemie applications require rigorous technical approval—qualification often spans 3–6 months—creating high switching barriers for buyers. Once qualified, customers risk downtime and costly revalidation, deterring supplier changes for mission-critical grades and tempering price sensitivity. Value-in-use pricing and co-development projects further deepen stickiness through tailored formulations and joint IP.
Price sensitivity in cyclical end-markets
Customers become highly price-sensitive in construction and solar downturns, where 2023 global PV additions (approximately 402 GW) pressured polysilicon/silicone demand and increased discounting. Buyers shift to lower-spec products when margins compress, while premium specialty silicones show greater resilience versus commoditized dispersions. Dynamic pricing and product-mix management are essential to protect margins.
Demand for sustainability and compliance
Customers increasingly demand low-carbon, regulatory-compliant chemistries, with industry surveys indicating about 70% of B2B buyers factor ESG into supplier selection; ESG strength narrows pricing latitude and raises contractual requirements. Traceability and third-party audits typically add roughly 1–3% to cost-to-serve, while green premiums of about 5–15% apply but vary by end-use.
- ESG drives vendor selection (~70% buyers)
- Traceability/audits add ~1–3% servicing cost
- Green premiums ~5–15%, application-dependent
Access to alternatives and dual sourcing
Global buyers often maintain dual-source strategies, raising bargaining power for Wacker as Asia accounted for over 50% of global chemical production in 2024, expanding options for comparable grades. Availability of comparable grades from top peers and regional Asian producers increases pressure on prices for standard products. Strong product differentiation and specialty grades are essential to defend margins.
- Dual-sourcing: reduces supply risk, increases buyer leverage
- Asia >50%: expands alternatives for standard grades (2024)
- Peers' comparable grades: greater price pressure
- Differentiation: key to margin protection
OEM contracts force 15% cuts; ESG, Asia shift supplier leverage
Large OEMs/tier-1 buyers extract concessions (up to 15% price compression in commodity segments) via volume contracts; long-term commitments stabilize utilization but dilute margins mid-single digits. Qualification (3–6 months) and co-development raise switching costs, yet downturns (2023 PV 402 GW) increase price sensitivity. ESG influences ~70% of buyers; Asia >50% of chemical output (2024) expands sourcing options.
| Metric | Value |
|---|---|
| Max price compression | ~15% |
| PV additions (2023) | 402 GW |
| Asia share (2024) | >50% |
| Buyers factoring ESG | ~70% |
Preview Before You Purchase
Wacker Chemie Porter's Five Forces Analysis
The Wacker Chemie Porter’s Five Forces analysis evaluates competitive rivalry, supplier and buyer power, threat of substitutes, and barriers to entry to clarify strategic risks and opportunities for investors and managers. This preview shows the exact document you'll receive immediately after purchase—no surprises, no placeholders. The file is professionally formatted, data-driven, and ready for immediate use.
Original: $10.00
-65%$10.00
$3.50Description
From Overview to Strategy Blueprint
Wacker Chemie's Porter’s Five Forces snapshot shows intense industry rivalry, significant barriers to entry, moderate supplier and buyer power, and limited substitution threats driven by specialized chemistries. Capital intensity and scale favor incumbents while raw-material volatility raises supplier influence. This brief snapshot only scratches the surface. Unlock the full Porter's Five Forces Analysis to explore Wacker Chemie’s competitive dynamics, market pressures, and strategic advantages in detail.
Suppliers Bargaining Power
Energy intensity and utilities
Polysilicon and silicone production are highly electricity-intensive—polysilicon typically requires about 50–60 kWh/kg—so power providers hold significant leverage over Wacker. 2024 European wholesale power volatility, with day-ahead peaks often exceeding €100/MWh, shows price spikes and grid constraints can materially hit margins and output. Long-term power contracts and multi-site diversification mitigate exposure. Low-cost, reliable energy access is a strategic sourcing priority for Wacker.
Silicon metal and key monomers
Wacker depends on metallurgical‑grade silicon and specialty monomers sourced from a small set of qualified suppliers, while China supplies roughly 85% of global silicon metal capacity (2024), concentrating upstream leverage.
Stringent quality specs for polysilicon precursors and monomers increase switching costs, giving suppliers pricing power.
Multi‑sourcing and regional procurement lower disruption risk but do not eliminate it; price volatility for silicon and key monomers transmits unevenly across Wacker product lines.
Specialty catalysts and additives
Specialty catalysts and functional additives for Wacker come from niche vendors (e.g., platinum-based chemistries) with strict qualification cycles of 6–18 months, raising effective switching costs. In tight markets suppliers can push prices and extend lead times up to 6 months. Inventory buffers of 3–6 months and limited reformulation options partially blunt supplier leverage.
Process equipment and technology providers
High-purity reactors, filtration and control systems are sourced from a small supplier pool, and in 2024 extended lead times and concentrated maintenance support intensified vendor dependency for Wacker.
CAPEX cycles in 2024 further concentrated bargaining power with OEMs during peak procurement windows, raising switching costs and price vulnerability.
Strategic partnerships, standardization and long-term service contracts in 2024 reduced supply risk and improved commercial terms where implemented.
- Supplier concentration: small pool for critical equipment
- Lead times/maintenance: create vendor dependency
- CAPEX cycles: concentrate OEM bargaining power
- Mitigants: partnerships, standardization, service contracts
Logistics and hazardous handling
Chemical logistics, cold-chain and hazardous handling require certified carriers (ADR, IMDG, IATA DGR) and specialized equipment; the global chemical logistics market was estimated near USD 226.5 billion in 2024, increasing carriers' leverage where capacity or regulatory complexity tightens. Port congestion and national constraints amplify provider power, while dedicated contracts, multimodal routing and proximity to customers limit freight exposure and disruption risk.
- Certified carriers: ADR/IMDG/IATA
- Market size 2024: ≈USD 226.5bn
- Mitigation: dedicated contracts, multimodal
- Proximity: lowers freight and disruption risk
Energy costs and China supply concentration amplify supplier leverage
Energy intensity (50–60 kWh/kg polysilicon) and 2024 EU day‑ahead peaks >€100/MWh give power suppliers high leverage; long‑term contracts and site diversification mitigate risk. China supplied ~85% of global silicon metal capacity (2024), concentrating upstream bargaining power. Certified chemical logistics market ≈USD 226.5bn (2024) and extended lead times raise carrier leverage despite dedicated contracts.
| Supplier factor | 2024 metric | Impact on Wacker |
|---|---|---|
| Energy | 50–60 kWh/kg; peaks >€100/MWh | Margin volatility |
| Silicon supply | China ≈85% capacity | Price/availability risk |
| Logistics | Market ≈USD 226.5bn | Freight dependency |
| Equipment/OEMs | Long lead times, peak CAPEX | Switching costs |
What is included in the product
Detailed Word Document
Uncovers key drivers of competition, customer influence, and market entry risks for Wacker Chemie through a detailed Porter's Five Forces assessment; evaluates supplier and buyer power, threat of substitutes and new entrants, and competitive rivalry to assess pricing and profitability pressures. Identifies disruptive forces and strategic levers to protect market share and guide investment or corporate strategy.
Customizable Excel Spreadsheet
A concise one-sheet Porter's Five Forces for Wacker Chemie—instantly revealing competitive pressures with an editable radar chart; customize inputs for regulation shifts, feedstock volatility, or new entrants and drop directly into decks or Excel dashboards.
Customers Bargaining Power
Consolidated industrial customers
Major auto, electronics and construction buyers (OEMs and tier-1 suppliers) purchase at scale and extract concessions through framework agreements and competitive auctions, which can compress selling prices by up to 15% in commodity segments. Long-term volume commitments help Wacker stabilize plant utilization but often at tighter mid-single-digit margin dilution. Supplier performance metrics—on-time delivery, quality defect rates and sustainability scores—drive share-of-wallet and contract renewals.
Qualification and switching costs
Many Wacker Chemie applications require rigorous technical approval—qualification often spans 3–6 months—creating high switching barriers for buyers. Once qualified, customers risk downtime and costly revalidation, deterring supplier changes for mission-critical grades and tempering price sensitivity. Value-in-use pricing and co-development projects further deepen stickiness through tailored formulations and joint IP.
Price sensitivity in cyclical end-markets
Customers become highly price-sensitive in construction and solar downturns, where 2023 global PV additions (approximately 402 GW) pressured polysilicon/silicone demand and increased discounting. Buyers shift to lower-spec products when margins compress, while premium specialty silicones show greater resilience versus commoditized dispersions. Dynamic pricing and product-mix management are essential to protect margins.
Demand for sustainability and compliance
Customers increasingly demand low-carbon, regulatory-compliant chemistries, with industry surveys indicating about 70% of B2B buyers factor ESG into supplier selection; ESG strength narrows pricing latitude and raises contractual requirements. Traceability and third-party audits typically add roughly 1–3% to cost-to-serve, while green premiums of about 5–15% apply but vary by end-use.
- ESG drives vendor selection (~70% buyers)
- Traceability/audits add ~1–3% servicing cost
- Green premiums ~5–15%, application-dependent
Access to alternatives and dual sourcing
Global buyers often maintain dual-source strategies, raising bargaining power for Wacker as Asia accounted for over 50% of global chemical production in 2024, expanding options for comparable grades. Availability of comparable grades from top peers and regional Asian producers increases pressure on prices for standard products. Strong product differentiation and specialty grades are essential to defend margins.
- Dual-sourcing: reduces supply risk, increases buyer leverage
- Asia >50%: expands alternatives for standard grades (2024)
- Peers' comparable grades: greater price pressure
- Differentiation: key to margin protection
OEM contracts force 15% cuts; ESG, Asia shift supplier leverage
Large OEMs/tier-1 buyers extract concessions (up to 15% price compression in commodity segments) via volume contracts; long-term commitments stabilize utilization but dilute margins mid-single digits. Qualification (3–6 months) and co-development raise switching costs, yet downturns (2023 PV 402 GW) increase price sensitivity. ESG influences ~70% of buyers; Asia >50% of chemical output (2024) expands sourcing options.
| Metric | Value |
|---|---|
| Max price compression | ~15% |
| PV additions (2023) | 402 GW |
| Asia share (2024) | >50% |
| Buyers factoring ESG | ~70% |
Preview Before You Purchase
Wacker Chemie Porter's Five Forces Analysis
The Wacker Chemie Porter’s Five Forces analysis evaluates competitive rivalry, supplier and buyer power, threat of substitutes, and barriers to entry to clarify strategic risks and opportunities for investors and managers. This preview shows the exact document you'll receive immediately after purchase—no surprises, no placeholders. The file is professionally formatted, data-driven, and ready for immediate use.











