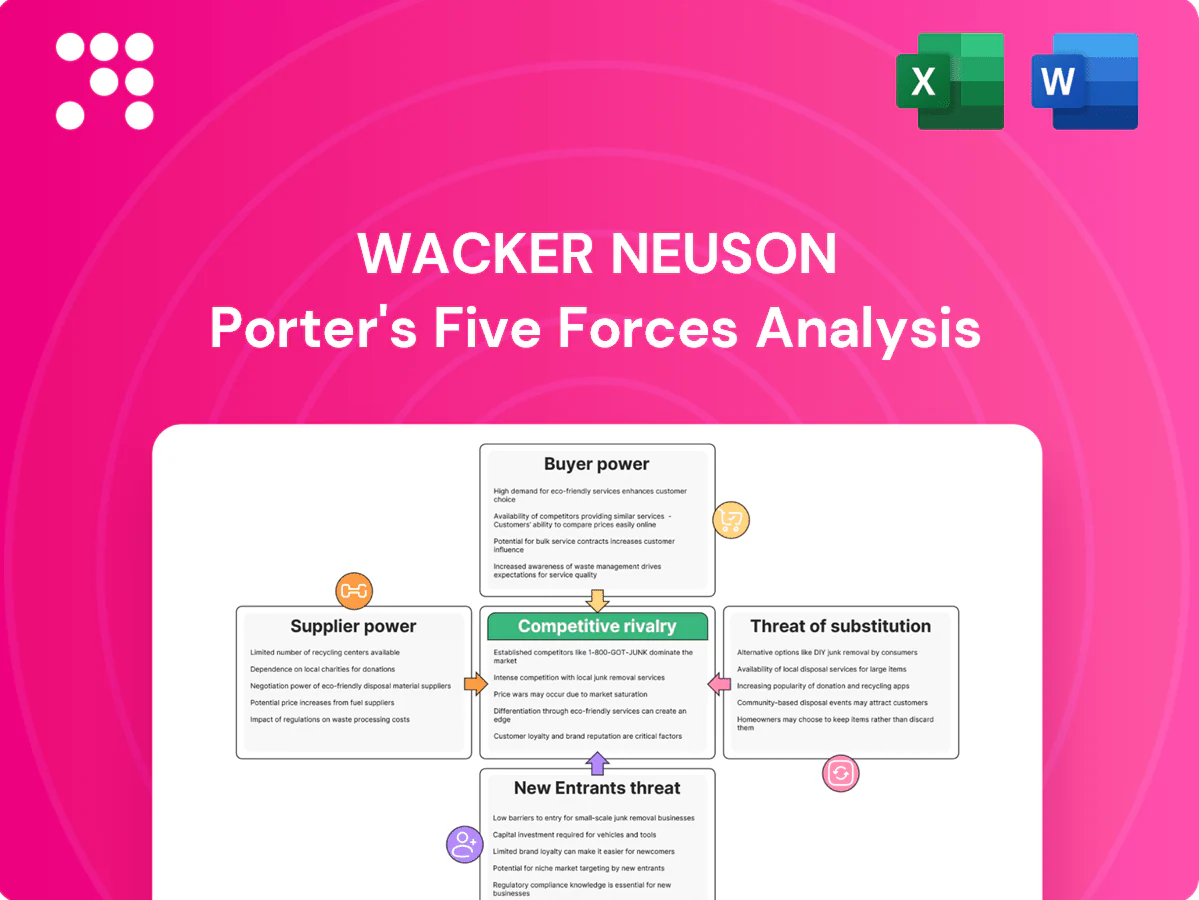
Wacker Neuson Porter's Five Forces Analysis

From Overview to Strategy Blueprint
Wacker Neuson faces moderate buyer power, intense supplier specialization, steady threat from substitutes, and barriers that limit new entrants—shaping a capital‑intensive competitive landscape. Our concise overview highlights strategic pressure points and growth levers. This brief snapshot only scratches the surface. Unlock the full Porter's Five Forces Analysis to explore Wacker Neuson’s competitive dynamics, market pressures, and strategic advantages in detail.
Suppliers Bargaining Power

Engine and hydraulics dependence
Core components like diesel engines, hydraulic systems and power electronics come from a limited set of global suppliers, concentrating supply and raising switching costs for Wacker Neuson. Supplier leverage is reinforced because qualification cycles for reliability, emissions and safety often exceed 12 months. Dual-sourcing is feasible but typically extends procurement timelines by another year and increases costs. This dependency elevates supplier bargaining power.
Specialized electronics and batteries
Electrification and telematics raise Wacker Neuson reliance on battery cells, inverters and control units, with global cell manufacturing capacity exceeding 1,200 GWh in 2024 (IEA), concentrating supplier power. Semiconductor and battery supply constraints in 2024 kept delivery schedules tight and contractual leverage with OEMs elevated. Proprietary design-in of modules locks vendors across product lifecycles; strategic partnerships reduce but do not eliminate supplier bargaining power.

Steel and raw material volatility
Steel, aluminum and rubber swings in 2024 drove BOM volatility—European hot‑rolled coil moved roughly ±18% year‑on‑year, LME aluminium about ±15% and natural rubber near ±22%, pressuring margins as suppliers often pass costs faster than Wacker Neuson can reprice. Hedging and multi‑year purchase agreements in 2024 reduced peaks but did not eliminate shocks. Smaller casting and forging sub‑suppliers created lead‑time bottlenecks, amplifying supplier power.

Global logistics and certification
Compliance with EU Stage V (in force since 2019) and EPA Tier 4 final (since 2014) narrows qualified supplier pools, raising entry barriers for engine and emissions components. Logistics disruptions heighten dependence on incumbents with proven capacity, while certification and validation often take months and deter rapid supplier switching. Localized sourcing reduces transit risk but constrains choice for niche parts.
- Reduced pool: stricter emissions standards limit qualified suppliers
- Dependency: logistics issues increase reliance on incumbent capacity
- Switching cost: certification/validation timelines and costs deter change
- Trade-off: local sourcing lowers risk but limits niche suppliers
Aftermarket parts and service tie-in
OEM-specified parts and proprietary software create captive aftermarket demand, letting suppliers push pricing and affect margins, though Wacker Neuson reported group sales of about EUR 2.9bn in 2024 and parts & service contributing roughly 18% of revenue, strengthening its negotiating position. Scale enables framework agreements and rebates (circa 8–12%), while private-label and in-house reman reduce supplier leverage.
- OEM tie-in: captive demand
- Supplier pricing: margin pressure
- Scale: EUR 2.9bn sales, ~18% services
- Rebates/frameworks: ~8–12%
- Private-label/reman: lowers supplier power
Supply limits, >12-month qual and 1,200 GWh shortage raise vendor leverage
Limited global suppliers for engines, hydraulics and electronics, long qualification cycles (>12 months) and 2024 semiconductor/battery tightness (global cell capacity ~1,200 GWh, IEA) raise supplier leverage vs Wacker Neuson (group sales ~EUR 2.9bn; parts & service ~18%). Hedging, framework rebates (~8–12%) and reman reduce but do not eliminate power.
| Metric | 2024 |
|---|---|
| Group sales | EUR 2.9bn |
| Parts & service | ~18% |
| Global cell capacity | ~1,200 GWh |
| Rebates/frameworks | ~8–12% |
What is included in the product
 Detailed Word Document
Tailored exclusively for Wacker Neuson, this Porter's Five Forces analysis uncovers key drivers of competition, customer influence, and market entry risks while identifying disruptive threats, substitutes, and supplier/buyer power that shape pricing and profitability.

 Customizable Excel Spreadsheet
One-sheet Porter's Five Forces for Wacker Neuson, showing supplier, buyer, substitute, entrant and competitive pressures at a glance—ideal for fast strategic decisions and board decks. Customize force levels and notes to reflect new data or scenarios without complex tools.
Customers Bargaining Power

Concentrated rental channel
Rental companies and large contractors buy in volume and standardize fleets, enabling aggressive tendering and strict total-cost-of-ownership demands that compress supplier margins. The global equipment rental market was about USD 110 billion in 2023, concentrating purchasing power among major groups. They can switch brands across categories if performance is comparable, forcing price concessions. Winning preferred-supplier status often requires discounts plus service and uptime guarantees.
Price sensitivity and lifecycle costs
Buyers prioritize uptime (>95% target), fuel/electric energy (often 20–30% of lifecycle costs) and resale value (typically 40–60% retained after 3 years), making transparent specs that enable cross-bidding among OEMs a key pressure point; extended warranties, financing and telematics-driven maintenance (reducing service costs by up to ~15%) can soften price sensitivity, while downturns amplify buyer bargaining power.

Product differentiation and brand trust
Wacker Neuson’s superior compaction and concrete technologies deliver measurable differentiation, with product uptime and compaction efficiency cited in 2024 field tests as up to 10% better than average competitors. Safety, reliability and ergonomics shift buyer focus from price to total cost of ownership, while a dealer network of ~1,000 (2024) strengthens service-based switching costs; however, widespread multi-brand fleets keep true lock-in limited.

Public tenders and compliance
Government and municipal buyers use formal tenders with strict specifications, increasing buyer power through structured competition and transparency; public procurement represents about 14% of EU GDP (European Commission). Compliance with sustainability and low-emission criteria (Stage V/zero-emission requirements increasingly mandated by 2024) raises entry costs for suppliers. Framework agreements, commonly 2–4 years, can cap prices and lock in volumes, compressing margins for Wacker Neuson.
- Formal tenders drive price transparency
- Sustainability rules (Stage V/electric) raise compliance costs
- Frameworks 2–4 years cap prices, limit upside
- Public procurement ≈14% of EU GDP (2024)
Rental vs ownership choices
Clients increasingly choose rental over ownership, creating a clear outside option that compresses willingness to pay; the global construction equipment rental market reached roughly USD 80–90 billion in 2024, increasing pricing pressure on upfront sales. Wacker Neuson’s own rental solutions partly internalize this dynamic, while service-level commitments and uptime guarantees shift buyer focus from headline price to total availability and lifecycle cost.
- Rental availability: raises outside option
- Pricing pressure: reduces upfront sale margins
- Internalization: Wacker Neuson rental mitigates churn
- Uptime/service: shifts competition to SLAs and lifecycle value
Large rental buyers squeeze margins; >95% uptime, 3y resale 40–60%, stricter regs
Large rental firms and contractors (global rental USD 80–90bn in 2024; equipment rental USD 110bn in 2023) concentrate buying, demand >95% uptime and compress margins; switching across brands is easy. Wacker Neuson’s ~1,000 dealers, +10% compaction edge and resale 40–60% after 3y reduce but don’t eliminate buyer power. Public tenders (~14% EU GDP) and Stage V/electric rules increase price pressure and compliance costs.
| Metric | Value (2023–24) |
|---|---|
| Global rental market | USD 80–90bn (2024) |
| Equipment rental | USD 110bn (2023) |
| Dealer network | ~1,000 (2024) |
| Uptime target | >95% |
| Resale 3y | 40–60% |
| Compaction advantage | up to 10% |
| Public procurement | ≈14% EU GDP |
Full Version Awaits
Wacker Neuson Porter's Five Forces Analysis
This Porter's Five Forces analysis of Wacker Neuson provides a concise, professional assessment of competitive rivalry, supplier and buyer power, threat of new entrants, and substitutes to inform strategic decisions. This preview is the exact document you’ll receive—fully formatted and ready to download immediately after purchase. No placeholders, no samples—what you see is what you get.

From Overview to Strategy Blueprint
Wacker Neuson faces moderate buyer power, intense supplier specialization, steady threat from substitutes, and barriers that limit new entrants—shaping a capital‑intensive competitive landscape. Our concise overview highlights strategic pressure points and growth levers. This brief snapshot only scratches the surface. Unlock the full Porter's Five Forces Analysis to explore Wacker Neuson’s competitive dynamics, market pressures, and strategic advantages in detail.
Suppliers Bargaining Power
Engine and hydraulics dependence
Core components like diesel engines, hydraulic systems and power electronics come from a limited set of global suppliers, concentrating supply and raising switching costs for Wacker Neuson. Supplier leverage is reinforced because qualification cycles for reliability, emissions and safety often exceed 12 months. Dual-sourcing is feasible but typically extends procurement timelines by another year and increases costs. This dependency elevates supplier bargaining power.
Specialized electronics and batteries
Electrification and telematics raise Wacker Neuson reliance on battery cells, inverters and control units, with global cell manufacturing capacity exceeding 1,200 GWh in 2024 (IEA), concentrating supplier power. Semiconductor and battery supply constraints in 2024 kept delivery schedules tight and contractual leverage with OEMs elevated. Proprietary design-in of modules locks vendors across product lifecycles; strategic partnerships reduce but do not eliminate supplier bargaining power.
Steel and raw material volatility
Steel, aluminum and rubber swings in 2024 drove BOM volatility—European hot‑rolled coil moved roughly ±18% year‑on‑year, LME aluminium about ±15% and natural rubber near ±22%, pressuring margins as suppliers often pass costs faster than Wacker Neuson can reprice. Hedging and multi‑year purchase agreements in 2024 reduced peaks but did not eliminate shocks. Smaller casting and forging sub‑suppliers created lead‑time bottlenecks, amplifying supplier power.
Global logistics and certification
Compliance with EU Stage V (in force since 2019) and EPA Tier 4 final (since 2014) narrows qualified supplier pools, raising entry barriers for engine and emissions components. Logistics disruptions heighten dependence on incumbents with proven capacity, while certification and validation often take months and deter rapid supplier switching. Localized sourcing reduces transit risk but constrains choice for niche parts.
- Reduced pool: stricter emissions standards limit qualified suppliers
- Dependency: logistics issues increase reliance on incumbent capacity
- Switching cost: certification/validation timelines and costs deter change
- Trade-off: local sourcing lowers risk but limits niche suppliers
Aftermarket parts and service tie-in
OEM-specified parts and proprietary software create captive aftermarket demand, letting suppliers push pricing and affect margins, though Wacker Neuson reported group sales of about EUR 2.9bn in 2024 and parts & service contributing roughly 18% of revenue, strengthening its negotiating position. Scale enables framework agreements and rebates (circa 8–12%), while private-label and in-house reman reduce supplier leverage.
- OEM tie-in: captive demand
- Supplier pricing: margin pressure
- Scale: EUR 2.9bn sales, ~18% services
- Rebates/frameworks: ~8–12%
- Private-label/reman: lowers supplier power
Supply limits, >12-month qual and 1,200 GWh shortage raise vendor leverage
Limited global suppliers for engines, hydraulics and electronics, long qualification cycles (>12 months) and 2024 semiconductor/battery tightness (global cell capacity ~1,200 GWh, IEA) raise supplier leverage vs Wacker Neuson (group sales ~EUR 2.9bn; parts & service ~18%). Hedging, framework rebates (~8–12%) and reman reduce but do not eliminate power.
| Metric | 2024 |
|---|---|
| Group sales | EUR 2.9bn |
| Parts & service | ~18% |
| Global cell capacity | ~1,200 GWh |
| Rebates/frameworks | ~8–12% |
What is included in the product
Detailed Word Document
Tailored exclusively for Wacker Neuson, this Porter's Five Forces analysis uncovers key drivers of competition, customer influence, and market entry risks while identifying disruptive threats, substitutes, and supplier/buyer power that shape pricing and profitability.
Customizable Excel Spreadsheet
One-sheet Porter's Five Forces for Wacker Neuson, showing supplier, buyer, substitute, entrant and competitive pressures at a glance—ideal for fast strategic decisions and board decks. Customize force levels and notes to reflect new data or scenarios without complex tools.
Customers Bargaining Power
Concentrated rental channel
Rental companies and large contractors buy in volume and standardize fleets, enabling aggressive tendering and strict total-cost-of-ownership demands that compress supplier margins. The global equipment rental market was about USD 110 billion in 2023, concentrating purchasing power among major groups. They can switch brands across categories if performance is comparable, forcing price concessions. Winning preferred-supplier status often requires discounts plus service and uptime guarantees.
Price sensitivity and lifecycle costs
Buyers prioritize uptime (>95% target), fuel/electric energy (often 20–30% of lifecycle costs) and resale value (typically 40–60% retained after 3 years), making transparent specs that enable cross-bidding among OEMs a key pressure point; extended warranties, financing and telematics-driven maintenance (reducing service costs by up to ~15%) can soften price sensitivity, while downturns amplify buyer bargaining power.
Product differentiation and brand trust
Wacker Neuson’s superior compaction and concrete technologies deliver measurable differentiation, with product uptime and compaction efficiency cited in 2024 field tests as up to 10% better than average competitors. Safety, reliability and ergonomics shift buyer focus from price to total cost of ownership, while a dealer network of ~1,000 (2024) strengthens service-based switching costs; however, widespread multi-brand fleets keep true lock-in limited.
Public tenders and compliance
Government and municipal buyers use formal tenders with strict specifications, increasing buyer power through structured competition and transparency; public procurement represents about 14% of EU GDP (European Commission). Compliance with sustainability and low-emission criteria (Stage V/zero-emission requirements increasingly mandated by 2024) raises entry costs for suppliers. Framework agreements, commonly 2–4 years, can cap prices and lock in volumes, compressing margins for Wacker Neuson.
- Formal tenders drive price transparency
- Sustainability rules (Stage V/electric) raise compliance costs
- Frameworks 2–4 years cap prices, limit upside
- Public procurement ≈14% of EU GDP (2024)
Rental vs ownership choices
Clients increasingly choose rental over ownership, creating a clear outside option that compresses willingness to pay; the global construction equipment rental market reached roughly USD 80–90 billion in 2024, increasing pricing pressure on upfront sales. Wacker Neuson’s own rental solutions partly internalize this dynamic, while service-level commitments and uptime guarantees shift buyer focus from headline price to total availability and lifecycle cost.
- Rental availability: raises outside option
- Pricing pressure: reduces upfront sale margins
- Internalization: Wacker Neuson rental mitigates churn
- Uptime/service: shifts competition to SLAs and lifecycle value
Large rental buyers squeeze margins; >95% uptime, 3y resale 40–60%, stricter regs
Large rental firms and contractors (global rental USD 80–90bn in 2024; equipment rental USD 110bn in 2023) concentrate buying, demand >95% uptime and compress margins; switching across brands is easy. Wacker Neuson’s ~1,000 dealers, +10% compaction edge and resale 40–60% after 3y reduce but don’t eliminate buyer power. Public tenders (~14% EU GDP) and Stage V/electric rules increase price pressure and compliance costs.
| Metric | Value (2023–24) |
|---|---|
| Global rental market | USD 80–90bn (2024) |
| Equipment rental | USD 110bn (2023) |
| Dealer network | ~1,000 (2024) |
| Uptime target | >95% |
| Resale 3y | 40–60% |
| Compaction advantage | up to 10% |
| Public procurement | ≈14% EU GDP |
Full Version Awaits
Wacker Neuson Porter's Five Forces Analysis
This Porter's Five Forces analysis of Wacker Neuson provides a concise, professional assessment of competitive rivalry, supplier and buyer power, threat of new entrants, and substitutes to inform strategic decisions. This preview is the exact document you’ll receive—fully formatted and ready to download immediately after purchase. No placeholders, no samples—what you see is what you get.
Original: $10.00
-65%$10.00
$3.50Description
From Overview to Strategy Blueprint
Wacker Neuson faces moderate buyer power, intense supplier specialization, steady threat from substitutes, and barriers that limit new entrants—shaping a capital‑intensive competitive landscape. Our concise overview highlights strategic pressure points and growth levers. This brief snapshot only scratches the surface. Unlock the full Porter's Five Forces Analysis to explore Wacker Neuson’s competitive dynamics, market pressures, and strategic advantages in detail.
Suppliers Bargaining Power
Engine and hydraulics dependence
Core components like diesel engines, hydraulic systems and power electronics come from a limited set of global suppliers, concentrating supply and raising switching costs for Wacker Neuson. Supplier leverage is reinforced because qualification cycles for reliability, emissions and safety often exceed 12 months. Dual-sourcing is feasible but typically extends procurement timelines by another year and increases costs. This dependency elevates supplier bargaining power.
Specialized electronics and batteries
Electrification and telematics raise Wacker Neuson reliance on battery cells, inverters and control units, with global cell manufacturing capacity exceeding 1,200 GWh in 2024 (IEA), concentrating supplier power. Semiconductor and battery supply constraints in 2024 kept delivery schedules tight and contractual leverage with OEMs elevated. Proprietary design-in of modules locks vendors across product lifecycles; strategic partnerships reduce but do not eliminate supplier bargaining power.
Steel and raw material volatility
Steel, aluminum and rubber swings in 2024 drove BOM volatility—European hot‑rolled coil moved roughly ±18% year‑on‑year, LME aluminium about ±15% and natural rubber near ±22%, pressuring margins as suppliers often pass costs faster than Wacker Neuson can reprice. Hedging and multi‑year purchase agreements in 2024 reduced peaks but did not eliminate shocks. Smaller casting and forging sub‑suppliers created lead‑time bottlenecks, amplifying supplier power.
Global logistics and certification
Compliance with EU Stage V (in force since 2019) and EPA Tier 4 final (since 2014) narrows qualified supplier pools, raising entry barriers for engine and emissions components. Logistics disruptions heighten dependence on incumbents with proven capacity, while certification and validation often take months and deter rapid supplier switching. Localized sourcing reduces transit risk but constrains choice for niche parts.
- Reduced pool: stricter emissions standards limit qualified suppliers
- Dependency: logistics issues increase reliance on incumbent capacity
- Switching cost: certification/validation timelines and costs deter change
- Trade-off: local sourcing lowers risk but limits niche suppliers
Aftermarket parts and service tie-in
OEM-specified parts and proprietary software create captive aftermarket demand, letting suppliers push pricing and affect margins, though Wacker Neuson reported group sales of about EUR 2.9bn in 2024 and parts & service contributing roughly 18% of revenue, strengthening its negotiating position. Scale enables framework agreements and rebates (circa 8–12%), while private-label and in-house reman reduce supplier leverage.
- OEM tie-in: captive demand
- Supplier pricing: margin pressure
- Scale: EUR 2.9bn sales, ~18% services
- Rebates/frameworks: ~8–12%
- Private-label/reman: lowers supplier power
Supply limits, >12-month qual and 1,200 GWh shortage raise vendor leverage
Limited global suppliers for engines, hydraulics and electronics, long qualification cycles (>12 months) and 2024 semiconductor/battery tightness (global cell capacity ~1,200 GWh, IEA) raise supplier leverage vs Wacker Neuson (group sales ~EUR 2.9bn; parts & service ~18%). Hedging, framework rebates (~8–12%) and reman reduce but do not eliminate power.
| Metric | 2024 |
|---|---|
| Group sales | EUR 2.9bn |
| Parts & service | ~18% |
| Global cell capacity | ~1,200 GWh |
| Rebates/frameworks | ~8–12% |
What is included in the product
Detailed Word Document
Tailored exclusively for Wacker Neuson, this Porter's Five Forces analysis uncovers key drivers of competition, customer influence, and market entry risks while identifying disruptive threats, substitutes, and supplier/buyer power that shape pricing and profitability.
Customizable Excel Spreadsheet
One-sheet Porter's Five Forces for Wacker Neuson, showing supplier, buyer, substitute, entrant and competitive pressures at a glance—ideal for fast strategic decisions and board decks. Customize force levels and notes to reflect new data or scenarios without complex tools.
Customers Bargaining Power
Concentrated rental channel
Rental companies and large contractors buy in volume and standardize fleets, enabling aggressive tendering and strict total-cost-of-ownership demands that compress supplier margins. The global equipment rental market was about USD 110 billion in 2023, concentrating purchasing power among major groups. They can switch brands across categories if performance is comparable, forcing price concessions. Winning preferred-supplier status often requires discounts plus service and uptime guarantees.
Price sensitivity and lifecycle costs
Buyers prioritize uptime (>95% target), fuel/electric energy (often 20–30% of lifecycle costs) and resale value (typically 40–60% retained after 3 years), making transparent specs that enable cross-bidding among OEMs a key pressure point; extended warranties, financing and telematics-driven maintenance (reducing service costs by up to ~15%) can soften price sensitivity, while downturns amplify buyer bargaining power.
Product differentiation and brand trust
Wacker Neuson’s superior compaction and concrete technologies deliver measurable differentiation, with product uptime and compaction efficiency cited in 2024 field tests as up to 10% better than average competitors. Safety, reliability and ergonomics shift buyer focus from price to total cost of ownership, while a dealer network of ~1,000 (2024) strengthens service-based switching costs; however, widespread multi-brand fleets keep true lock-in limited.
Public tenders and compliance
Government and municipal buyers use formal tenders with strict specifications, increasing buyer power through structured competition and transparency; public procurement represents about 14% of EU GDP (European Commission). Compliance with sustainability and low-emission criteria (Stage V/zero-emission requirements increasingly mandated by 2024) raises entry costs for suppliers. Framework agreements, commonly 2–4 years, can cap prices and lock in volumes, compressing margins for Wacker Neuson.
- Formal tenders drive price transparency
- Sustainability rules (Stage V/electric) raise compliance costs
- Frameworks 2–4 years cap prices, limit upside
- Public procurement ≈14% of EU GDP (2024)
Rental vs ownership choices
Clients increasingly choose rental over ownership, creating a clear outside option that compresses willingness to pay; the global construction equipment rental market reached roughly USD 80–90 billion in 2024, increasing pricing pressure on upfront sales. Wacker Neuson’s own rental solutions partly internalize this dynamic, while service-level commitments and uptime guarantees shift buyer focus from headline price to total availability and lifecycle cost.
- Rental availability: raises outside option
- Pricing pressure: reduces upfront sale margins
- Internalization: Wacker Neuson rental mitigates churn
- Uptime/service: shifts competition to SLAs and lifecycle value
Large rental buyers squeeze margins; >95% uptime, 3y resale 40–60%, stricter regs
Large rental firms and contractors (global rental USD 80–90bn in 2024; equipment rental USD 110bn in 2023) concentrate buying, demand >95% uptime and compress margins; switching across brands is easy. Wacker Neuson’s ~1,000 dealers, +10% compaction edge and resale 40–60% after 3y reduce but don’t eliminate buyer power. Public tenders (~14% EU GDP) and Stage V/electric rules increase price pressure and compliance costs.
| Metric | Value (2023–24) |
|---|---|
| Global rental market | USD 80–90bn (2024) |
| Equipment rental | USD 110bn (2023) |
| Dealer network | ~1,000 (2024) |
| Uptime target | >95% |
| Resale 3y | 40–60% |
| Compaction advantage | up to 10% |
| Public procurement | ≈14% EU GDP |
Full Version Awaits
Wacker Neuson Porter's Five Forces Analysis
This Porter's Five Forces analysis of Wacker Neuson provides a concise, professional assessment of competitive rivalry, supplier and buyer power, threat of new entrants, and substitutes to inform strategic decisions. This preview is the exact document you’ll receive—fully formatted and ready to download immediately after purchase. No placeholders, no samples—what you see is what you get.











