Waldencast Porter's Five Forces Analysis

A Must-Have Tool for Decision-Makers
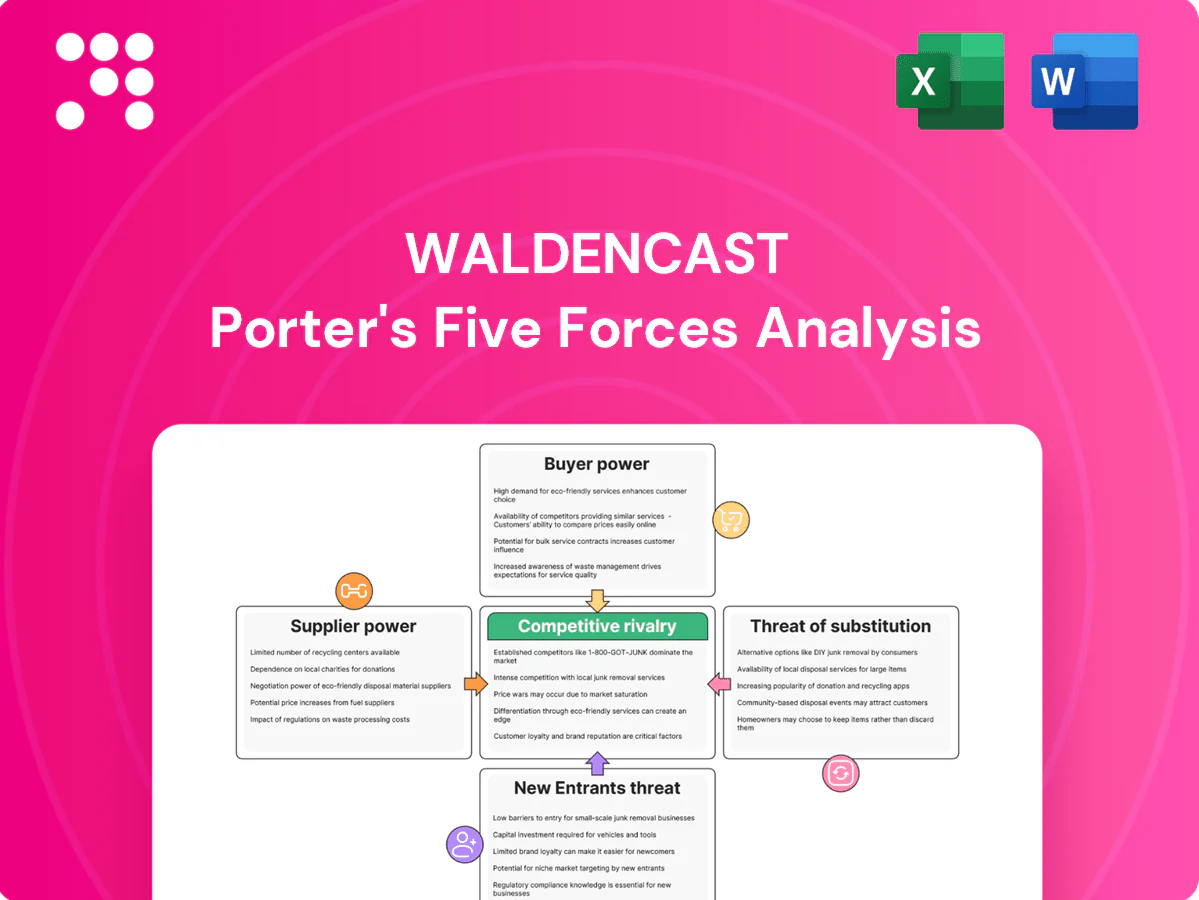
Waldencast's Porter's Five Forces snapshot highlights supplier leverage, buyer power, rivalry intensity, entry barriers and substitutes, showing key pressure points and strategic levers. This brief overview only scratches the surface. Unlock the full Porter's Five Forces Analysis for force-by-force ratings, visuals and actionable strategy.
Suppliers Bargaining Power

Specialty ingredient concentration
Many cosmetic actives and fragrances are concentrated among a few specialty houses; in 2024 the top 5 fragrance/flavor and aroma chemical suppliers (Givaudan, Firmenich/IFF, Symrise, Takasago, Mane) together controlled over 60% of the global market, increasing supplier leverage.
Scarcity of hero actives and proprietary formulations raises switching costs and sourcing risk for Waldencast, while exclusivity deals can secure access.
Waldencast must balance exclusivity with multi-sourcing and consider long-term agreements that lock supply but may fix pricing and reduce flexibility.
Contract manufacturing dependency
Third-party manufacturers control capacity, MOQs and lead times—top 10 CMOs held roughly 40% of global capacity in 2024—directly constraining Waldencast’s agility and compressing margins. Strict GMP, quality and audit regimes lengthen switch-over times and raise switching costs. Co-development of formulas with select CMOs deepens reliance, while dual-sourcing and building in-house R&D cut exposure but increase capex, complexity and OPEX.

Packaging and sustainability specs
Premium sustainable packaging has fewer qualified suppliers and typical lead times of 8–20 weeks for specialty substrates, concentrating supplier power. 2024 sustainable packaging demand is estimated at roughly USD 270–300 billion, pushing stricter material specs from regulators and corporates that narrow options. Custom molds and finishes create tooling lock-ins (tooling often costing tens of thousands), while volume commitments can buy 5–15% price flexibility.

Logistics and global footprint
International operations face freight volatility and customs delays that raise supplier leverage; global ocean spot volatility persisted into 2024 and 3PLs gained pricing power as firms paid premiums to avoid stockouts. Inbound ingredients and outbound DTC/retail fulfillment concentrate bargaining power with regional carriers and port handlers, while 3PL contracts and SLAs partially mitigate service risk. Nearshoring and higher safety stocks buffer disruptions but increased working capital and inventory days.
- 2024 3PL market ≈ $1.2T
- Inflated carrier dependence on regional lanes
- SLAs reduce but do not eliminate delay risk
- Nearshoring raises capex/Opex, ties up cash
Influencer and IP partners
Licensors, creators, and labs owning IP can demand higher fees and exclusivity; global influencer marketing spend was about 21.1 billion USD in 2023 and was projected above 23 billion USD in 2024, concentrating bargaining power among top partners. Co-branding raises demand but increases dependence on a few high-impact creators; clear IP ownership and buyout clauses cut hold-up risk, while a diversified partner portfolio dilutes single-partner leverage.
- Licensors: fee/exclusivity leverage
- Co-branding: higher demand, concentrated risk
- Clauses: reduce hold-up
- Portfolio: lowers single-partner power
Supplier leverage surges: top-5 fragrance >60%, CMOs ~40%
Supplier concentration is high: top 5 fragrance/flavor suppliers held >60% of market in 2024, boosting leverage. CMOs held ~40% of global capacity in 2024, raising lead-time and MOQ risk. Sustainable-packaging demand (~USD 270–300B) and 3PL market (~USD 1.2T) tightened supplier power; influencer spend exceeded USD 23B in 2024, concentrating partner leverage.
| Metric | 2024 Value |
|---|---|
| Top-5 fragrance share | >60% |
| Top-10 CMO capacity | ~40% |
| Sustainable packaging market | USD 270–300B |
| 3PL market | ~USD 1.2T |
| Influencer spend | >USD 23B |
What is included in the product
 Detailed Word Document
Tailored Porter's Five Forces analysis for Waldencast that uncovers key competitive drivers, buyer/supplier power, entry barriers, substitutes, and emerging threats to its market position.

 Customizable Excel Spreadsheet
A concise, ready-to-use Porter's Five Forces template that distills competitive pressures into a single page for fast strategic decisions, with editable scores and a radar chart to visualize shifting threats at a glance.
Customers Bargaining Power

Retailer consolidation
Global beauty chains and mass retailers such as Sephora (≈2,900 stores in 2023), Ulta (≈1,400 US stores in 2024) and Walmart (≈4,700 US stores in 2024) command shelf space and terms, with slotting fees and chargebacks plus promotional trade spend—often 20–30% of sales—compressing margins. Multi-brand scale improves negotiation but underperformance risks delisting, while omnichannel sell-through data can boost inventory turns and forecasting accuracy by up to 20%, strengthening retailer leverage.
Low consumer switching costs
Beauty shoppers experiment frequently and shift with trends, feeding low switching costs in a global beauty market valued at about $500 billion in 2024. Abundant indie brands, mass sampling and online discovery erode loyalty and raise buyer power. Strong brand equity and proven efficacy claims can blunt churn. Subscription and loyalty programs (tens of millions of members across major players) help anchor repeat purchase.

Price transparency online
E-commerce price transparency—with online sales near 24% of global retail in 2024—makes cross-store comparisons easy, compressing ASPs and margin leeway. Reviews and social proof drive informed buying, with roughly 79% of shoppers consulting reviews before purchase. Limited editions and clear differentiation preserve premium pricing, while bundles and personalized regimens can boost average order value by 15–30%.

DTC vs marketplace dynamics
Marketplaces extract commissions and control visibility via algorithms—Amazon referral fees in 2024 range 6–45% with a common ~15%—while DTC preserves first‑party data and can recapture those margins but requires CAC investment via ads and retention.
- Channel mix shapes buyer leverage and negotiation exposure
- Consistent pricing and MAP reduce channel conflict
- DTC boosts data ownership and margin potential
Regulatory and safety expectations
Consumers now demand clean, cruelty-free, and compliant products; in 2024, 69% of global consumers said they avoid products tested on animals (Statista 2024). Heightened safety and regulatory standards raise the cost of failure and returns, increasing potential recall and remediation expenses. Certifications and transparent sourcing reduce perceived risk, while clear substantiated claims build trust and lower price sensitivity.
- 69% avoid animal-tested products (Statista 2024)
- Certifications reduce perceived risk
- Clear claims lower price sensitivity
Beauty market $500B: 24% online, trade spend 20–30%
Retailers (Sephora ≈2,900 stores 2023; Ulta ≈1,400 US stores 2024; Walmart ≈4,700 US stores 2024) and trade spend (20–30% of sales) drive strong buyer leverage. Consumers face low switching costs in a $500B beauty market (2024) with 24% online sales and 79% consulting reviews, boosting price sensitivity. Marketplaces (~15% referral) compress margins; DTC restores data and margin but raises CAC.
| Metric | Value (2024) |
|---|---|
| Global market | $500B |
| Online retail share | 24% |
| Review consult | 79% |
| Marketplace fee | ~15% |
| Trade spend | 20–30% |
Full Version Awaits
Waldencast Porter's Five Forces Analysis
This preview shows the Waldencast Porter's Five Forces Analysis exactly as delivered after purchase—comprehensive, professionally formatted, and ready to download. No placeholders or mockups; the document you see is the full deliverable. Instant access upon payment.

A Must-Have Tool for Decision-Makers
Waldencast's Porter's Five Forces snapshot highlights supplier leverage, buyer power, rivalry intensity, entry barriers and substitutes, showing key pressure points and strategic levers. This brief overview only scratches the surface. Unlock the full Porter's Five Forces Analysis for force-by-force ratings, visuals and actionable strategy.
Suppliers Bargaining Power
Specialty ingredient concentration
Many cosmetic actives and fragrances are concentrated among a few specialty houses; in 2024 the top 5 fragrance/flavor and aroma chemical suppliers (Givaudan, Firmenich/IFF, Symrise, Takasago, Mane) together controlled over 60% of the global market, increasing supplier leverage.
Scarcity of hero actives and proprietary formulations raises switching costs and sourcing risk for Waldencast, while exclusivity deals can secure access.
Waldencast must balance exclusivity with multi-sourcing and consider long-term agreements that lock supply but may fix pricing and reduce flexibility.
Contract manufacturing dependency
Third-party manufacturers control capacity, MOQs and lead times—top 10 CMOs held roughly 40% of global capacity in 2024—directly constraining Waldencast’s agility and compressing margins. Strict GMP, quality and audit regimes lengthen switch-over times and raise switching costs. Co-development of formulas with select CMOs deepens reliance, while dual-sourcing and building in-house R&D cut exposure but increase capex, complexity and OPEX.
Packaging and sustainability specs
Premium sustainable packaging has fewer qualified suppliers and typical lead times of 8–20 weeks for specialty substrates, concentrating supplier power. 2024 sustainable packaging demand is estimated at roughly USD 270–300 billion, pushing stricter material specs from regulators and corporates that narrow options. Custom molds and finishes create tooling lock-ins (tooling often costing tens of thousands), while volume commitments can buy 5–15% price flexibility.
Logistics and global footprint
International operations face freight volatility and customs delays that raise supplier leverage; global ocean spot volatility persisted into 2024 and 3PLs gained pricing power as firms paid premiums to avoid stockouts. Inbound ingredients and outbound DTC/retail fulfillment concentrate bargaining power with regional carriers and port handlers, while 3PL contracts and SLAs partially mitigate service risk. Nearshoring and higher safety stocks buffer disruptions but increased working capital and inventory days.
- 2024 3PL market ≈ $1.2T
- Inflated carrier dependence on regional lanes
- SLAs reduce but do not eliminate delay risk
- Nearshoring raises capex/Opex, ties up cash
Influencer and IP partners
Licensors, creators, and labs owning IP can demand higher fees and exclusivity; global influencer marketing spend was about 21.1 billion USD in 2023 and was projected above 23 billion USD in 2024, concentrating bargaining power among top partners. Co-branding raises demand but increases dependence on a few high-impact creators; clear IP ownership and buyout clauses cut hold-up risk, while a diversified partner portfolio dilutes single-partner leverage.
- Licensors: fee/exclusivity leverage
- Co-branding: higher demand, concentrated risk
- Clauses: reduce hold-up
- Portfolio: lowers single-partner power
Supplier leverage surges: top-5 fragrance >60%, CMOs ~40%
Supplier concentration is high: top 5 fragrance/flavor suppliers held >60% of market in 2024, boosting leverage. CMOs held ~40% of global capacity in 2024, raising lead-time and MOQ risk. Sustainable-packaging demand (~USD 270–300B) and 3PL market (~USD 1.2T) tightened supplier power; influencer spend exceeded USD 23B in 2024, concentrating partner leverage.
| Metric | 2024 Value |
|---|---|
| Top-5 fragrance share | >60% |
| Top-10 CMO capacity | ~40% |
| Sustainable packaging market | USD 270–300B |
| 3PL market | ~USD 1.2T |
| Influencer spend | >USD 23B |
What is included in the product
Detailed Word Document
Tailored Porter's Five Forces analysis for Waldencast that uncovers key competitive drivers, buyer/supplier power, entry barriers, substitutes, and emerging threats to its market position.
Customizable Excel Spreadsheet
A concise, ready-to-use Porter's Five Forces template that distills competitive pressures into a single page for fast strategic decisions, with editable scores and a radar chart to visualize shifting threats at a glance.
Customers Bargaining Power
Retailer consolidation
Global beauty chains and mass retailers such as Sephora (≈2,900 stores in 2023), Ulta (≈1,400 US stores in 2024) and Walmart (≈4,700 US stores in 2024) command shelf space and terms, with slotting fees and chargebacks plus promotional trade spend—often 20–30% of sales—compressing margins. Multi-brand scale improves negotiation but underperformance risks delisting, while omnichannel sell-through data can boost inventory turns and forecasting accuracy by up to 20%, strengthening retailer leverage.
Low consumer switching costs
Beauty shoppers experiment frequently and shift with trends, feeding low switching costs in a global beauty market valued at about $500 billion in 2024. Abundant indie brands, mass sampling and online discovery erode loyalty and raise buyer power. Strong brand equity and proven efficacy claims can blunt churn. Subscription and loyalty programs (tens of millions of members across major players) help anchor repeat purchase.
Price transparency online
E-commerce price transparency—with online sales near 24% of global retail in 2024—makes cross-store comparisons easy, compressing ASPs and margin leeway. Reviews and social proof drive informed buying, with roughly 79% of shoppers consulting reviews before purchase. Limited editions and clear differentiation preserve premium pricing, while bundles and personalized regimens can boost average order value by 15–30%.
DTC vs marketplace dynamics
Marketplaces extract commissions and control visibility via algorithms—Amazon referral fees in 2024 range 6–45% with a common ~15%—while DTC preserves first‑party data and can recapture those margins but requires CAC investment via ads and retention.
- Channel mix shapes buyer leverage and negotiation exposure
- Consistent pricing and MAP reduce channel conflict
- DTC boosts data ownership and margin potential
Regulatory and safety expectations
Consumers now demand clean, cruelty-free, and compliant products; in 2024, 69% of global consumers said they avoid products tested on animals (Statista 2024). Heightened safety and regulatory standards raise the cost of failure and returns, increasing potential recall and remediation expenses. Certifications and transparent sourcing reduce perceived risk, while clear substantiated claims build trust and lower price sensitivity.
- 69% avoid animal-tested products (Statista 2024)
- Certifications reduce perceived risk
- Clear claims lower price sensitivity
Beauty market $500B: 24% online, trade spend 20–30%
Retailers (Sephora ≈2,900 stores 2023; Ulta ≈1,400 US stores 2024; Walmart ≈4,700 US stores 2024) and trade spend (20–30% of sales) drive strong buyer leverage. Consumers face low switching costs in a $500B beauty market (2024) with 24% online sales and 79% consulting reviews, boosting price sensitivity. Marketplaces (~15% referral) compress margins; DTC restores data and margin but raises CAC.
| Metric | Value (2024) |
|---|---|
| Global market | $500B |
| Online retail share | 24% |
| Review consult | 79% |
| Marketplace fee | ~15% |
| Trade spend | 20–30% |
Full Version Awaits
Waldencast Porter's Five Forces Analysis
This preview shows the Waldencast Porter's Five Forces Analysis exactly as delivered after purchase—comprehensive, professionally formatted, and ready to download. No placeholders or mockups; the document you see is the full deliverable. Instant access upon payment.
Description
A Must-Have Tool for Decision-Makers
Waldencast's Porter's Five Forces snapshot highlights supplier leverage, buyer power, rivalry intensity, entry barriers and substitutes, showing key pressure points and strategic levers. This brief overview only scratches the surface. Unlock the full Porter's Five Forces Analysis for force-by-force ratings, visuals and actionable strategy.
Suppliers Bargaining Power
Specialty ingredient concentration
Many cosmetic actives and fragrances are concentrated among a few specialty houses; in 2024 the top 5 fragrance/flavor and aroma chemical suppliers (Givaudan, Firmenich/IFF, Symrise, Takasago, Mane) together controlled over 60% of the global market, increasing supplier leverage.
Scarcity of hero actives and proprietary formulations raises switching costs and sourcing risk for Waldencast, while exclusivity deals can secure access.
Waldencast must balance exclusivity with multi-sourcing and consider long-term agreements that lock supply but may fix pricing and reduce flexibility.
Contract manufacturing dependency
Third-party manufacturers control capacity, MOQs and lead times—top 10 CMOs held roughly 40% of global capacity in 2024—directly constraining Waldencast’s agility and compressing margins. Strict GMP, quality and audit regimes lengthen switch-over times and raise switching costs. Co-development of formulas with select CMOs deepens reliance, while dual-sourcing and building in-house R&D cut exposure but increase capex, complexity and OPEX.
Packaging and sustainability specs
Premium sustainable packaging has fewer qualified suppliers and typical lead times of 8–20 weeks for specialty substrates, concentrating supplier power. 2024 sustainable packaging demand is estimated at roughly USD 270–300 billion, pushing stricter material specs from regulators and corporates that narrow options. Custom molds and finishes create tooling lock-ins (tooling often costing tens of thousands), while volume commitments can buy 5–15% price flexibility.
Logistics and global footprint
International operations face freight volatility and customs delays that raise supplier leverage; global ocean spot volatility persisted into 2024 and 3PLs gained pricing power as firms paid premiums to avoid stockouts. Inbound ingredients and outbound DTC/retail fulfillment concentrate bargaining power with regional carriers and port handlers, while 3PL contracts and SLAs partially mitigate service risk. Nearshoring and higher safety stocks buffer disruptions but increased working capital and inventory days.
- 2024 3PL market ≈ $1.2T
- Inflated carrier dependence on regional lanes
- SLAs reduce but do not eliminate delay risk
- Nearshoring raises capex/Opex, ties up cash
Influencer and IP partners
Licensors, creators, and labs owning IP can demand higher fees and exclusivity; global influencer marketing spend was about 21.1 billion USD in 2023 and was projected above 23 billion USD in 2024, concentrating bargaining power among top partners. Co-branding raises demand but increases dependence on a few high-impact creators; clear IP ownership and buyout clauses cut hold-up risk, while a diversified partner portfolio dilutes single-partner leverage.
- Licensors: fee/exclusivity leverage
- Co-branding: higher demand, concentrated risk
- Clauses: reduce hold-up
- Portfolio: lowers single-partner power
Supplier leverage surges: top-5 fragrance >60%, CMOs ~40%
Supplier concentration is high: top 5 fragrance/flavor suppliers held >60% of market in 2024, boosting leverage. CMOs held ~40% of global capacity in 2024, raising lead-time and MOQ risk. Sustainable-packaging demand (~USD 270–300B) and 3PL market (~USD 1.2T) tightened supplier power; influencer spend exceeded USD 23B in 2024, concentrating partner leverage.
| Metric | 2024 Value |
|---|---|
| Top-5 fragrance share | >60% |
| Top-10 CMO capacity | ~40% |
| Sustainable packaging market | USD 270–300B |
| 3PL market | ~USD 1.2T |
| Influencer spend | >USD 23B |
What is included in the product
Detailed Word Document
Tailored Porter's Five Forces analysis for Waldencast that uncovers key competitive drivers, buyer/supplier power, entry barriers, substitutes, and emerging threats to its market position.
Customizable Excel Spreadsheet
A concise, ready-to-use Porter's Five Forces template that distills competitive pressures into a single page for fast strategic decisions, with editable scores and a radar chart to visualize shifting threats at a glance.
Customers Bargaining Power
Retailer consolidation
Global beauty chains and mass retailers such as Sephora (≈2,900 stores in 2023), Ulta (≈1,400 US stores in 2024) and Walmart (≈4,700 US stores in 2024) command shelf space and terms, with slotting fees and chargebacks plus promotional trade spend—often 20–30% of sales—compressing margins. Multi-brand scale improves negotiation but underperformance risks delisting, while omnichannel sell-through data can boost inventory turns and forecasting accuracy by up to 20%, strengthening retailer leverage.
Low consumer switching costs
Beauty shoppers experiment frequently and shift with trends, feeding low switching costs in a global beauty market valued at about $500 billion in 2024. Abundant indie brands, mass sampling and online discovery erode loyalty and raise buyer power. Strong brand equity and proven efficacy claims can blunt churn. Subscription and loyalty programs (tens of millions of members across major players) help anchor repeat purchase.
Price transparency online
E-commerce price transparency—with online sales near 24% of global retail in 2024—makes cross-store comparisons easy, compressing ASPs and margin leeway. Reviews and social proof drive informed buying, with roughly 79% of shoppers consulting reviews before purchase. Limited editions and clear differentiation preserve premium pricing, while bundles and personalized regimens can boost average order value by 15–30%.
DTC vs marketplace dynamics
Marketplaces extract commissions and control visibility via algorithms—Amazon referral fees in 2024 range 6–45% with a common ~15%—while DTC preserves first‑party data and can recapture those margins but requires CAC investment via ads and retention.
- Channel mix shapes buyer leverage and negotiation exposure
- Consistent pricing and MAP reduce channel conflict
- DTC boosts data ownership and margin potential
Regulatory and safety expectations
Consumers now demand clean, cruelty-free, and compliant products; in 2024, 69% of global consumers said they avoid products tested on animals (Statista 2024). Heightened safety and regulatory standards raise the cost of failure and returns, increasing potential recall and remediation expenses. Certifications and transparent sourcing reduce perceived risk, while clear substantiated claims build trust and lower price sensitivity.
- 69% avoid animal-tested products (Statista 2024)
- Certifications reduce perceived risk
- Clear claims lower price sensitivity
Beauty market $500B: 24% online, trade spend 20–30%
Retailers (Sephora ≈2,900 stores 2023; Ulta ≈1,400 US stores 2024; Walmart ≈4,700 US stores 2024) and trade spend (20–30% of sales) drive strong buyer leverage. Consumers face low switching costs in a $500B beauty market (2024) with 24% online sales and 79% consulting reviews, boosting price sensitivity. Marketplaces (~15% referral) compress margins; DTC restores data and margin but raises CAC.
| Metric | Value (2024) |
|---|---|
| Global market | $500B |
| Online retail share | 24% |
| Review consult | 79% |
| Marketplace fee | ~15% |
| Trade spend | 20–30% |
Full Version Awaits
Waldencast Porter's Five Forces Analysis
This preview shows the Waldencast Porter's Five Forces Analysis exactly as delivered after purchase—comprehensive, professionally formatted, and ready to download. No placeholders or mockups; the document you see is the full deliverable. Instant access upon payment.











