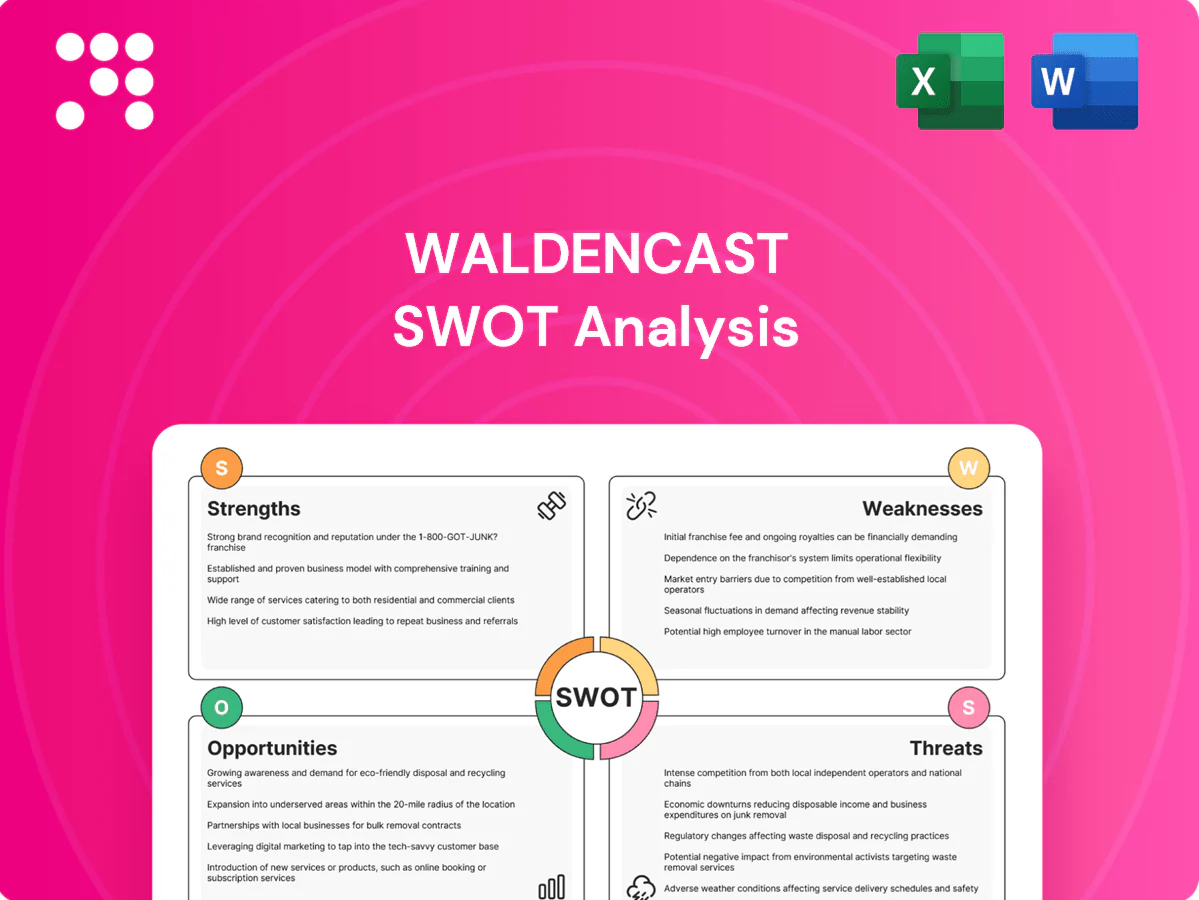
Waldencast SWOT Analysis

Elevate Your Analysis with the Complete SWOT Report
Waldencast’s snapshot reveals strong audience engagement and creative IP potential, but also scaling challenges and market concentration risks. Our full SWOT analysis unpacks competitive positioning, revenue drivers, and mitigation strategies with research-backed detail. Purchase the complete report for an editable Word and Excel package to support strategic planning, pitches, and investment decisions.
Strengths

Multi-brand portfolio scale
Operating as a platform diversifies risk across categories and segments, reducing concentration exposure while enabling redeployment of capital to high-growth brands. Shared R&D, supply-chain and marketing platforms drive scale: industry studies (McKinsey/BCG) show shared-services can cut overhead 20–30%, lifting EBITDA margins. Broad portfolio enables faster test-and-learn cycles, reallocating spend to winners and supporting resilient growth through cycles.
Purpose-driven brand positioning
Purpose-driven positioning taps a market where 65% of consumers say values influence purchases, enabling Waldencast to justify 10–15% premium pricing versus purely functional peers and drive stronger loyalty metrics.
Retailers increasingly favor mission brands—raising category entry rates—and influencers show higher engagement rates when aligned with purpose.
Employer brand strength also improves: about 70% of jobseekers prioritize company purpose when choosing employers.

Americas and International footprint
Diversified Americas and international footprint reduces single-market dependence, leveraging the US market which comprises roughly 25% of global GDP to balance regional downturns. Localized go-to-market teams enable tailored assortments and pricing to regional tastes, improving conversion and retention. Cross-region performance helps hedge currency and macro cycles, while global reach supports faster scale-up of acquired brands across markets.

Acquisition and acceleration capabilities
A repeatable M&A playbook can unlock inorganic growth and improve deal outcomes in a market where roughly 70% of acquisitions historically underdeliver. Centralized brand, digital, and retail capabilities accelerate time-to-scale, often shortening roll-out by about 30% in roll-up models. Structured integration reduces execution risk and cost duplication, creating a pipeline to compound brand value.
- Tag: M&A playbook — increases deal success vs market baseline (~70% underperformance)
- Tag: Centralized capabilities — ~30% faster scale-up
- Tag: Integration — lowers execution risk and avoids duplicate costs
Omnichannel distribution know-how
Balanced DTC and wholesale improves reach and unit economics by combining direct-margin capture with partner-driven volume; DTC data then informs product, pricing, and media allocation to boost efficiency. Wholesale partners amplify awareness and trial at scale, while the blend raises lifetime value and helps manage CAC to industry LTV:CAC benchmarks around 3:1 (2024 guidance).
- 13.4% US e‑commerce share (2023)
- LTV:CAC ~3:1 benchmark (2024)
- DTC informs pricing/media
- Wholesale scales awareness/trial
Platform model cuts opex 20-30%, yields 10-15% price premium; LTV:CAC ~3:1
Platform model diversifies risk; shared services cut overhead 20–30% and lift EBITDA. Purpose drives 10–15% premium, 65% of consumers influenced by values and 70% of jobseekers prefer purpose. Balanced DTC/wholesale supports LTV:CAC ~3:1 and leverages 13.4% US e‑commerce share (2023).
| Metric | Value |
|---|---|
| Shared services | 20–30% Opex↓ |
| Price premium | 10–15% |
| LTV:CAC | ~3:1 (2024) |
What is included in the product
 Detailed Word Document
Delivers a strategic overview of Waldencast’s internal and external business factors, outlining strengths, weaknesses, opportunities and threats to its competitive position, operational performance and growth prospects.

 Customizable Excel Spreadsheet
Delivers a concise visual Waldencast SWOT matrix to pinpoint strategic pain points and align teams quickly; editable layout enables rapid updates as priorities shift, relieving analysis paralysis.
Weaknesses

Integration complexity
Bringing multiple brands onto a common platform strains systems and teams; Harvard Business Review reports about 70% of mergers fail to deliver expected synergies. Misaligned cultures or processes—cited by Deloitte in roughly 60% of cases—can delay synergies and elevate near-term operating costs. Integration missteps risk customer experience and brand equity, often increasing operating costs by double-digit percentages during transition.
Portfolio dependency on few winners
Platform models typically follow a Pareto pattern where roughly 20% of brands generate about 80% of revenue, so WaldenCast’s dependence on a few growth engines creates outsized exposure.
Underperformance of a lead brand can therefore disproportionately drag top-line and EBITDA; empirical platform cases show recovery often requires 12–18 months and substantial marketing and acquisition spend to replace a stalled hero.
Such concentration elevates revenue and EBITDA volatility, magnifying quarter-to-quarter swings and increasing downside risk for investors.

Working-capital intensity
Beauty's SKU breadth across shades, sizes and sets forces high inventory depth, and scaling internationally adds safety stock that can lengthen cash conversion cycles by weeks. Retailer payment terms often run 60–120 days, pressuring liquidity and raising working-capital needs. This reduces flexibility to fund marketing spend and opportunistic M&A, constraining growth options. Industry margins tighten as capital is tied up in inventory.

Brand dilution risk
Cross-brand playbooks at Waldencast may clash with individual brand DNA, reducing relevance; 2024 surveys show 65% of consumers cite authenticity as a key purchase driver, so over-standardization risks eroding engagement and loyalty.
Frequent portfolio shifts can confuse retailers and shoppers—retailers report a 22% rise in replenishment errors when SKUs change rapidly—while preserving distinct voices increases operating complexity and costs.
- Authenticity risk: 65% consumer preference
- Retail friction: +22% replenishment errors
- Higher Opex to maintain distinct voices
Exposure to marketing efficiency
Growth is highly sensitive to paid-media ROI and platform algorithm shifts; industry reports showed average app-install CAC rose ~20–30% after privacy updates through 2021–24, raising acquisition risk.
Rising CAC compresses gross margins and slows user acquisition velocity, making scale costlier for mid-stage SaaS and DTC brands.
Creative fatigue and targeting loss from privacy changes force continuous A/B testing and content refresh to sustain growth.
- Paid-media ROI dependence
- CAC up ~20–30% (2021–24 industry data)
- Algorithm risk & creative fatigue
- Requires constant testing & refresh
Roll-up risks: 70% synergy failures, CAC +20–30%
Integration risk: 70% of roll-ups miss synergies; 60% cite cultural/process misfit, often raising costs and harming CX. Revenue concentration follows 20/80, with lead-brand slumps needing 12–18 months and heavy spend to recover. Cash strain from 60–120 day pay terms and high SKU inventory lengthens cycles; CAC rose ~20–30% (2021–24), compressing margins.
| Metric | Value |
|---|---|
| M&A synergy failure | 70% |
| Cultural misfit | 60% |
| Revenue concentration | 20/80 |
| Recovery time | 12–18m |
| Payment terms | 60–120d |
| CAC change | +20–30% |
Preview Before You Purchase
Waldencast SWOT Analysis
This is the actual Waldencast SWOT analysis document you’ll receive upon purchase—no surprises, just professional quality. The preview below is taken directly from the full SWOT report you'll get; purchase unlocks the complete, editable version. You’re viewing a live preview of the real file—buy now to access the entire, detailed report.

Elevate Your Analysis with the Complete SWOT Report
Waldencast’s snapshot reveals strong audience engagement and creative IP potential, but also scaling challenges and market concentration risks. Our full SWOT analysis unpacks competitive positioning, revenue drivers, and mitigation strategies with research-backed detail. Purchase the complete report for an editable Word and Excel package to support strategic planning, pitches, and investment decisions.
Strengths
Multi-brand portfolio scale
Operating as a platform diversifies risk across categories and segments, reducing concentration exposure while enabling redeployment of capital to high-growth brands. Shared R&D, supply-chain and marketing platforms drive scale: industry studies (McKinsey/BCG) show shared-services can cut overhead 20–30%, lifting EBITDA margins. Broad portfolio enables faster test-and-learn cycles, reallocating spend to winners and supporting resilient growth through cycles.
Purpose-driven brand positioning
Purpose-driven positioning taps a market where 65% of consumers say values influence purchases, enabling Waldencast to justify 10–15% premium pricing versus purely functional peers and drive stronger loyalty metrics.
Retailers increasingly favor mission brands—raising category entry rates—and influencers show higher engagement rates when aligned with purpose.
Employer brand strength also improves: about 70% of jobseekers prioritize company purpose when choosing employers.
Americas and International footprint
Diversified Americas and international footprint reduces single-market dependence, leveraging the US market which comprises roughly 25% of global GDP to balance regional downturns. Localized go-to-market teams enable tailored assortments and pricing to regional tastes, improving conversion and retention. Cross-region performance helps hedge currency and macro cycles, while global reach supports faster scale-up of acquired brands across markets.
Acquisition and acceleration capabilities
A repeatable M&A playbook can unlock inorganic growth and improve deal outcomes in a market where roughly 70% of acquisitions historically underdeliver. Centralized brand, digital, and retail capabilities accelerate time-to-scale, often shortening roll-out by about 30% in roll-up models. Structured integration reduces execution risk and cost duplication, creating a pipeline to compound brand value.
- Tag: M&A playbook — increases deal success vs market baseline (~70% underperformance)
- Tag: Centralized capabilities — ~30% faster scale-up
- Tag: Integration — lowers execution risk and avoids duplicate costs
Omnichannel distribution know-how
Balanced DTC and wholesale improves reach and unit economics by combining direct-margin capture with partner-driven volume; DTC data then informs product, pricing, and media allocation to boost efficiency. Wholesale partners amplify awareness and trial at scale, while the blend raises lifetime value and helps manage CAC to industry LTV:CAC benchmarks around 3:1 (2024 guidance).
- 13.4% US e‑commerce share (2023)
- LTV:CAC ~3:1 benchmark (2024)
- DTC informs pricing/media
- Wholesale scales awareness/trial
Platform model cuts opex 20-30%, yields 10-15% price premium; LTV:CAC ~3:1
Platform model diversifies risk; shared services cut overhead 20–30% and lift EBITDA. Purpose drives 10–15% premium, 65% of consumers influenced by values and 70% of jobseekers prefer purpose. Balanced DTC/wholesale supports LTV:CAC ~3:1 and leverages 13.4% US e‑commerce share (2023).
| Metric | Value |
|---|---|
| Shared services | 20–30% Opex↓ |
| Price premium | 10–15% |
| LTV:CAC | ~3:1 (2024) |
What is included in the product
Detailed Word Document
Delivers a strategic overview of Waldencast’s internal and external business factors, outlining strengths, weaknesses, opportunities and threats to its competitive position, operational performance and growth prospects.
Customizable Excel Spreadsheet
Delivers a concise visual Waldencast SWOT matrix to pinpoint strategic pain points and align teams quickly; editable layout enables rapid updates as priorities shift, relieving analysis paralysis.
Weaknesses
Integration complexity
Bringing multiple brands onto a common platform strains systems and teams; Harvard Business Review reports about 70% of mergers fail to deliver expected synergies. Misaligned cultures or processes—cited by Deloitte in roughly 60% of cases—can delay synergies and elevate near-term operating costs. Integration missteps risk customer experience and brand equity, often increasing operating costs by double-digit percentages during transition.
Portfolio dependency on few winners
Platform models typically follow a Pareto pattern where roughly 20% of brands generate about 80% of revenue, so WaldenCast’s dependence on a few growth engines creates outsized exposure.
Underperformance of a lead brand can therefore disproportionately drag top-line and EBITDA; empirical platform cases show recovery often requires 12–18 months and substantial marketing and acquisition spend to replace a stalled hero.
Such concentration elevates revenue and EBITDA volatility, magnifying quarter-to-quarter swings and increasing downside risk for investors.
Working-capital intensity
Beauty's SKU breadth across shades, sizes and sets forces high inventory depth, and scaling internationally adds safety stock that can lengthen cash conversion cycles by weeks. Retailer payment terms often run 60–120 days, pressuring liquidity and raising working-capital needs. This reduces flexibility to fund marketing spend and opportunistic M&A, constraining growth options. Industry margins tighten as capital is tied up in inventory.
Brand dilution risk
Cross-brand playbooks at Waldencast may clash with individual brand DNA, reducing relevance; 2024 surveys show 65% of consumers cite authenticity as a key purchase driver, so over-standardization risks eroding engagement and loyalty.
Frequent portfolio shifts can confuse retailers and shoppers—retailers report a 22% rise in replenishment errors when SKUs change rapidly—while preserving distinct voices increases operating complexity and costs.
- Authenticity risk: 65% consumer preference
- Retail friction: +22% replenishment errors
- Higher Opex to maintain distinct voices
Exposure to marketing efficiency
Growth is highly sensitive to paid-media ROI and platform algorithm shifts; industry reports showed average app-install CAC rose ~20–30% after privacy updates through 2021–24, raising acquisition risk.
Rising CAC compresses gross margins and slows user acquisition velocity, making scale costlier for mid-stage SaaS and DTC brands.
Creative fatigue and targeting loss from privacy changes force continuous A/B testing and content refresh to sustain growth.
- Paid-media ROI dependence
- CAC up ~20–30% (2021–24 industry data)
- Algorithm risk & creative fatigue
- Requires constant testing & refresh
Roll-up risks: 70% synergy failures, CAC +20–30%
Integration risk: 70% of roll-ups miss synergies; 60% cite cultural/process misfit, often raising costs and harming CX. Revenue concentration follows 20/80, with lead-brand slumps needing 12–18 months and heavy spend to recover. Cash strain from 60–120 day pay terms and high SKU inventory lengthens cycles; CAC rose ~20–30% (2021–24), compressing margins.
| Metric | Value |
|---|---|
| M&A synergy failure | 70% |
| Cultural misfit | 60% |
| Revenue concentration | 20/80 |
| Recovery time | 12–18m |
| Payment terms | 60–120d |
| CAC change | +20–30% |
Preview Before You Purchase
Waldencast SWOT Analysis
This is the actual Waldencast SWOT analysis document you’ll receive upon purchase—no surprises, just professional quality. The preview below is taken directly from the full SWOT report you'll get; purchase unlocks the complete, editable version. You’re viewing a live preview of the real file—buy now to access the entire, detailed report.
Description
Elevate Your Analysis with the Complete SWOT Report
Waldencast’s snapshot reveals strong audience engagement and creative IP potential, but also scaling challenges and market concentration risks. Our full SWOT analysis unpacks competitive positioning, revenue drivers, and mitigation strategies with research-backed detail. Purchase the complete report for an editable Word and Excel package to support strategic planning, pitches, and investment decisions.
Strengths
Multi-brand portfolio scale
Operating as a platform diversifies risk across categories and segments, reducing concentration exposure while enabling redeployment of capital to high-growth brands. Shared R&D, supply-chain and marketing platforms drive scale: industry studies (McKinsey/BCG) show shared-services can cut overhead 20–30%, lifting EBITDA margins. Broad portfolio enables faster test-and-learn cycles, reallocating spend to winners and supporting resilient growth through cycles.
Purpose-driven brand positioning
Purpose-driven positioning taps a market where 65% of consumers say values influence purchases, enabling Waldencast to justify 10–15% premium pricing versus purely functional peers and drive stronger loyalty metrics.
Retailers increasingly favor mission brands—raising category entry rates—and influencers show higher engagement rates when aligned with purpose.
Employer brand strength also improves: about 70% of jobseekers prioritize company purpose when choosing employers.
Americas and International footprint
Diversified Americas and international footprint reduces single-market dependence, leveraging the US market which comprises roughly 25% of global GDP to balance regional downturns. Localized go-to-market teams enable tailored assortments and pricing to regional tastes, improving conversion and retention. Cross-region performance helps hedge currency and macro cycles, while global reach supports faster scale-up of acquired brands across markets.
Acquisition and acceleration capabilities
A repeatable M&A playbook can unlock inorganic growth and improve deal outcomes in a market where roughly 70% of acquisitions historically underdeliver. Centralized brand, digital, and retail capabilities accelerate time-to-scale, often shortening roll-out by about 30% in roll-up models. Structured integration reduces execution risk and cost duplication, creating a pipeline to compound brand value.
- Tag: M&A playbook — increases deal success vs market baseline (~70% underperformance)
- Tag: Centralized capabilities — ~30% faster scale-up
- Tag: Integration — lowers execution risk and avoids duplicate costs
Omnichannel distribution know-how
Balanced DTC and wholesale improves reach and unit economics by combining direct-margin capture with partner-driven volume; DTC data then informs product, pricing, and media allocation to boost efficiency. Wholesale partners amplify awareness and trial at scale, while the blend raises lifetime value and helps manage CAC to industry LTV:CAC benchmarks around 3:1 (2024 guidance).
- 13.4% US e‑commerce share (2023)
- LTV:CAC ~3:1 benchmark (2024)
- DTC informs pricing/media
- Wholesale scales awareness/trial
Platform model cuts opex 20-30%, yields 10-15% price premium; LTV:CAC ~3:1
Platform model diversifies risk; shared services cut overhead 20–30% and lift EBITDA. Purpose drives 10–15% premium, 65% of consumers influenced by values and 70% of jobseekers prefer purpose. Balanced DTC/wholesale supports LTV:CAC ~3:1 and leverages 13.4% US e‑commerce share (2023).
| Metric | Value |
|---|---|
| Shared services | 20–30% Opex↓ |
| Price premium | 10–15% |
| LTV:CAC | ~3:1 (2024) |
What is included in the product
Detailed Word Document
Delivers a strategic overview of Waldencast’s internal and external business factors, outlining strengths, weaknesses, opportunities and threats to its competitive position, operational performance and growth prospects.
Customizable Excel Spreadsheet
Delivers a concise visual Waldencast SWOT matrix to pinpoint strategic pain points and align teams quickly; editable layout enables rapid updates as priorities shift, relieving analysis paralysis.
Weaknesses
Integration complexity
Bringing multiple brands onto a common platform strains systems and teams; Harvard Business Review reports about 70% of mergers fail to deliver expected synergies. Misaligned cultures or processes—cited by Deloitte in roughly 60% of cases—can delay synergies and elevate near-term operating costs. Integration missteps risk customer experience and brand equity, often increasing operating costs by double-digit percentages during transition.
Portfolio dependency on few winners
Platform models typically follow a Pareto pattern where roughly 20% of brands generate about 80% of revenue, so WaldenCast’s dependence on a few growth engines creates outsized exposure.
Underperformance of a lead brand can therefore disproportionately drag top-line and EBITDA; empirical platform cases show recovery often requires 12–18 months and substantial marketing and acquisition spend to replace a stalled hero.
Such concentration elevates revenue and EBITDA volatility, magnifying quarter-to-quarter swings and increasing downside risk for investors.
Working-capital intensity
Beauty's SKU breadth across shades, sizes and sets forces high inventory depth, and scaling internationally adds safety stock that can lengthen cash conversion cycles by weeks. Retailer payment terms often run 60–120 days, pressuring liquidity and raising working-capital needs. This reduces flexibility to fund marketing spend and opportunistic M&A, constraining growth options. Industry margins tighten as capital is tied up in inventory.
Brand dilution risk
Cross-brand playbooks at Waldencast may clash with individual brand DNA, reducing relevance; 2024 surveys show 65% of consumers cite authenticity as a key purchase driver, so over-standardization risks eroding engagement and loyalty.
Frequent portfolio shifts can confuse retailers and shoppers—retailers report a 22% rise in replenishment errors when SKUs change rapidly—while preserving distinct voices increases operating complexity and costs.
- Authenticity risk: 65% consumer preference
- Retail friction: +22% replenishment errors
- Higher Opex to maintain distinct voices
Exposure to marketing efficiency
Growth is highly sensitive to paid-media ROI and platform algorithm shifts; industry reports showed average app-install CAC rose ~20–30% after privacy updates through 2021–24, raising acquisition risk.
Rising CAC compresses gross margins and slows user acquisition velocity, making scale costlier for mid-stage SaaS and DTC brands.
Creative fatigue and targeting loss from privacy changes force continuous A/B testing and content refresh to sustain growth.
- Paid-media ROI dependence
- CAC up ~20–30% (2021–24 industry data)
- Algorithm risk & creative fatigue
- Requires constant testing & refresh
Roll-up risks: 70% synergy failures, CAC +20–30%
Integration risk: 70% of roll-ups miss synergies; 60% cite cultural/process misfit, often raising costs and harming CX. Revenue concentration follows 20/80, with lead-brand slumps needing 12–18 months and heavy spend to recover. Cash strain from 60–120 day pay terms and high SKU inventory lengthens cycles; CAC rose ~20–30% (2021–24), compressing margins.
| Metric | Value |
|---|---|
| M&A synergy failure | 70% |
| Cultural misfit | 60% |
| Revenue concentration | 20/80 |
| Recovery time | 12–18m |
| Payment terms | 60–120d |
| CAC change | +20–30% |
Preview Before You Purchase
Waldencast SWOT Analysis
This is the actual Waldencast SWOT analysis document you’ll receive upon purchase—no surprises, just professional quality. The preview below is taken directly from the full SWOT report you'll get; purchase unlocks the complete, editable version. You’re viewing a live preview of the real file—buy now to access the entire, detailed report.











