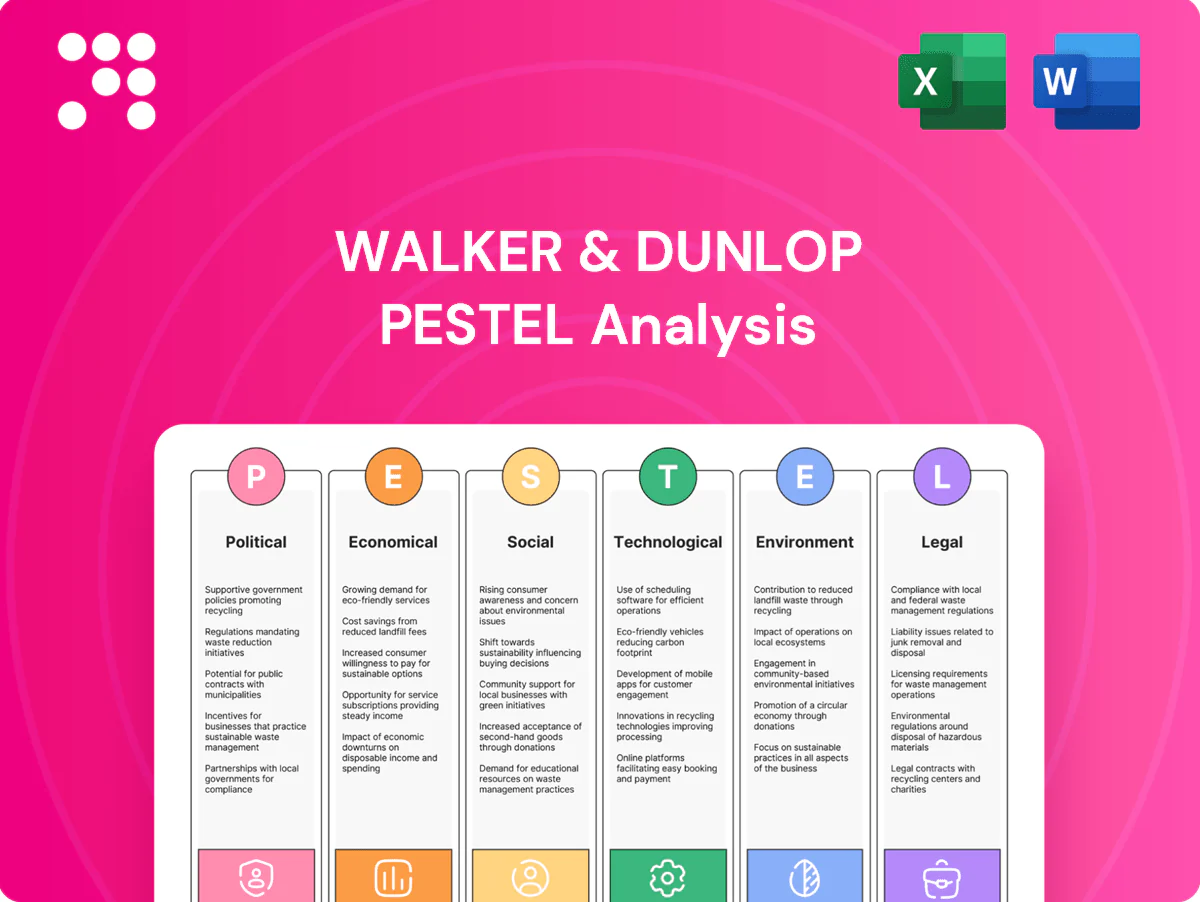
Walker & Dunlop PESTLE Analysis

Plan Smarter. Present Sharper. Compete Stronger.
Our PESTLE Analysis for Walker & Dunlop pinpoints the external forces—regulatory shifts, interest-rate cycles, tech disruption, and ESG trends—shaping its growth and risk profile, offering concise, actionable insights for investors and strategists. Purchase the full report to access detailed evidence, scenario impacts, and ready-to-use recommendations.
Political factors

Federal housing and GSE policy
Walker & Dunlop depends heavily on agency lending channels for multifamily debt; Fannie Mae and Freddie Mac had combined multifamily guarantees exceeding $1 trillion as of 2024, so shifts in caps, mission-driven requirements or privatization debates directly alter origination volume and pricing. Policy emphasis on affordability can expand eligible pipelines while tightening underwriting standards, and election cycles create uncertainty around program stability and allocations.
Monetary policy and central-bank stance
Federal Reserve policy sets short-term rates that directly shape commercial real estate borrowing costs and investor risk appetite, with tightening raising debt service and compressing asset valuations while easing can reignite originations. Forward guidance steers refinance waves and prepayment behavior by signaling future rate paths. Political scrutiny of inflation and housing affordability continuously influences the Fed’s policy trajectory and market expectations.

Urban development and infrastructure agendas
Federal infrastructure spending from the 2021 Bipartisan Infrastructure Law (1.2 trillion total, ~550 billion new) and local zoning reforms can spur multifamily and mixed‑use construction, raising Walker & Dunlop loan originations; transit‑oriented investments reallocate demand across submarkets, shifting pipeline mix toward dense nodes; local tax abatements (often 5–25 years) and incentives catalyze projects W&D finances; ongoing permitting reform efforts aim to cut review times, accelerating deal timelines.

Trade, geopolitics, and capital flows
Geopolitical tensions divert cross-border capital into or away from U.S. CRE; foreign investment into U.S. property fell to roughly $39B in 2023 (Real Capital Analytics), while early 2024 showed selective recovery into multifamily. Sanctions and outbound investment reviews (CFIUS activity up ~15% in 2023) constrain some investor pools; currency swings change returns for foreign buyers, and policy stability remains a key competitive edge for attracting global multifamily capital.
- Geopolitics: redirects capital flows
- Sanctions/CFIUS: limits investor pools (~+15% filings 2023)
- FX volatility: alters buyer returns
- Policy stability: attracts multifamily capital
State and municipal policies
Agency risk as Fannie/Freddie guarantees topped 1T in 2024; cross-border ~39B
Walker & Dunlop faces agency policy risk as Fannie/Freddie multifamily guarantees topped $1T in 2024, directly affecting origination volume and pricing. Fed rate moves shape CRE borrowing costs and refinance waves; 2024 tightening compressed valuations. Local rent control, eviction rules and ~1.1% average property tax (2024) alter underwriting and yields. Cross‑border flows fell to ~$39B in 2023, shifting capital sources.
| Factor | Impact | Key data |
|---|---|---|
| Agency policy | Origination/pricing | F/F guarantees >$1T (2024) |
| Fed policy | Rates/valuation | Tightening 2024 |
| Local policy | Cash flow/yields | Property tax ~1.1% (2024) |
| Global capital | Investor pools | Foreign investment ~$39B (2023) |
What is included in the product
 Detailed Word Document
Explores how macro-environmental factors — Political, Economic, Social, Technological, Environmental, and Legal — uniquely impact Walker & Dunlop, with data-driven trends, forward-looking insights and actionable examples tailored for executives, investors and strategists, ready for reports and decks.

 Customizable Excel Spreadsheet
A concise, visually segmented Walker & Dunlop PESTLE summary that’s easy to drop into presentations or planning sessions, supports quick alignment across teams, and allows contextual notes for regional or business-line nuances.
Economic factors

Interest rates and credit spreads
Rate levels and credit spreads set the economics of debt financing and refinancing; with the fed funds target at 5.25–5.50% and the 10-year Treasury ~4.3% (mid‑2025), base costs are elevated. Wider CRE spreads (roughly 150–250 bps over Treasuries in 2024–25) reduce proceeds and deal flow, while narrowing spreads can unlock pent‑up acquisition demand. Hedge costs (SOFR swaps near 4.5%) push some borrowers to prefer fixed pricing over floating.
CRE cycle and asset valuations
Cyclical pressure in office (vacancy ~18.5% in early 2025) and select retail contrasts with resilience in multifamily (rent growth ~4% YoY) and industrial (vacancy ~4.5%). Cap rate repricing — roughly +150 bps since 2021 — directly compresses loan sizing and DSCR, often reducing loan proceeds by ~20–30%. Rising distress (CMBS delinquencies higher) fuels advisory and bridge opportunities while damping core originations. Slower price discovery has cut transaction volumes materially (U.S. investment sales roughly halved from 2021 peaks).

Labor market and income trends
U.S. unemployment was 3.7% in December 2024 (BLS) and 2023 median household income was $74,580 (Census), supporting multifamily and hospitality demand; national multifamily occupancy hovered near 95% in 2024 (CBRE). Wage growth and incomes directly affect affordability and rent-growth assumptions, while city- and sector-level bifurcation requires granular underwriting; strong labor markets also aid construction absorption and refinancing.

Liquidity and capital markets depth
CMBS, life companies, debt funds and agencies compete across cycles; CMBS issuance (~$60bn in 2023) and life-company allocations drive nonagency supply while agencies gain share during stress.
Liquidity shocks compress volumes, shifted origination share toward government-backed channels; 2023–24 volatility raised secondary bid-ask spreads, weighing on pricing certainty.
Ample liquidity enables tailored structures and nonrecourse options; wider bid-ask spreads increase execution risk and require pricing cushions.
- CMBS ~60bn 2023
- Agencies gain share in stress
- Wider bid-ask = higher execution risk
- Liquidity = tailored, nonrecourse lending
Inflation and construction costs
Elevated inflation—U.S. CPI about 3.4% year‑over‑year in 2024—pushes Walker & Dunlop’s operating expenses and replacement costs higher, compressing underwriting margins. Volatility in construction input prices (ENR BCI rose roughly 4.8% in 2024) complicates development feasibility and tightens allowable loan‑to‑cost. Rent indexation and expense pass‑throughs and explicit stabilization timelines and contingency reserves become essential to preserve returns.
- Inflation pressure: CPI ~3.4% (2024)
- Construction cost rise: ENR BCI ~4.8% (2024)
- Mitigants: rent indexation, expense pass‑throughs
- Underwriting focus: stabilization timelines, larger contingencies
Agency risk as Fannie/Freddie guarantees topped 1T in 2024; cross-border ~39B
Elevated rates (fed funds 5.25–5.50%, 10y ~4.3%) and wider CRE spreads (150–250 bps) raise debt costs and compress loan proceeds; SOFR swaps ~4.5% increase hedge costs. Sector bifurcation: office vacancy ~18.5% vs multifamily rent growth ~4% and industrial vacancy ~4.5%. Inflation (CPI ~3.4% in 2024) and ENR BCI +4.8% lift operating and construction costs, tightening underwriting.
| Metric | Value |
|---|---|
| Fed funds | 5.25–5.50% |
| 10y Treasury | ~4.3% |
| CRE spreads | 150–250 bps |
| SOFR swaps | ~4.5% |
| Office vacancy | ~18.5% |
| Multifamily rent growth | ~4% YoY |
| CPI (2024) | ~3.4% |
| ENR BCI (2024) | ~4.8% |
Preview the Actual Deliverable
Walker & Dunlop PESTLE Analysis
The Walker & Dunlop PESTLE Analysis preview shown here is the exact, fully formatted document you’ll receive after purchase—professionally structured and ready to use. The content, layout, and headings match the final downloadable file with no placeholders or surprises. Purchase grants instant access to this precise report.

Plan Smarter. Present Sharper. Compete Stronger.
Our PESTLE Analysis for Walker & Dunlop pinpoints the external forces—regulatory shifts, interest-rate cycles, tech disruption, and ESG trends—shaping its growth and risk profile, offering concise, actionable insights for investors and strategists. Purchase the full report to access detailed evidence, scenario impacts, and ready-to-use recommendations.
Political factors
Federal housing and GSE policy
Walker & Dunlop depends heavily on agency lending channels for multifamily debt; Fannie Mae and Freddie Mac had combined multifamily guarantees exceeding $1 trillion as of 2024, so shifts in caps, mission-driven requirements or privatization debates directly alter origination volume and pricing. Policy emphasis on affordability can expand eligible pipelines while tightening underwriting standards, and election cycles create uncertainty around program stability and allocations.
Monetary policy and central-bank stance
Federal Reserve policy sets short-term rates that directly shape commercial real estate borrowing costs and investor risk appetite, with tightening raising debt service and compressing asset valuations while easing can reignite originations. Forward guidance steers refinance waves and prepayment behavior by signaling future rate paths. Political scrutiny of inflation and housing affordability continuously influences the Fed’s policy trajectory and market expectations.
Urban development and infrastructure agendas
Federal infrastructure spending from the 2021 Bipartisan Infrastructure Law (1.2 trillion total, ~550 billion new) and local zoning reforms can spur multifamily and mixed‑use construction, raising Walker & Dunlop loan originations; transit‑oriented investments reallocate demand across submarkets, shifting pipeline mix toward dense nodes; local tax abatements (often 5–25 years) and incentives catalyze projects W&D finances; ongoing permitting reform efforts aim to cut review times, accelerating deal timelines.
Trade, geopolitics, and capital flows
Geopolitical tensions divert cross-border capital into or away from U.S. CRE; foreign investment into U.S. property fell to roughly $39B in 2023 (Real Capital Analytics), while early 2024 showed selective recovery into multifamily. Sanctions and outbound investment reviews (CFIUS activity up ~15% in 2023) constrain some investor pools; currency swings change returns for foreign buyers, and policy stability remains a key competitive edge for attracting global multifamily capital.
- Geopolitics: redirects capital flows
- Sanctions/CFIUS: limits investor pools (~+15% filings 2023)
- FX volatility: alters buyer returns
- Policy stability: attracts multifamily capital
State and municipal policies
Agency risk as Fannie/Freddie guarantees topped 1T in 2024; cross-border ~39B
Walker & Dunlop faces agency policy risk as Fannie/Freddie multifamily guarantees topped $1T in 2024, directly affecting origination volume and pricing. Fed rate moves shape CRE borrowing costs and refinance waves; 2024 tightening compressed valuations. Local rent control, eviction rules and ~1.1% average property tax (2024) alter underwriting and yields. Cross‑border flows fell to ~$39B in 2023, shifting capital sources.
| Factor | Impact | Key data |
|---|---|---|
| Agency policy | Origination/pricing | F/F guarantees >$1T (2024) |
| Fed policy | Rates/valuation | Tightening 2024 |
| Local policy | Cash flow/yields | Property tax ~1.1% (2024) |
| Global capital | Investor pools | Foreign investment ~$39B (2023) |
What is included in the product
Detailed Word Document
Explores how macro-environmental factors — Political, Economic, Social, Technological, Environmental, and Legal — uniquely impact Walker & Dunlop, with data-driven trends, forward-looking insights and actionable examples tailored for executives, investors and strategists, ready for reports and decks.
Customizable Excel Spreadsheet
A concise, visually segmented Walker & Dunlop PESTLE summary that’s easy to drop into presentations or planning sessions, supports quick alignment across teams, and allows contextual notes for regional or business-line nuances.
Economic factors
Interest rates and credit spreads
Rate levels and credit spreads set the economics of debt financing and refinancing; with the fed funds target at 5.25–5.50% and the 10-year Treasury ~4.3% (mid‑2025), base costs are elevated. Wider CRE spreads (roughly 150–250 bps over Treasuries in 2024–25) reduce proceeds and deal flow, while narrowing spreads can unlock pent‑up acquisition demand. Hedge costs (SOFR swaps near 4.5%) push some borrowers to prefer fixed pricing over floating.
CRE cycle and asset valuations
Cyclical pressure in office (vacancy ~18.5% in early 2025) and select retail contrasts with resilience in multifamily (rent growth ~4% YoY) and industrial (vacancy ~4.5%). Cap rate repricing — roughly +150 bps since 2021 — directly compresses loan sizing and DSCR, often reducing loan proceeds by ~20–30%. Rising distress (CMBS delinquencies higher) fuels advisory and bridge opportunities while damping core originations. Slower price discovery has cut transaction volumes materially (U.S. investment sales roughly halved from 2021 peaks).
Labor market and income trends
U.S. unemployment was 3.7% in December 2024 (BLS) and 2023 median household income was $74,580 (Census), supporting multifamily and hospitality demand; national multifamily occupancy hovered near 95% in 2024 (CBRE). Wage growth and incomes directly affect affordability and rent-growth assumptions, while city- and sector-level bifurcation requires granular underwriting; strong labor markets also aid construction absorption and refinancing.
Liquidity and capital markets depth
CMBS, life companies, debt funds and agencies compete across cycles; CMBS issuance (~$60bn in 2023) and life-company allocations drive nonagency supply while agencies gain share during stress.
Liquidity shocks compress volumes, shifted origination share toward government-backed channels; 2023–24 volatility raised secondary bid-ask spreads, weighing on pricing certainty.
Ample liquidity enables tailored structures and nonrecourse options; wider bid-ask spreads increase execution risk and require pricing cushions.
- CMBS ~60bn 2023
- Agencies gain share in stress
- Wider bid-ask = higher execution risk
- Liquidity = tailored, nonrecourse lending
Inflation and construction costs
Elevated inflation—U.S. CPI about 3.4% year‑over‑year in 2024—pushes Walker & Dunlop’s operating expenses and replacement costs higher, compressing underwriting margins. Volatility in construction input prices (ENR BCI rose roughly 4.8% in 2024) complicates development feasibility and tightens allowable loan‑to‑cost. Rent indexation and expense pass‑throughs and explicit stabilization timelines and contingency reserves become essential to preserve returns.
- Inflation pressure: CPI ~3.4% (2024)
- Construction cost rise: ENR BCI ~4.8% (2024)
- Mitigants: rent indexation, expense pass‑throughs
- Underwriting focus: stabilization timelines, larger contingencies
Agency risk as Fannie/Freddie guarantees topped 1T in 2024; cross-border ~39B
Elevated rates (fed funds 5.25–5.50%, 10y ~4.3%) and wider CRE spreads (150–250 bps) raise debt costs and compress loan proceeds; SOFR swaps ~4.5% increase hedge costs. Sector bifurcation: office vacancy ~18.5% vs multifamily rent growth ~4% and industrial vacancy ~4.5%. Inflation (CPI ~3.4% in 2024) and ENR BCI +4.8% lift operating and construction costs, tightening underwriting.
| Metric | Value |
|---|---|
| Fed funds | 5.25–5.50% |
| 10y Treasury | ~4.3% |
| CRE spreads | 150–250 bps |
| SOFR swaps | ~4.5% |
| Office vacancy | ~18.5% |
| Multifamily rent growth | ~4% YoY |
| CPI (2024) | ~3.4% |
| ENR BCI (2024) | ~4.8% |
Preview the Actual Deliverable
Walker & Dunlop PESTLE Analysis
The Walker & Dunlop PESTLE Analysis preview shown here is the exact, fully formatted document you’ll receive after purchase—professionally structured and ready to use. The content, layout, and headings match the final downloadable file with no placeholders or surprises. Purchase grants instant access to this precise report.
Original: $10.00
-65%$10.00
$3.50Description
Plan Smarter. Present Sharper. Compete Stronger.
Our PESTLE Analysis for Walker & Dunlop pinpoints the external forces—regulatory shifts, interest-rate cycles, tech disruption, and ESG trends—shaping its growth and risk profile, offering concise, actionable insights for investors and strategists. Purchase the full report to access detailed evidence, scenario impacts, and ready-to-use recommendations.
Political factors
Federal housing and GSE policy
Walker & Dunlop depends heavily on agency lending channels for multifamily debt; Fannie Mae and Freddie Mac had combined multifamily guarantees exceeding $1 trillion as of 2024, so shifts in caps, mission-driven requirements or privatization debates directly alter origination volume and pricing. Policy emphasis on affordability can expand eligible pipelines while tightening underwriting standards, and election cycles create uncertainty around program stability and allocations.
Monetary policy and central-bank stance
Federal Reserve policy sets short-term rates that directly shape commercial real estate borrowing costs and investor risk appetite, with tightening raising debt service and compressing asset valuations while easing can reignite originations. Forward guidance steers refinance waves and prepayment behavior by signaling future rate paths. Political scrutiny of inflation and housing affordability continuously influences the Fed’s policy trajectory and market expectations.
Urban development and infrastructure agendas
Federal infrastructure spending from the 2021 Bipartisan Infrastructure Law (1.2 trillion total, ~550 billion new) and local zoning reforms can spur multifamily and mixed‑use construction, raising Walker & Dunlop loan originations; transit‑oriented investments reallocate demand across submarkets, shifting pipeline mix toward dense nodes; local tax abatements (often 5–25 years) and incentives catalyze projects W&D finances; ongoing permitting reform efforts aim to cut review times, accelerating deal timelines.
Trade, geopolitics, and capital flows
Geopolitical tensions divert cross-border capital into or away from U.S. CRE; foreign investment into U.S. property fell to roughly $39B in 2023 (Real Capital Analytics), while early 2024 showed selective recovery into multifamily. Sanctions and outbound investment reviews (CFIUS activity up ~15% in 2023) constrain some investor pools; currency swings change returns for foreign buyers, and policy stability remains a key competitive edge for attracting global multifamily capital.
- Geopolitics: redirects capital flows
- Sanctions/CFIUS: limits investor pools (~+15% filings 2023)
- FX volatility: alters buyer returns
- Policy stability: attracts multifamily capital
State and municipal policies
Agency risk as Fannie/Freddie guarantees topped 1T in 2024; cross-border ~39B
Walker & Dunlop faces agency policy risk as Fannie/Freddie multifamily guarantees topped $1T in 2024, directly affecting origination volume and pricing. Fed rate moves shape CRE borrowing costs and refinance waves; 2024 tightening compressed valuations. Local rent control, eviction rules and ~1.1% average property tax (2024) alter underwriting and yields. Cross‑border flows fell to ~$39B in 2023, shifting capital sources.
| Factor | Impact | Key data |
|---|---|---|
| Agency policy | Origination/pricing | F/F guarantees >$1T (2024) |
| Fed policy | Rates/valuation | Tightening 2024 |
| Local policy | Cash flow/yields | Property tax ~1.1% (2024) |
| Global capital | Investor pools | Foreign investment ~$39B (2023) |
What is included in the product
Detailed Word Document
Explores how macro-environmental factors — Political, Economic, Social, Technological, Environmental, and Legal — uniquely impact Walker & Dunlop, with data-driven trends, forward-looking insights and actionable examples tailored for executives, investors and strategists, ready for reports and decks.
Customizable Excel Spreadsheet
A concise, visually segmented Walker & Dunlop PESTLE summary that’s easy to drop into presentations or planning sessions, supports quick alignment across teams, and allows contextual notes for regional or business-line nuances.
Economic factors
Interest rates and credit spreads
Rate levels and credit spreads set the economics of debt financing and refinancing; with the fed funds target at 5.25–5.50% and the 10-year Treasury ~4.3% (mid‑2025), base costs are elevated. Wider CRE spreads (roughly 150–250 bps over Treasuries in 2024–25) reduce proceeds and deal flow, while narrowing spreads can unlock pent‑up acquisition demand. Hedge costs (SOFR swaps near 4.5%) push some borrowers to prefer fixed pricing over floating.
CRE cycle and asset valuations
Cyclical pressure in office (vacancy ~18.5% in early 2025) and select retail contrasts with resilience in multifamily (rent growth ~4% YoY) and industrial (vacancy ~4.5%). Cap rate repricing — roughly +150 bps since 2021 — directly compresses loan sizing and DSCR, often reducing loan proceeds by ~20–30%. Rising distress (CMBS delinquencies higher) fuels advisory and bridge opportunities while damping core originations. Slower price discovery has cut transaction volumes materially (U.S. investment sales roughly halved from 2021 peaks).
Labor market and income trends
U.S. unemployment was 3.7% in December 2024 (BLS) and 2023 median household income was $74,580 (Census), supporting multifamily and hospitality demand; national multifamily occupancy hovered near 95% in 2024 (CBRE). Wage growth and incomes directly affect affordability and rent-growth assumptions, while city- and sector-level bifurcation requires granular underwriting; strong labor markets also aid construction absorption and refinancing.
Liquidity and capital markets depth
CMBS, life companies, debt funds and agencies compete across cycles; CMBS issuance (~$60bn in 2023) and life-company allocations drive nonagency supply while agencies gain share during stress.
Liquidity shocks compress volumes, shifted origination share toward government-backed channels; 2023–24 volatility raised secondary bid-ask spreads, weighing on pricing certainty.
Ample liquidity enables tailored structures and nonrecourse options; wider bid-ask spreads increase execution risk and require pricing cushions.
- CMBS ~60bn 2023
- Agencies gain share in stress
- Wider bid-ask = higher execution risk
- Liquidity = tailored, nonrecourse lending
Inflation and construction costs
Elevated inflation—U.S. CPI about 3.4% year‑over‑year in 2024—pushes Walker & Dunlop’s operating expenses and replacement costs higher, compressing underwriting margins. Volatility in construction input prices (ENR BCI rose roughly 4.8% in 2024) complicates development feasibility and tightens allowable loan‑to‑cost. Rent indexation and expense pass‑throughs and explicit stabilization timelines and contingency reserves become essential to preserve returns.
- Inflation pressure: CPI ~3.4% (2024)
- Construction cost rise: ENR BCI ~4.8% (2024)
- Mitigants: rent indexation, expense pass‑throughs
- Underwriting focus: stabilization timelines, larger contingencies
Agency risk as Fannie/Freddie guarantees topped 1T in 2024; cross-border ~39B
Elevated rates (fed funds 5.25–5.50%, 10y ~4.3%) and wider CRE spreads (150–250 bps) raise debt costs and compress loan proceeds; SOFR swaps ~4.5% increase hedge costs. Sector bifurcation: office vacancy ~18.5% vs multifamily rent growth ~4% and industrial vacancy ~4.5%. Inflation (CPI ~3.4% in 2024) and ENR BCI +4.8% lift operating and construction costs, tightening underwriting.
| Metric | Value |
|---|---|
| Fed funds | 5.25–5.50% |
| 10y Treasury | ~4.3% |
| CRE spreads | 150–250 bps |
| SOFR swaps | ~4.5% |
| Office vacancy | ~18.5% |
| Multifamily rent growth | ~4% YoY |
| CPI (2024) | ~3.4% |
| ENR BCI (2024) | ~4.8% |
Preview the Actual Deliverable
Walker & Dunlop PESTLE Analysis
The Walker & Dunlop PESTLE Analysis preview shown here is the exact, fully formatted document you’ll receive after purchase—professionally structured and ready to use. The content, layout, and headings match the final downloadable file with no placeholders or surprises. Purchase grants instant access to this precise report.











