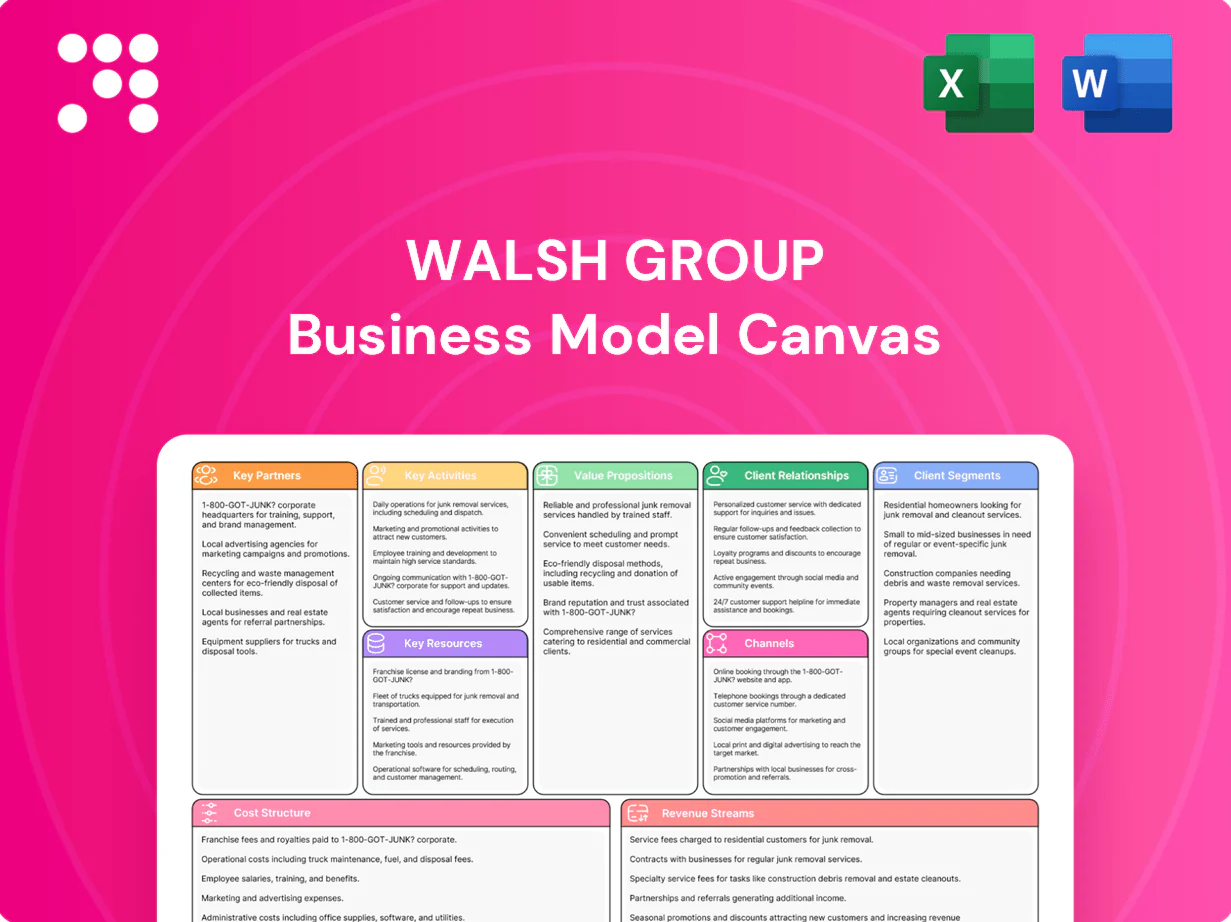
Walsh Group Business Model Canvas

Strategic Business Model Canvas: Actionable Blueprint for Investors and Operators
Unlock the full strategic blueprint behind Walsh Group's Business Model Canvas. This concise, actionable analysis reveals value propositions, key partners, revenue streams and cost drivers. Ideal for investors, consultants and founders seeking a competitive edge. Download the editable Word/Excel canvas to benchmark and implement proven strategies.
Partnerships

Public owners and agencies
Partnerships with federal, state, and local transportation, water, and building agencies anchor Walsh Group’s pipeline, driven by multi-year funding under the Bipartisan Infrastructure Law (1.2 trillion total, including 550 billion in new investment). These relationships align project delivery to funding cycles and public procurement rules. Early engagement with owners helps shape scopes, risk allocation, and delivery models. Long-term trust measurably improves bid competitiveness and award likelihood.
Design and engineering firms
Alliances with architects and engineering consultants enable Walsh Group to deliver integrated design-build solutions, leveraging collaborative scopes that captured roughly 44% of U.S. nonresidential project starts in 2024. Co-development with design partners streamlines constructability reviews and value engineering, cutting iteration time and cost overruns on benchmark projects by double digits. Shared digital models (BIM) reduce rework and RFIs, while joint pursuit teams lift win rates on complex bids, often exceeding firm-average capture rates.

Subcontractors and suppliers
Regional trade partners and material vendors provide capacity and specialization, with subcontracting typically representing about 60% of construction project costs. Preferred networks stabilize pricing and schedules, historically reducing price variance and schedule slips by roughly 10% in industry studies (2023–24). Coordinated supply chain management mitigates lead-time and logistics risk, cutting procurement delays by mid-teens percentages. Performance histories drive award decisions and risk allocation through scorecards and multi-year vendor evaluations.

Technology and data partners
Technology and data partners—BIM/VDC, project management and field productivity platforms—are essential for Walsh Group; by 2024 over 60% of US contractors reported BIM/VDC use and platforms deliver 25–40% productivity gains. Integrated systems support scheduling, quality, safety and cost controls, while analytics cut forecast variance and claims exposure by up to 30%; hardware partners enable drone, LiDAR and IoT site visibility 24/7.
- BIM/VDC
- Project management
- Field productivity
- Integrations: schedule/quality/safety/cost
- Analytics: forecasting/claims
- Hardware: drone/LiDAR/IoT
Financiers and P3/JV consortia
Equity providers, lenders, sureties, and JV partners expand Walsh Group balance-sheet capacity and technical reach, enabling bids on larger projects; Bipartisan Infrastructure Law programs represent roughly 550 billion USD in new federal investment (2021 framework) that fuels demand for capacity. P3 consortia enable risk sharing and lifecycle delivery, while sureties commonly back up to 100% of contract value to support bonding for megaprojects; structured partnerships unlock megaproject eligibility and long-term concessions.
- Equity: expands capital and credit headroom
- Lenders: provide leverage for large bids
- Sureties: back up to 100% contract value
- P3/JV: risk share, lifecycle delivery, megaproject access
Public-agency partnerships capture $550B BIL funding, boost BIM adoption and 25-40% productivity
Walsh’s public-agency partnerships leverage Bipartisan Infrastructure Law funding (1.2 trillion total; 550 billion new) to secure multi-year work. Design and trade alliances captured ~44% of U.S. nonresidential starts (2024) and subcontracting ~60% of costs, stabilizing delivery. Tech partners drive BIM/VDC adoption >60% (2024) with 25–40% productivity gains; sureties/JVs enable megaproject bonding (up to 100%).
| Partnership | Role | 2024 Metric |
|---|---|---|
| Public owners | Pipeline/funding | $550B new federal investment |
| Design/trade | Design-build capacity | 44% starts; 60% subcontracting |
| Tech | Productivity/visibility | >60% BIM use; 25–40% gains |
| Finance/surety | Bonding/capacity | Surety backing up to 100% |
What is included in the product
 Detailed Word Document
A comprehensive Business Model Canvas for Walsh Group detailing customer segments, value propositions, channels, revenue streams, key resources, activities, partners, cost structure and customer relationships across nine BMC blocks. Includes competitive advantages, SWOT-linked insights and polished narrative ideal for presentations, funding and strategic decision-making.

 Customizable Excel Spreadsheet
Condenses Walsh Group’s complex construction and infrastructure strategy into a clean, editable one-page canvas that saves hours of structuring while enabling quick comparison and collaborative adaptation across teams.
Activities

Design-build integration
Coordinating architects, engineers and construction teams through Walshs design-build integration compresses schedules and enables delivery aligned with 2024 industry trends. Early design input optimizes means and methods, improving constructability and reducing lifecycle cost. Model-based reviews, which in 2024 studies cut rework up to 40%, enhance accuracy. The process lowers change orders and total project risk.
Construction management
Construction management at Walsh governs execution through tight planning, scheduling, and cost control to limit overruns; in the US construction sector, 2024 total construction spending approached $1.9 trillion and managers target sub-5% budget variance. Procurement and logistics synchronize trades and materials across projects, supporting nationwide operations and an industry workforce of roughly 7.5 million in 2024. On-site supervision enforces safety and quality while stakeholder coordination preserves access and regulatory compliance.

Heavy civil and building delivery
Self-perform and managed scopes cover transportation, water and vertical projects, leveraging Walsh Group expertise to execute IIJA-backed work streams from the $1.2 trillion Infrastructure Investment and Jobs Act into 2024. Complex staging sustains continuous operations around live sites and utilities. Specialized equipment and fleet optimization accelerate production rates and reduce schedule risk. Rigorous inspection and commissioning protocols complete safe turnover to owners.

Preconstruction and estimating
Detailed takeoffs and market-informed pricing set firm baselines for Walsh Group preconstruction, using 2024 material cost indices and bid data to reduce pricing variance. Value engineering and alternative delivery options shape competitive, cost-effective proposals. Risk registers quantify exposures and set contingency levels; phasing and constructability reviews de-risk execution and lower change orders.
- Detailed takeoffs
- Market-informed pricing (2024 indices)
- Value engineering
- Risk registers & contingencies
- Phasing & constructability reviews
Safety, quality, and compliance
Programs enforce a zero-harm culture and regulatory adherence through mandatory training, incident reporting, and corrective actions, supporting Walsh Group’s long-term compliance and safety targets.
QA/QC procedures validate specifications via inspection regimes and control plans linked to project KPIs; environmental and community plans mitigate impacts through monitoring and stakeholder engagement; robust documentation supports audits and claims defense.
Integrated design-build cuts rework 40% and targets sub-5% variance in $1.9T US market
Walsh integrates design-build to cut schedules and rework (2024 studies: rework down 40%), manages construction to target sub-5% budget variance amid $1.9T US construction spend (2024), self-performs IIJA $1.2T scopes, and enforces zero-harm safety across a 7.5M workforce (2024).
| Metric | 2024 Value |
|---|---|
| US construction spend | $1.9T |
| Rework reduction | 40% |
| Target budget variance | <5% |
| Workforce | 7.5M |
| IIJA funding | $1.2T |
Full Version Awaits
Business Model Canvas
The Walsh Group Business Model Canvas you’re previewing is the actual deliverable, not a mockup. When you purchase, you’ll receive this exact document—fully formatted and complete—in editable Word and Excel files. No placeholders, no surprises, ready to present or customize immediately.

Strategic Business Model Canvas: Actionable Blueprint for Investors and Operators
Unlock the full strategic blueprint behind Walsh Group's Business Model Canvas. This concise, actionable analysis reveals value propositions, key partners, revenue streams and cost drivers. Ideal for investors, consultants and founders seeking a competitive edge. Download the editable Word/Excel canvas to benchmark and implement proven strategies.
Partnerships
Public owners and agencies
Partnerships with federal, state, and local transportation, water, and building agencies anchor Walsh Group’s pipeline, driven by multi-year funding under the Bipartisan Infrastructure Law (1.2 trillion total, including 550 billion in new investment). These relationships align project delivery to funding cycles and public procurement rules. Early engagement with owners helps shape scopes, risk allocation, and delivery models. Long-term trust measurably improves bid competitiveness and award likelihood.
Design and engineering firms
Alliances with architects and engineering consultants enable Walsh Group to deliver integrated design-build solutions, leveraging collaborative scopes that captured roughly 44% of U.S. nonresidential project starts in 2024. Co-development with design partners streamlines constructability reviews and value engineering, cutting iteration time and cost overruns on benchmark projects by double digits. Shared digital models (BIM) reduce rework and RFIs, while joint pursuit teams lift win rates on complex bids, often exceeding firm-average capture rates.
Subcontractors and suppliers
Regional trade partners and material vendors provide capacity and specialization, with subcontracting typically representing about 60% of construction project costs. Preferred networks stabilize pricing and schedules, historically reducing price variance and schedule slips by roughly 10% in industry studies (2023–24). Coordinated supply chain management mitigates lead-time and logistics risk, cutting procurement delays by mid-teens percentages. Performance histories drive award decisions and risk allocation through scorecards and multi-year vendor evaluations.
Technology and data partners
Technology and data partners—BIM/VDC, project management and field productivity platforms—are essential for Walsh Group; by 2024 over 60% of US contractors reported BIM/VDC use and platforms deliver 25–40% productivity gains. Integrated systems support scheduling, quality, safety and cost controls, while analytics cut forecast variance and claims exposure by up to 30%; hardware partners enable drone, LiDAR and IoT site visibility 24/7.
- BIM/VDC
- Project management
- Field productivity
- Integrations: schedule/quality/safety/cost
- Analytics: forecasting/claims
- Hardware: drone/LiDAR/IoT
Financiers and P3/JV consortia
Equity providers, lenders, sureties, and JV partners expand Walsh Group balance-sheet capacity and technical reach, enabling bids on larger projects; Bipartisan Infrastructure Law programs represent roughly 550 billion USD in new federal investment (2021 framework) that fuels demand for capacity. P3 consortia enable risk sharing and lifecycle delivery, while sureties commonly back up to 100% of contract value to support bonding for megaprojects; structured partnerships unlock megaproject eligibility and long-term concessions.
- Equity: expands capital and credit headroom
- Lenders: provide leverage for large bids
- Sureties: back up to 100% contract value
- P3/JV: risk share, lifecycle delivery, megaproject access
Public-agency partnerships capture $550B BIL funding, boost BIM adoption and 25-40% productivity
Walsh’s public-agency partnerships leverage Bipartisan Infrastructure Law funding (1.2 trillion total; 550 billion new) to secure multi-year work. Design and trade alliances captured ~44% of U.S. nonresidential starts (2024) and subcontracting ~60% of costs, stabilizing delivery. Tech partners drive BIM/VDC adoption >60% (2024) with 25–40% productivity gains; sureties/JVs enable megaproject bonding (up to 100%).
| Partnership | Role | 2024 Metric |
|---|---|---|
| Public owners | Pipeline/funding | $550B new federal investment |
| Design/trade | Design-build capacity | 44% starts; 60% subcontracting |
| Tech | Productivity/visibility | >60% BIM use; 25–40% gains |
| Finance/surety | Bonding/capacity | Surety backing up to 100% |
What is included in the product
Detailed Word Document
A comprehensive Business Model Canvas for Walsh Group detailing customer segments, value propositions, channels, revenue streams, key resources, activities, partners, cost structure and customer relationships across nine BMC blocks. Includes competitive advantages, SWOT-linked insights and polished narrative ideal for presentations, funding and strategic decision-making.
Customizable Excel Spreadsheet
Condenses Walsh Group’s complex construction and infrastructure strategy into a clean, editable one-page canvas that saves hours of structuring while enabling quick comparison and collaborative adaptation across teams.
Activities
Design-build integration
Coordinating architects, engineers and construction teams through Walshs design-build integration compresses schedules and enables delivery aligned with 2024 industry trends. Early design input optimizes means and methods, improving constructability and reducing lifecycle cost. Model-based reviews, which in 2024 studies cut rework up to 40%, enhance accuracy. The process lowers change orders and total project risk.
Construction management
Construction management at Walsh governs execution through tight planning, scheduling, and cost control to limit overruns; in the US construction sector, 2024 total construction spending approached $1.9 trillion and managers target sub-5% budget variance. Procurement and logistics synchronize trades and materials across projects, supporting nationwide operations and an industry workforce of roughly 7.5 million in 2024. On-site supervision enforces safety and quality while stakeholder coordination preserves access and regulatory compliance.
Heavy civil and building delivery
Self-perform and managed scopes cover transportation, water and vertical projects, leveraging Walsh Group expertise to execute IIJA-backed work streams from the $1.2 trillion Infrastructure Investment and Jobs Act into 2024. Complex staging sustains continuous operations around live sites and utilities. Specialized equipment and fleet optimization accelerate production rates and reduce schedule risk. Rigorous inspection and commissioning protocols complete safe turnover to owners.
Preconstruction and estimating
Detailed takeoffs and market-informed pricing set firm baselines for Walsh Group preconstruction, using 2024 material cost indices and bid data to reduce pricing variance. Value engineering and alternative delivery options shape competitive, cost-effective proposals. Risk registers quantify exposures and set contingency levels; phasing and constructability reviews de-risk execution and lower change orders.
- Detailed takeoffs
- Market-informed pricing (2024 indices)
- Value engineering
- Risk registers & contingencies
- Phasing & constructability reviews
Safety, quality, and compliance
Programs enforce a zero-harm culture and regulatory adherence through mandatory training, incident reporting, and corrective actions, supporting Walsh Group’s long-term compliance and safety targets.
QA/QC procedures validate specifications via inspection regimes and control plans linked to project KPIs; environmental and community plans mitigate impacts through monitoring and stakeholder engagement; robust documentation supports audits and claims defense.
Integrated design-build cuts rework 40% and targets sub-5% variance in $1.9T US market
Walsh integrates design-build to cut schedules and rework (2024 studies: rework down 40%), manages construction to target sub-5% budget variance amid $1.9T US construction spend (2024), self-performs IIJA $1.2T scopes, and enforces zero-harm safety across a 7.5M workforce (2024).
| Metric | 2024 Value |
|---|---|
| US construction spend | $1.9T |
| Rework reduction | 40% |
| Target budget variance | <5% |
| Workforce | 7.5M |
| IIJA funding | $1.2T |
Full Version Awaits
Business Model Canvas
The Walsh Group Business Model Canvas you’re previewing is the actual deliverable, not a mockup. When you purchase, you’ll receive this exact document—fully formatted and complete—in editable Word and Excel files. No placeholders, no surprises, ready to present or customize immediately.
Description
Strategic Business Model Canvas: Actionable Blueprint for Investors and Operators
Unlock the full strategic blueprint behind Walsh Group's Business Model Canvas. This concise, actionable analysis reveals value propositions, key partners, revenue streams and cost drivers. Ideal for investors, consultants and founders seeking a competitive edge. Download the editable Word/Excel canvas to benchmark and implement proven strategies.
Partnerships
Public owners and agencies
Partnerships with federal, state, and local transportation, water, and building agencies anchor Walsh Group’s pipeline, driven by multi-year funding under the Bipartisan Infrastructure Law (1.2 trillion total, including 550 billion in new investment). These relationships align project delivery to funding cycles and public procurement rules. Early engagement with owners helps shape scopes, risk allocation, and delivery models. Long-term trust measurably improves bid competitiveness and award likelihood.
Design and engineering firms
Alliances with architects and engineering consultants enable Walsh Group to deliver integrated design-build solutions, leveraging collaborative scopes that captured roughly 44% of U.S. nonresidential project starts in 2024. Co-development with design partners streamlines constructability reviews and value engineering, cutting iteration time and cost overruns on benchmark projects by double digits. Shared digital models (BIM) reduce rework and RFIs, while joint pursuit teams lift win rates on complex bids, often exceeding firm-average capture rates.
Subcontractors and suppliers
Regional trade partners and material vendors provide capacity and specialization, with subcontracting typically representing about 60% of construction project costs. Preferred networks stabilize pricing and schedules, historically reducing price variance and schedule slips by roughly 10% in industry studies (2023–24). Coordinated supply chain management mitigates lead-time and logistics risk, cutting procurement delays by mid-teens percentages. Performance histories drive award decisions and risk allocation through scorecards and multi-year vendor evaluations.
Technology and data partners
Technology and data partners—BIM/VDC, project management and field productivity platforms—are essential for Walsh Group; by 2024 over 60% of US contractors reported BIM/VDC use and platforms deliver 25–40% productivity gains. Integrated systems support scheduling, quality, safety and cost controls, while analytics cut forecast variance and claims exposure by up to 30%; hardware partners enable drone, LiDAR and IoT site visibility 24/7.
- BIM/VDC
- Project management
- Field productivity
- Integrations: schedule/quality/safety/cost
- Analytics: forecasting/claims
- Hardware: drone/LiDAR/IoT
Financiers and P3/JV consortia
Equity providers, lenders, sureties, and JV partners expand Walsh Group balance-sheet capacity and technical reach, enabling bids on larger projects; Bipartisan Infrastructure Law programs represent roughly 550 billion USD in new federal investment (2021 framework) that fuels demand for capacity. P3 consortia enable risk sharing and lifecycle delivery, while sureties commonly back up to 100% of contract value to support bonding for megaprojects; structured partnerships unlock megaproject eligibility and long-term concessions.
- Equity: expands capital and credit headroom
- Lenders: provide leverage for large bids
- Sureties: back up to 100% contract value
- P3/JV: risk share, lifecycle delivery, megaproject access
Public-agency partnerships capture $550B BIL funding, boost BIM adoption and 25-40% productivity
Walsh’s public-agency partnerships leverage Bipartisan Infrastructure Law funding (1.2 trillion total; 550 billion new) to secure multi-year work. Design and trade alliances captured ~44% of U.S. nonresidential starts (2024) and subcontracting ~60% of costs, stabilizing delivery. Tech partners drive BIM/VDC adoption >60% (2024) with 25–40% productivity gains; sureties/JVs enable megaproject bonding (up to 100%).
| Partnership | Role | 2024 Metric |
|---|---|---|
| Public owners | Pipeline/funding | $550B new federal investment |
| Design/trade | Design-build capacity | 44% starts; 60% subcontracting |
| Tech | Productivity/visibility | >60% BIM use; 25–40% gains |
| Finance/surety | Bonding/capacity | Surety backing up to 100% |
What is included in the product
Detailed Word Document
A comprehensive Business Model Canvas for Walsh Group detailing customer segments, value propositions, channels, revenue streams, key resources, activities, partners, cost structure and customer relationships across nine BMC blocks. Includes competitive advantages, SWOT-linked insights and polished narrative ideal for presentations, funding and strategic decision-making.
Customizable Excel Spreadsheet
Condenses Walsh Group’s complex construction and infrastructure strategy into a clean, editable one-page canvas that saves hours of structuring while enabling quick comparison and collaborative adaptation across teams.
Activities
Design-build integration
Coordinating architects, engineers and construction teams through Walshs design-build integration compresses schedules and enables delivery aligned with 2024 industry trends. Early design input optimizes means and methods, improving constructability and reducing lifecycle cost. Model-based reviews, which in 2024 studies cut rework up to 40%, enhance accuracy. The process lowers change orders and total project risk.
Construction management
Construction management at Walsh governs execution through tight planning, scheduling, and cost control to limit overruns; in the US construction sector, 2024 total construction spending approached $1.9 trillion and managers target sub-5% budget variance. Procurement and logistics synchronize trades and materials across projects, supporting nationwide operations and an industry workforce of roughly 7.5 million in 2024. On-site supervision enforces safety and quality while stakeholder coordination preserves access and regulatory compliance.
Heavy civil and building delivery
Self-perform and managed scopes cover transportation, water and vertical projects, leveraging Walsh Group expertise to execute IIJA-backed work streams from the $1.2 trillion Infrastructure Investment and Jobs Act into 2024. Complex staging sustains continuous operations around live sites and utilities. Specialized equipment and fleet optimization accelerate production rates and reduce schedule risk. Rigorous inspection and commissioning protocols complete safe turnover to owners.
Preconstruction and estimating
Detailed takeoffs and market-informed pricing set firm baselines for Walsh Group preconstruction, using 2024 material cost indices and bid data to reduce pricing variance. Value engineering and alternative delivery options shape competitive, cost-effective proposals. Risk registers quantify exposures and set contingency levels; phasing and constructability reviews de-risk execution and lower change orders.
- Detailed takeoffs
- Market-informed pricing (2024 indices)
- Value engineering
- Risk registers & contingencies
- Phasing & constructability reviews
Safety, quality, and compliance
Programs enforce a zero-harm culture and regulatory adherence through mandatory training, incident reporting, and corrective actions, supporting Walsh Group’s long-term compliance and safety targets.
QA/QC procedures validate specifications via inspection regimes and control plans linked to project KPIs; environmental and community plans mitigate impacts through monitoring and stakeholder engagement; robust documentation supports audits and claims defense.
Integrated design-build cuts rework 40% and targets sub-5% variance in $1.9T US market
Walsh integrates design-build to cut schedules and rework (2024 studies: rework down 40%), manages construction to target sub-5% budget variance amid $1.9T US construction spend (2024), self-performs IIJA $1.2T scopes, and enforces zero-harm safety across a 7.5M workforce (2024).
| Metric | 2024 Value |
|---|---|
| US construction spend | $1.9T |
| Rework reduction | 40% |
| Target budget variance | <5% |
| Workforce | 7.5M |
| IIJA funding | $1.2T |
Full Version Awaits
Business Model Canvas
The Walsh Group Business Model Canvas you’re previewing is the actual deliverable, not a mockup. When you purchase, you’ll receive this exact document—fully formatted and complete—in editable Word and Excel files. No placeholders, no surprises, ready to present or customize immediately.











