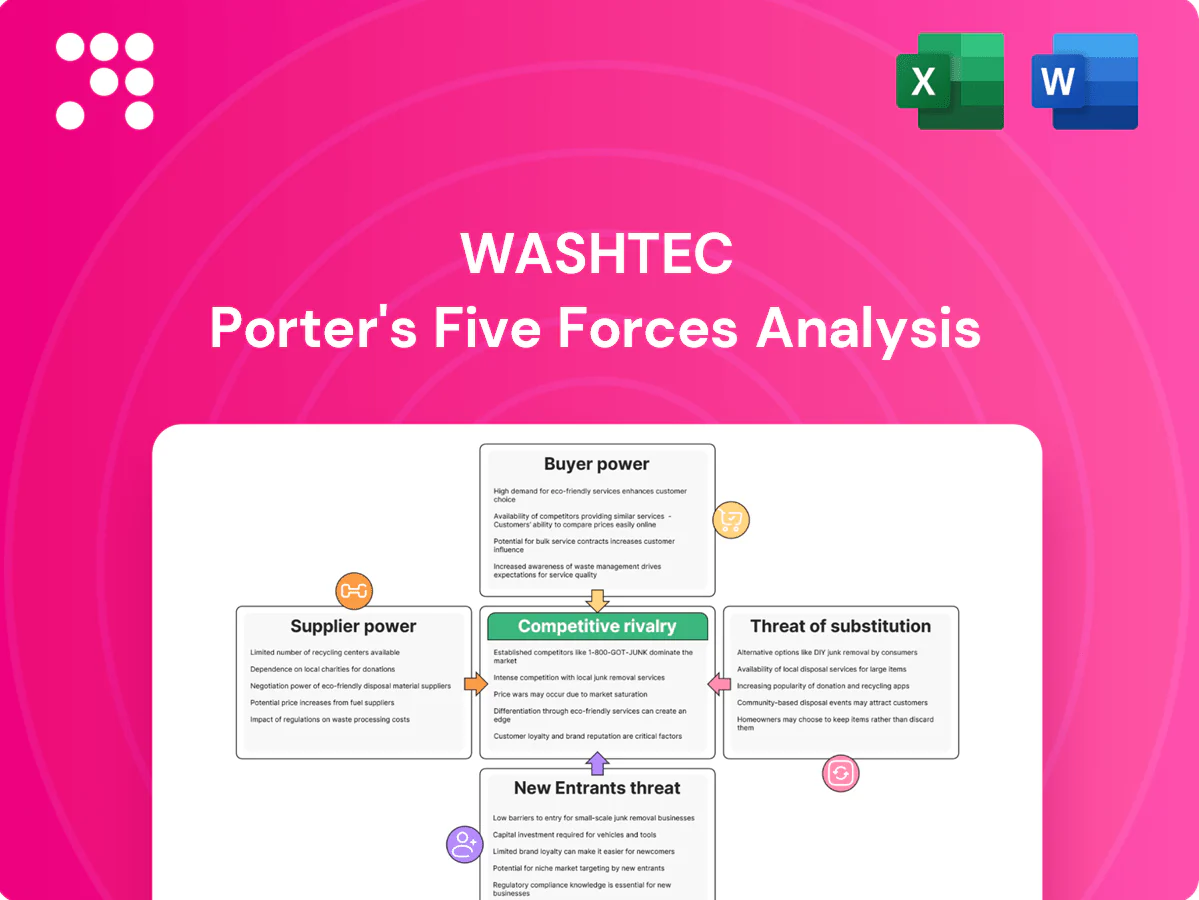
WashTec Porter's Five Forces Analysis

Don't Miss the Bigger Picture
WashTec faces moderate supplier power and growing rivalry as electrification and digital services reshape car wash demand. Buyer expectations and substitute models pressure margins, while regulatory and capital barriers temper new entrants. This snapshot highlights key tensions—unlock the full Porter's Five Forces Analysis to get force-by-force ratings, visuals, and actionable strategy insights for WashTec.
Suppliers Bargaining Power

Specialized component reliance
WashTec’s reliance on non‑commoditized PLCs, sensors, high‑pressure pumps and corrosion‑resistant alloys keeps supplier bargaining power high; limited qualified vendors for safety‑critical parts concentrate risk. In 2024 persistent electronics lead‑time volatility increased dependence on key suppliers, while dual‑sourcing and design standardization reduced disruption exposure and procurement costs.
Chemicals and consumables
Cleaning agents are largely commoditized, reducing supplier power, though specialized performance formulations and stricter eco-compliance in 2024 narrowed supplier options; the global surfactants market was about USD 34 billion in 2024. Volatile input costs (surfactants, solvents) saw price swings near 15% YoY, transmitting pressure to OEMs. Long-term supply contracts (often 2–3 years) helped stabilize pricing, while private-labeling lifted gross margins by roughly 3–5% and reduced supplier reliance.

Energy and steel price exposure
Steel, stainless and energy costs swing with macro cycles and materially affect WashTec equipment BOMs — global hot‑rolled coil traded roughly $700–900/t in 2024 while European TTF gas averaged about €30–40/MWh in 2024, increasing BOM volatility and supplier leverage. Suppliers often pass through increases in tight markets; OEMs mitigate via hedging/forward buys (common 6–18 month covers) and engineering for material efficiency to lower cost sensitivity.

Service parts availability
OEM-specific service parts create vendor lock-in across WashTec’s sub-suppliers, making single-source failures capable of causing downtime across the installed base; strategic inventory buffering and approved alternates reduce supplier leverage, while collaborative forecast visibility with key vendors improves on-time fill rates and service continuity.
ESG and regulatory constraints
Compliance with REACH (≈22,000 registered substances in 2024) and RoHS (10 product categories) plus tightening wastewater limits narrows WashTec's supplier pool; certified eco-chemistry and recyclable-packaging vendors remain a minority, concentrating supplier leverage. Suppliers holding these certifications command price and availability power, while targeted audits and supplier development programs shift influence back toward WashTec.
- REACH scope: ≈22,000 substances (2024)
- RoHS: 10 product categories
- Certified eco-chem suppliers: minority, higher bargaining power
- Audits & development reduce supplier leverage
High supplier power; electronics lead-times +25% YoY, HRC $700–900/t
Supplier power is high for safety‑critical PLCs, sensors and alloy pumps due to few qualified vendors; 2024 electronics lead times rose ~25% YoY. Commoditized cleaners lower power but surfactant market ≈USD 34bn (2024) with ~15% input cost volatility. Steel HRC traded $700–900/t (2024); REACH (≈22,000 substances) and RoHS constrain supplier pool.
| Metric | 2024 |
|---|---|
| Electronics lead-time change | +25% YoY |
| Surfactants market | USD 34bn |
| HRC price | $700–900/t |
What is included in the product
 Detailed Word Document
Tailored Porter's Five Forces analysis for WashTec that uncovers competitive drivers, buyer and supplier influence, entry barriers, substitutes and disruptive threats to its market share, with strategic commentary to inform pricing, positioning and defensive moves.

 Customizable Excel Spreadsheet
A concise, one-sheet Porter’s Five Forces for WashTec—customizable pressure levels with a powerful radar chart, slide-ready layout and duplicate tabs for scenario analysis; no macros required and easy to swap in your own data.
Customers Bargaining Power

Consolidated buyer segments
Large fuel retailers, convenience chains and fleet operators buy car-wash systems at scale and negotiate aggressively, using framework agreements and competitive tenders to compress margins.
These tenders intensify price pressure as volume commitments and multi-site contracts are traded for discounts, extended maintenance terms and faster delivery.
Smaller independents lack that leverage and pay higher unit prices with fewer bundled service benefits.
High switching costs post-install
High switching costs post-install lock buyers in because installed bays, site civil works and software/chemistry integration create sunk capital and operational dependency. Switching disrupts throughput and typically requires retraining (often 1–4 weeks) and new permits, extending downtime. As of 2024 service SLAs in the sector commonly require 98–99% uptime, reinforcing stickiness and reducing buyer power after installation.

Total cost of ownership focus
Buyers prioritize total cost of ownership—optimizing throughput, water (typical modern automated washes use ~40–80 L/vehicle) and energy to cut operating costs while minimizing lifecycle maintenance. Transparent ROI models and 2024 benchmark data (payback often 2–4 years) enable direct vendor comparisons and stronger price negotiation. Efficiency guarantees and verified performance data shift bargaining power toward buyers, while bundled service and chemical contracts stabilize perceived value and reduce variable OPEX.

Price transparency via tenders
Competitive tendering in 2024 makes upfront equipment pricing highly transparent, enabling buyers to cite rival quotes on features and warranty to extract discounts; non-price factors such as site design and permitting support therefore emerge as key differentiators, while value-added analytics (remote monitoring, usage-based service) help suppliers offset pure price pressure.
- Price visibility: leverages competing bids
- Warranty/features: used as negotiation tools
- Service differentiators: site design, permitting
- Analytics: offsets commodity pricing
Option to self-serve and mix brands
Operators increasingly self-serve or mix equipment lines across sites, raising customer bargaining power by enabling multi-sourcing that forces vendors to stay competitive; yet many still standardize fleets to simplify maintenance. Proven reliability and fast local service remain decisive, often overriding price alone.
- Multi-sourcing pressures pricing
- Standardization reduces O&M costs
- Service responsiveness drives loyalty
Large retailers push 98–99% SLA; 2–4 yr payback, 40–80 L/veh cut margins
Large fuel retailers and fleets drive aggressive tenders, squeezing margins; multi-site contracts trade volume for discounts. High switching costs—installed bays, permits, retraining—and 2024 SLAs (98–99% uptime) lock buyers post-install. Buyers push on TCO using 2024 benchmarks (payback 2–4 yrs; water 40–80 L/vehicle), while multi-sourcing and analytics increase negotiation leverage.
| Metric | 2024 benchmark | Effect on bargaining power |
|---|---|---|
| Payback | 2–4 years | Strengthens price comparison |
| Uptime SLA | 98–99% | Reduces post-install leverage |
| Water use | 40–80 L/vehicle | Drives TCO negotiations |
What You See Is What You Get
WashTec Porter's Five Forces Analysis
This preview shows the WashTec Porter's Five Forces Analysis exactly as delivered after purchase: the full, professionally formatted document with no placeholders. Once you buy, you'll get immediate access to this identical file. It's ready for download and use—no surprises, no further setup required.

Don't Miss the Bigger Picture
WashTec faces moderate supplier power and growing rivalry as electrification and digital services reshape car wash demand. Buyer expectations and substitute models pressure margins, while regulatory and capital barriers temper new entrants. This snapshot highlights key tensions—unlock the full Porter's Five Forces Analysis to get force-by-force ratings, visuals, and actionable strategy insights for WashTec.
Suppliers Bargaining Power
Specialized component reliance
WashTec’s reliance on non‑commoditized PLCs, sensors, high‑pressure pumps and corrosion‑resistant alloys keeps supplier bargaining power high; limited qualified vendors for safety‑critical parts concentrate risk. In 2024 persistent electronics lead‑time volatility increased dependence on key suppliers, while dual‑sourcing and design standardization reduced disruption exposure and procurement costs.
Chemicals and consumables
Cleaning agents are largely commoditized, reducing supplier power, though specialized performance formulations and stricter eco-compliance in 2024 narrowed supplier options; the global surfactants market was about USD 34 billion in 2024. Volatile input costs (surfactants, solvents) saw price swings near 15% YoY, transmitting pressure to OEMs. Long-term supply contracts (often 2–3 years) helped stabilize pricing, while private-labeling lifted gross margins by roughly 3–5% and reduced supplier reliance.
Energy and steel price exposure
Steel, stainless and energy costs swing with macro cycles and materially affect WashTec equipment BOMs — global hot‑rolled coil traded roughly $700–900/t in 2024 while European TTF gas averaged about €30–40/MWh in 2024, increasing BOM volatility and supplier leverage. Suppliers often pass through increases in tight markets; OEMs mitigate via hedging/forward buys (common 6–18 month covers) and engineering for material efficiency to lower cost sensitivity.
Service parts availability
OEM-specific service parts create vendor lock-in across WashTec’s sub-suppliers, making single-source failures capable of causing downtime across the installed base; strategic inventory buffering and approved alternates reduce supplier leverage, while collaborative forecast visibility with key vendors improves on-time fill rates and service continuity.
ESG and regulatory constraints
Compliance with REACH (≈22,000 registered substances in 2024) and RoHS (10 product categories) plus tightening wastewater limits narrows WashTec's supplier pool; certified eco-chemistry and recyclable-packaging vendors remain a minority, concentrating supplier leverage. Suppliers holding these certifications command price and availability power, while targeted audits and supplier development programs shift influence back toward WashTec.
- REACH scope: ≈22,000 substances (2024)
- RoHS: 10 product categories
- Certified eco-chem suppliers: minority, higher bargaining power
- Audits & development reduce supplier leverage
High supplier power; electronics lead-times +25% YoY, HRC $700–900/t
Supplier power is high for safety‑critical PLCs, sensors and alloy pumps due to few qualified vendors; 2024 electronics lead times rose ~25% YoY. Commoditized cleaners lower power but surfactant market ≈USD 34bn (2024) with ~15% input cost volatility. Steel HRC traded $700–900/t (2024); REACH (≈22,000 substances) and RoHS constrain supplier pool.
| Metric | 2024 |
|---|---|
| Electronics lead-time change | +25% YoY |
| Surfactants market | USD 34bn |
| HRC price | $700–900/t |
What is included in the product
Detailed Word Document
Tailored Porter's Five Forces analysis for WashTec that uncovers competitive drivers, buyer and supplier influence, entry barriers, substitutes and disruptive threats to its market share, with strategic commentary to inform pricing, positioning and defensive moves.
Customizable Excel Spreadsheet
A concise, one-sheet Porter’s Five Forces for WashTec—customizable pressure levels with a powerful radar chart, slide-ready layout and duplicate tabs for scenario analysis; no macros required and easy to swap in your own data.
Customers Bargaining Power
Consolidated buyer segments
Large fuel retailers, convenience chains and fleet operators buy car-wash systems at scale and negotiate aggressively, using framework agreements and competitive tenders to compress margins.
These tenders intensify price pressure as volume commitments and multi-site contracts are traded for discounts, extended maintenance terms and faster delivery.
Smaller independents lack that leverage and pay higher unit prices with fewer bundled service benefits.
High switching costs post-install
High switching costs post-install lock buyers in because installed bays, site civil works and software/chemistry integration create sunk capital and operational dependency. Switching disrupts throughput and typically requires retraining (often 1–4 weeks) and new permits, extending downtime. As of 2024 service SLAs in the sector commonly require 98–99% uptime, reinforcing stickiness and reducing buyer power after installation.
Total cost of ownership focus
Buyers prioritize total cost of ownership—optimizing throughput, water (typical modern automated washes use ~40–80 L/vehicle) and energy to cut operating costs while minimizing lifecycle maintenance. Transparent ROI models and 2024 benchmark data (payback often 2–4 years) enable direct vendor comparisons and stronger price negotiation. Efficiency guarantees and verified performance data shift bargaining power toward buyers, while bundled service and chemical contracts stabilize perceived value and reduce variable OPEX.
Price transparency via tenders
Competitive tendering in 2024 makes upfront equipment pricing highly transparent, enabling buyers to cite rival quotes on features and warranty to extract discounts; non-price factors such as site design and permitting support therefore emerge as key differentiators, while value-added analytics (remote monitoring, usage-based service) help suppliers offset pure price pressure.
- Price visibility: leverages competing bids
- Warranty/features: used as negotiation tools
- Service differentiators: site design, permitting
- Analytics: offsets commodity pricing
Option to self-serve and mix brands
Operators increasingly self-serve or mix equipment lines across sites, raising customer bargaining power by enabling multi-sourcing that forces vendors to stay competitive; yet many still standardize fleets to simplify maintenance. Proven reliability and fast local service remain decisive, often overriding price alone.
- Multi-sourcing pressures pricing
- Standardization reduces O&M costs
- Service responsiveness drives loyalty
Large retailers push 98–99% SLA; 2–4 yr payback, 40–80 L/veh cut margins
Large fuel retailers and fleets drive aggressive tenders, squeezing margins; multi-site contracts trade volume for discounts. High switching costs—installed bays, permits, retraining—and 2024 SLAs (98–99% uptime) lock buyers post-install. Buyers push on TCO using 2024 benchmarks (payback 2–4 yrs; water 40–80 L/vehicle), while multi-sourcing and analytics increase negotiation leverage.
| Metric | 2024 benchmark | Effect on bargaining power |
|---|---|---|
| Payback | 2–4 years | Strengthens price comparison |
| Uptime SLA | 98–99% | Reduces post-install leverage |
| Water use | 40–80 L/vehicle | Drives TCO negotiations |
What You See Is What You Get
WashTec Porter's Five Forces Analysis
This preview shows the WashTec Porter's Five Forces Analysis exactly as delivered after purchase: the full, professionally formatted document with no placeholders. Once you buy, you'll get immediate access to this identical file. It's ready for download and use—no surprises, no further setup required.
Original: $10.00
-65%$10.00
$3.50Description
Don't Miss the Bigger Picture
WashTec faces moderate supplier power and growing rivalry as electrification and digital services reshape car wash demand. Buyer expectations and substitute models pressure margins, while regulatory and capital barriers temper new entrants. This snapshot highlights key tensions—unlock the full Porter's Five Forces Analysis to get force-by-force ratings, visuals, and actionable strategy insights for WashTec.
Suppliers Bargaining Power
Specialized component reliance
WashTec’s reliance on non‑commoditized PLCs, sensors, high‑pressure pumps and corrosion‑resistant alloys keeps supplier bargaining power high; limited qualified vendors for safety‑critical parts concentrate risk. In 2024 persistent electronics lead‑time volatility increased dependence on key suppliers, while dual‑sourcing and design standardization reduced disruption exposure and procurement costs.
Chemicals and consumables
Cleaning agents are largely commoditized, reducing supplier power, though specialized performance formulations and stricter eco-compliance in 2024 narrowed supplier options; the global surfactants market was about USD 34 billion in 2024. Volatile input costs (surfactants, solvents) saw price swings near 15% YoY, transmitting pressure to OEMs. Long-term supply contracts (often 2–3 years) helped stabilize pricing, while private-labeling lifted gross margins by roughly 3–5% and reduced supplier reliance.
Energy and steel price exposure
Steel, stainless and energy costs swing with macro cycles and materially affect WashTec equipment BOMs — global hot‑rolled coil traded roughly $700–900/t in 2024 while European TTF gas averaged about €30–40/MWh in 2024, increasing BOM volatility and supplier leverage. Suppliers often pass through increases in tight markets; OEMs mitigate via hedging/forward buys (common 6–18 month covers) and engineering for material efficiency to lower cost sensitivity.
Service parts availability
OEM-specific service parts create vendor lock-in across WashTec’s sub-suppliers, making single-source failures capable of causing downtime across the installed base; strategic inventory buffering and approved alternates reduce supplier leverage, while collaborative forecast visibility with key vendors improves on-time fill rates and service continuity.
ESG and regulatory constraints
Compliance with REACH (≈22,000 registered substances in 2024) and RoHS (10 product categories) plus tightening wastewater limits narrows WashTec's supplier pool; certified eco-chemistry and recyclable-packaging vendors remain a minority, concentrating supplier leverage. Suppliers holding these certifications command price and availability power, while targeted audits and supplier development programs shift influence back toward WashTec.
- REACH scope: ≈22,000 substances (2024)
- RoHS: 10 product categories
- Certified eco-chem suppliers: minority, higher bargaining power
- Audits & development reduce supplier leverage
High supplier power; electronics lead-times +25% YoY, HRC $700–900/t
Supplier power is high for safety‑critical PLCs, sensors and alloy pumps due to few qualified vendors; 2024 electronics lead times rose ~25% YoY. Commoditized cleaners lower power but surfactant market ≈USD 34bn (2024) with ~15% input cost volatility. Steel HRC traded $700–900/t (2024); REACH (≈22,000 substances) and RoHS constrain supplier pool.
| Metric | 2024 |
|---|---|
| Electronics lead-time change | +25% YoY |
| Surfactants market | USD 34bn |
| HRC price | $700–900/t |
What is included in the product
Detailed Word Document
Tailored Porter's Five Forces analysis for WashTec that uncovers competitive drivers, buyer and supplier influence, entry barriers, substitutes and disruptive threats to its market share, with strategic commentary to inform pricing, positioning and defensive moves.
Customizable Excel Spreadsheet
A concise, one-sheet Porter’s Five Forces for WashTec—customizable pressure levels with a powerful radar chart, slide-ready layout and duplicate tabs for scenario analysis; no macros required and easy to swap in your own data.
Customers Bargaining Power
Consolidated buyer segments
Large fuel retailers, convenience chains and fleet operators buy car-wash systems at scale and negotiate aggressively, using framework agreements and competitive tenders to compress margins.
These tenders intensify price pressure as volume commitments and multi-site contracts are traded for discounts, extended maintenance terms and faster delivery.
Smaller independents lack that leverage and pay higher unit prices with fewer bundled service benefits.
High switching costs post-install
High switching costs post-install lock buyers in because installed bays, site civil works and software/chemistry integration create sunk capital and operational dependency. Switching disrupts throughput and typically requires retraining (often 1–4 weeks) and new permits, extending downtime. As of 2024 service SLAs in the sector commonly require 98–99% uptime, reinforcing stickiness and reducing buyer power after installation.
Total cost of ownership focus
Buyers prioritize total cost of ownership—optimizing throughput, water (typical modern automated washes use ~40–80 L/vehicle) and energy to cut operating costs while minimizing lifecycle maintenance. Transparent ROI models and 2024 benchmark data (payback often 2–4 years) enable direct vendor comparisons and stronger price negotiation. Efficiency guarantees and verified performance data shift bargaining power toward buyers, while bundled service and chemical contracts stabilize perceived value and reduce variable OPEX.
Price transparency via tenders
Competitive tendering in 2024 makes upfront equipment pricing highly transparent, enabling buyers to cite rival quotes on features and warranty to extract discounts; non-price factors such as site design and permitting support therefore emerge as key differentiators, while value-added analytics (remote monitoring, usage-based service) help suppliers offset pure price pressure.
- Price visibility: leverages competing bids
- Warranty/features: used as negotiation tools
- Service differentiators: site design, permitting
- Analytics: offsets commodity pricing
Option to self-serve and mix brands
Operators increasingly self-serve or mix equipment lines across sites, raising customer bargaining power by enabling multi-sourcing that forces vendors to stay competitive; yet many still standardize fleets to simplify maintenance. Proven reliability and fast local service remain decisive, often overriding price alone.
- Multi-sourcing pressures pricing
- Standardization reduces O&M costs
- Service responsiveness drives loyalty
Large retailers push 98–99% SLA; 2–4 yr payback, 40–80 L/veh cut margins
Large fuel retailers and fleets drive aggressive tenders, squeezing margins; multi-site contracts trade volume for discounts. High switching costs—installed bays, permits, retraining—and 2024 SLAs (98–99% uptime) lock buyers post-install. Buyers push on TCO using 2024 benchmarks (payback 2–4 yrs; water 40–80 L/vehicle), while multi-sourcing and analytics increase negotiation leverage.
| Metric | 2024 benchmark | Effect on bargaining power |
|---|---|---|
| Payback | 2–4 years | Strengthens price comparison |
| Uptime SLA | 98–99% | Reduces post-install leverage |
| Water use | 40–80 L/vehicle | Drives TCO negotiations |
What You See Is What You Get
WashTec Porter's Five Forces Analysis
This preview shows the WashTec Porter's Five Forces Analysis exactly as delivered after purchase: the full, professionally formatted document with no placeholders. Once you buy, you'll get immediate access to this identical file. It's ready for download and use—no surprises, no further setup required.











