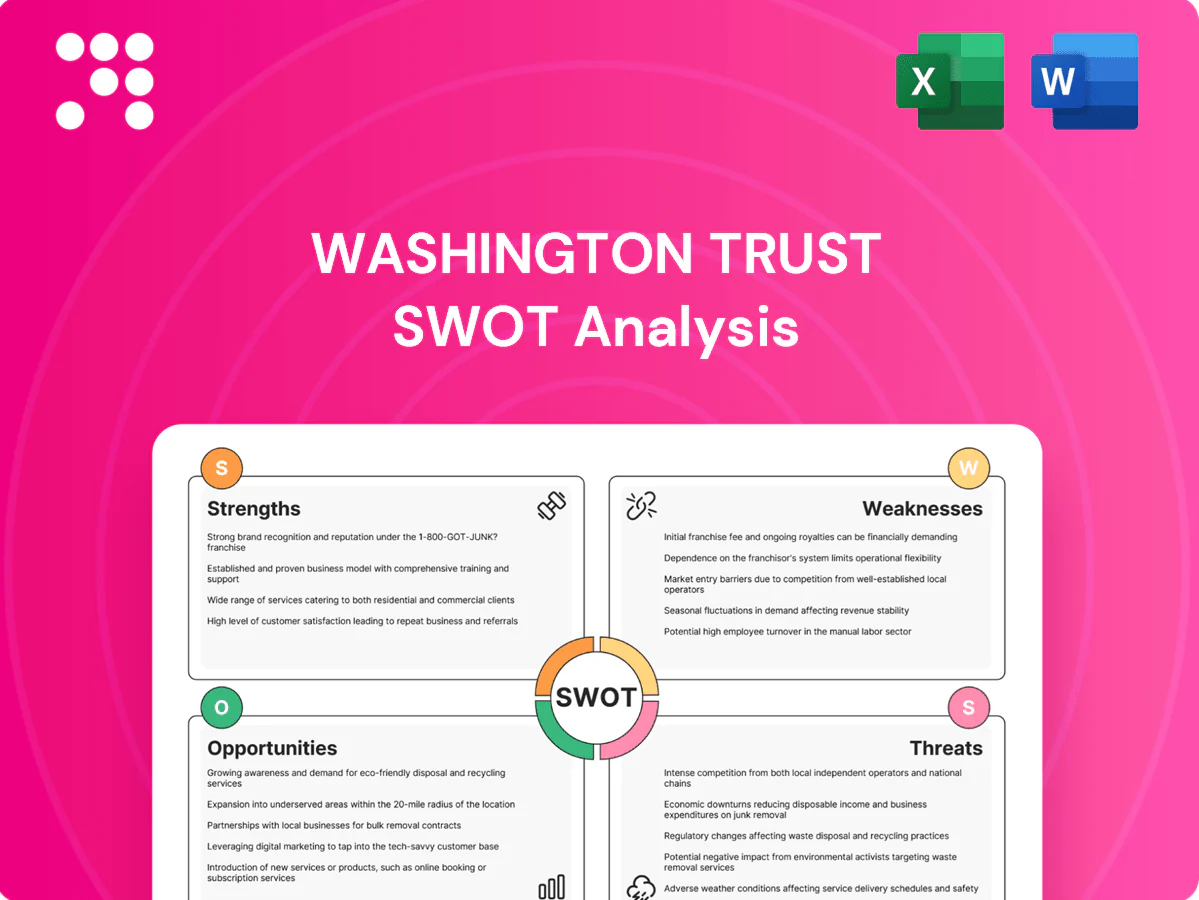
Washington Trust SWOT Analysis

Go Beyond the Preview—Access the Full Strategic Report
Washington Trust shows solid community banking strengths—stable deposit base, strong local brand, and prudent credit underwriting—but faces margin pressure, digital competition, and regional concentration risks. Want deeper strategic context, financials, and executable recommendations? Purchase the full SWOT to get a professionally formatted Word report plus an editable Excel matrix for planning and investor use.
Strengths

Diversified financial services suite
Offering commercial and personal banking, mortgages, insurance and wealth management gives Washington Trust multiple revenue streams and helped sustain operations against product cycles, supporting its balance sheet across an asset base of over $6 billion in 2024. Cross-functional teams can bundle solutions to increase wallet share and noninterest income. Multi-product relationships boost client stickiness and recurring fee revenue.
Established regional brand presence
Operating mainly in Rhode Island, Connecticut and Massachusetts gives Washington Trust strong local recognition and relationship-banking advantages that support higher retention and referrals. Local decisioning speeds credit approvals, improving satisfaction and time-to-funding. Community roots underpin stable, low-cost deposits, supporting the bank’s $6.7 billion asset base (2024).

Wealth management and trust capabilities
Advisory, trust, and wealth services at Washington Trust bolster fee income by serving higher-net-worth clients, with roughly $4.2 billion in assets under administration reported in 2024 and wealth fees contributing materially to noninterest revenue. These offerings are less sensitive to interest-rate swings than spread revenue and create strong cross-sell pipelines into retail and commercial banking. Fiduciary expertise differentiates the bank from commoditized lenders, supporting client retention and margin stability.

Balanced commercial and retail focus
Balanced commercial and retail focus diversifies credit exposure by serving individuals, families, and businesses, with commercial lending representing roughly half of loan originations and retail deposits providing stable funding; as of mid-2025 Washington Trust reported about $7.0 billion in assets and $5.1 billion in core deposits. The mix lets management pivot to segments with better risk-adjusted returns while commercial relationships deepen through treasury and payments services.
- Commercial loans: ~50% of originations
- Core deposits: $5.1B (mid-2025)
- Total assets: $7.0B (mid-2025)
- Treasury/payments deepen commercial share
Subsidiary operating leverage
Centralizing services at The Washington Trust Company streamlines back-office functions and reduces operating redundancies across business lines; shared platforms lower transaction and tech overhead while enabling consistent governance and risk controls, supporting scalable regional growth.
- Centralized operations
- Shared platforms reduce duplication
- Consistent governance and risk frameworks
- Supports scalable regional growth
Multi-product New England bank: assets $7.0B
Multi-product platform (banking, wealth, insurance) creates diversified revenue and high client stickiness. Strong New England footprint enables local decisioning and low-cost deposits. Wealth AUA $4.2B (2024) and fee income stabilize margins. Assets $7.0B and core deposits $5.1B (mid-2025) support lending and growth.
| Metric | Value |
|---|---|
| Total assets | $7.0B (mid-2025) |
| Core deposits | $5.1B (mid-2025) |
| Wealth AUA | $4.2B (2024) |
| Commercial share | ~50% originations |
What is included in the product
 Detailed Word Document
Provides a concise SWOT analysis of Washington Trust, outlining its core strengths, operational weaknesses, market opportunities, and external threats to assess strategic position and growth prospects.

 Customizable Excel Spreadsheet
Provides a compact Washington Trust SWOT matrix for rapid strategic alignment and decision-making, easing stakeholder briefings and executive reviews.
Weaknesses

Geographic concentration risk
Washington Trust’s revenue and deposits are heavily concentrated in Southern New England, with the bank headquartered in Westerly, Rhode Island and the vast majority of its branch network and customer base located in RI/Massachusetts; local economic downturns or industry shocks therefore disproportionately impact performance. Regional housing or employment softness could quickly pressure credit quality and loan loss provisions. The limited geographic footprint reduces national diversification benefits and heightens sensitivity to local cyclical risks.
Scale disadvantages vs larger peers
Washington Trust Bancorp (NASDAQ: WASH), with assets well below national peers (major banks hold trillions—JPMorgan Chase had about $3.8 trillion in 2024), faces scale disadvantages: a smaller balance sheet constrains technology spend, deposit and loan pricing power lags national banks, marketing reach and product breadth remain narrower, and fixed vendor and compliance costs consume a larger share of margins for a sub-$10 billion institution.

Interest-rate and margin sensitivity
Net interest income at Washington Trust is exposed to rate swings as the federal funds target remained elevated around 5.25–5.50% in 2024–25, making NII volatile; funding costs can reprice faster than long-duration asset yields in rising-rate cycles. Mortgage origination volumes have swung materially (industry origination volumes fell roughly 40–50% from 2020 peaks), and NIM compression during competitive cycles can meaningfully pressure profitability.

Mortgage and CRE cyclicality
Residential mortgage activity remains sensitive to housing turnover and affordability after 30-year rates climbed above 7% in 2022–23, denting purchase and refinance volumes; refinancing booms and busts have driven Washington Trust fee income volatility. Commercial real estate cycles and post-pandemic valuation pressure have elevated concentration and credit risk, so disciplined underwriting is needed to offset these cyclical headwinds.
- Higher rates reduced refinance volumes sharply
- CRE valuation pressure raises concentration risk
- Fee income volatile across rate cycles
- Underwriting discipline critical to mitigate losses
Technology and digital gaps
Keeping pace with fintech-grade user experiences requires sustained investment; Washington Trust reported about $5.8 billion in assets in 2024, limiting scale economies versus national competitors.
Legacy systems can slow product rollout and third-party integration, while data analytics maturity trails larger banks, hindering acquisition and engagement of digital-first customers.
- Scale: limited by ~5.8B assets (2024)
- UX: needs continued investment
- Legacy systems: slow integrations
- Analytics: behind larger banks, hurts digital customer growth
Regional bank with $5.8B assets faces RI/MA concentration, rate and scale pressures
Washington Trust’s revenue and deposits are highly concentrated in RI/MA; $5.8B assets (2024) amplify local downturn risk. Scale limits tech/marketing spend and raises per-unit compliance costs versus national peers (JPMorgan ~$3.8T). NII is exposed to rate volatility (Fed funds 5.25–5.50% in 2024–25) while mortgage and CRE sensitivity pressures fee income and credit.
| Metric | Value |
|---|---|
| Assets (2024) | $5.8B |
| Geographic focus | RI/MA majority |
| Fed funds (2024–25) | 5.25–5.50% |
| Peer (JPMorgan) | $3.8T |
What You See Is What You Get
Washington Trust SWOT Analysis
This is the actual Washington Trust SWOT analysis document you’ll receive upon purchase—no surprises, just professional quality and a ready-to-use, editable file. The preview below is pulled directly from the full report to show exact formatting and depth. Buy now to unlock the complete, detailed version immediately after checkout.

Go Beyond the Preview—Access the Full Strategic Report
Washington Trust shows solid community banking strengths—stable deposit base, strong local brand, and prudent credit underwriting—but faces margin pressure, digital competition, and regional concentration risks. Want deeper strategic context, financials, and executable recommendations? Purchase the full SWOT to get a professionally formatted Word report plus an editable Excel matrix for planning and investor use.
Strengths
Diversified financial services suite
Offering commercial and personal banking, mortgages, insurance and wealth management gives Washington Trust multiple revenue streams and helped sustain operations against product cycles, supporting its balance sheet across an asset base of over $6 billion in 2024. Cross-functional teams can bundle solutions to increase wallet share and noninterest income. Multi-product relationships boost client stickiness and recurring fee revenue.
Established regional brand presence
Operating mainly in Rhode Island, Connecticut and Massachusetts gives Washington Trust strong local recognition and relationship-banking advantages that support higher retention and referrals. Local decisioning speeds credit approvals, improving satisfaction and time-to-funding. Community roots underpin stable, low-cost deposits, supporting the bank’s $6.7 billion asset base (2024).
Wealth management and trust capabilities
Advisory, trust, and wealth services at Washington Trust bolster fee income by serving higher-net-worth clients, with roughly $4.2 billion in assets under administration reported in 2024 and wealth fees contributing materially to noninterest revenue. These offerings are less sensitive to interest-rate swings than spread revenue and create strong cross-sell pipelines into retail and commercial banking. Fiduciary expertise differentiates the bank from commoditized lenders, supporting client retention and margin stability.
Balanced commercial and retail focus
Balanced commercial and retail focus diversifies credit exposure by serving individuals, families, and businesses, with commercial lending representing roughly half of loan originations and retail deposits providing stable funding; as of mid-2025 Washington Trust reported about $7.0 billion in assets and $5.1 billion in core deposits. The mix lets management pivot to segments with better risk-adjusted returns while commercial relationships deepen through treasury and payments services.
- Commercial loans: ~50% of originations
- Core deposits: $5.1B (mid-2025)
- Total assets: $7.0B (mid-2025)
- Treasury/payments deepen commercial share
Subsidiary operating leverage
Centralizing services at The Washington Trust Company streamlines back-office functions and reduces operating redundancies across business lines; shared platforms lower transaction and tech overhead while enabling consistent governance and risk controls, supporting scalable regional growth.
- Centralized operations
- Shared platforms reduce duplication
- Consistent governance and risk frameworks
- Supports scalable regional growth
Multi-product New England bank: assets $7.0B
Multi-product platform (banking, wealth, insurance) creates diversified revenue and high client stickiness. Strong New England footprint enables local decisioning and low-cost deposits. Wealth AUA $4.2B (2024) and fee income stabilize margins. Assets $7.0B and core deposits $5.1B (mid-2025) support lending and growth.
| Metric | Value |
|---|---|
| Total assets | $7.0B (mid-2025) |
| Core deposits | $5.1B (mid-2025) |
| Wealth AUA | $4.2B (2024) |
| Commercial share | ~50% originations |
What is included in the product
Detailed Word Document
Provides a concise SWOT analysis of Washington Trust, outlining its core strengths, operational weaknesses, market opportunities, and external threats to assess strategic position and growth prospects.
Customizable Excel Spreadsheet
Provides a compact Washington Trust SWOT matrix for rapid strategic alignment and decision-making, easing stakeholder briefings and executive reviews.
Weaknesses
Geographic concentration risk
Washington Trust’s revenue and deposits are heavily concentrated in Southern New England, with the bank headquartered in Westerly, Rhode Island and the vast majority of its branch network and customer base located in RI/Massachusetts; local economic downturns or industry shocks therefore disproportionately impact performance. Regional housing or employment softness could quickly pressure credit quality and loan loss provisions. The limited geographic footprint reduces national diversification benefits and heightens sensitivity to local cyclical risks.
Scale disadvantages vs larger peers
Washington Trust Bancorp (NASDAQ: WASH), with assets well below national peers (major banks hold trillions—JPMorgan Chase had about $3.8 trillion in 2024), faces scale disadvantages: a smaller balance sheet constrains technology spend, deposit and loan pricing power lags national banks, marketing reach and product breadth remain narrower, and fixed vendor and compliance costs consume a larger share of margins for a sub-$10 billion institution.
Interest-rate and margin sensitivity
Net interest income at Washington Trust is exposed to rate swings as the federal funds target remained elevated around 5.25–5.50% in 2024–25, making NII volatile; funding costs can reprice faster than long-duration asset yields in rising-rate cycles. Mortgage origination volumes have swung materially (industry origination volumes fell roughly 40–50% from 2020 peaks), and NIM compression during competitive cycles can meaningfully pressure profitability.
Mortgage and CRE cyclicality
Residential mortgage activity remains sensitive to housing turnover and affordability after 30-year rates climbed above 7% in 2022–23, denting purchase and refinance volumes; refinancing booms and busts have driven Washington Trust fee income volatility. Commercial real estate cycles and post-pandemic valuation pressure have elevated concentration and credit risk, so disciplined underwriting is needed to offset these cyclical headwinds.
- Higher rates reduced refinance volumes sharply
- CRE valuation pressure raises concentration risk
- Fee income volatile across rate cycles
- Underwriting discipline critical to mitigate losses
Technology and digital gaps
Keeping pace with fintech-grade user experiences requires sustained investment; Washington Trust reported about $5.8 billion in assets in 2024, limiting scale economies versus national competitors.
Legacy systems can slow product rollout and third-party integration, while data analytics maturity trails larger banks, hindering acquisition and engagement of digital-first customers.
- Scale: limited by ~5.8B assets (2024)
- UX: needs continued investment
- Legacy systems: slow integrations
- Analytics: behind larger banks, hurts digital customer growth
Regional bank with $5.8B assets faces RI/MA concentration, rate and scale pressures
Washington Trust’s revenue and deposits are highly concentrated in RI/MA; $5.8B assets (2024) amplify local downturn risk. Scale limits tech/marketing spend and raises per-unit compliance costs versus national peers (JPMorgan ~$3.8T). NII is exposed to rate volatility (Fed funds 5.25–5.50% in 2024–25) while mortgage and CRE sensitivity pressures fee income and credit.
| Metric | Value |
|---|---|
| Assets (2024) | $5.8B |
| Geographic focus | RI/MA majority |
| Fed funds (2024–25) | 5.25–5.50% |
| Peer (JPMorgan) | $3.8T |
What You See Is What You Get
Washington Trust SWOT Analysis
This is the actual Washington Trust SWOT analysis document you’ll receive upon purchase—no surprises, just professional quality and a ready-to-use, editable file. The preview below is pulled directly from the full report to show exact formatting and depth. Buy now to unlock the complete, detailed version immediately after checkout.
Original: $10.00
-65%$10.00
$3.50Description
Go Beyond the Preview—Access the Full Strategic Report
Washington Trust shows solid community banking strengths—stable deposit base, strong local brand, and prudent credit underwriting—but faces margin pressure, digital competition, and regional concentration risks. Want deeper strategic context, financials, and executable recommendations? Purchase the full SWOT to get a professionally formatted Word report plus an editable Excel matrix for planning and investor use.
Strengths
Diversified financial services suite
Offering commercial and personal banking, mortgages, insurance and wealth management gives Washington Trust multiple revenue streams and helped sustain operations against product cycles, supporting its balance sheet across an asset base of over $6 billion in 2024. Cross-functional teams can bundle solutions to increase wallet share and noninterest income. Multi-product relationships boost client stickiness and recurring fee revenue.
Established regional brand presence
Operating mainly in Rhode Island, Connecticut and Massachusetts gives Washington Trust strong local recognition and relationship-banking advantages that support higher retention and referrals. Local decisioning speeds credit approvals, improving satisfaction and time-to-funding. Community roots underpin stable, low-cost deposits, supporting the bank’s $6.7 billion asset base (2024).
Wealth management and trust capabilities
Advisory, trust, and wealth services at Washington Trust bolster fee income by serving higher-net-worth clients, with roughly $4.2 billion in assets under administration reported in 2024 and wealth fees contributing materially to noninterest revenue. These offerings are less sensitive to interest-rate swings than spread revenue and create strong cross-sell pipelines into retail and commercial banking. Fiduciary expertise differentiates the bank from commoditized lenders, supporting client retention and margin stability.
Balanced commercial and retail focus
Balanced commercial and retail focus diversifies credit exposure by serving individuals, families, and businesses, with commercial lending representing roughly half of loan originations and retail deposits providing stable funding; as of mid-2025 Washington Trust reported about $7.0 billion in assets and $5.1 billion in core deposits. The mix lets management pivot to segments with better risk-adjusted returns while commercial relationships deepen through treasury and payments services.
- Commercial loans: ~50% of originations
- Core deposits: $5.1B (mid-2025)
- Total assets: $7.0B (mid-2025)
- Treasury/payments deepen commercial share
Subsidiary operating leverage
Centralizing services at The Washington Trust Company streamlines back-office functions and reduces operating redundancies across business lines; shared platforms lower transaction and tech overhead while enabling consistent governance and risk controls, supporting scalable regional growth.
- Centralized operations
- Shared platforms reduce duplication
- Consistent governance and risk frameworks
- Supports scalable regional growth
Multi-product New England bank: assets $7.0B
Multi-product platform (banking, wealth, insurance) creates diversified revenue and high client stickiness. Strong New England footprint enables local decisioning and low-cost deposits. Wealth AUA $4.2B (2024) and fee income stabilize margins. Assets $7.0B and core deposits $5.1B (mid-2025) support lending and growth.
| Metric | Value |
|---|---|
| Total assets | $7.0B (mid-2025) |
| Core deposits | $5.1B (mid-2025) |
| Wealth AUA | $4.2B (2024) |
| Commercial share | ~50% originations |
What is included in the product
Detailed Word Document
Provides a concise SWOT analysis of Washington Trust, outlining its core strengths, operational weaknesses, market opportunities, and external threats to assess strategic position and growth prospects.
Customizable Excel Spreadsheet
Provides a compact Washington Trust SWOT matrix for rapid strategic alignment and decision-making, easing stakeholder briefings and executive reviews.
Weaknesses
Geographic concentration risk
Washington Trust’s revenue and deposits are heavily concentrated in Southern New England, with the bank headquartered in Westerly, Rhode Island and the vast majority of its branch network and customer base located in RI/Massachusetts; local economic downturns or industry shocks therefore disproportionately impact performance. Regional housing or employment softness could quickly pressure credit quality and loan loss provisions. The limited geographic footprint reduces national diversification benefits and heightens sensitivity to local cyclical risks.
Scale disadvantages vs larger peers
Washington Trust Bancorp (NASDAQ: WASH), with assets well below national peers (major banks hold trillions—JPMorgan Chase had about $3.8 trillion in 2024), faces scale disadvantages: a smaller balance sheet constrains technology spend, deposit and loan pricing power lags national banks, marketing reach and product breadth remain narrower, and fixed vendor and compliance costs consume a larger share of margins for a sub-$10 billion institution.
Interest-rate and margin sensitivity
Net interest income at Washington Trust is exposed to rate swings as the federal funds target remained elevated around 5.25–5.50% in 2024–25, making NII volatile; funding costs can reprice faster than long-duration asset yields in rising-rate cycles. Mortgage origination volumes have swung materially (industry origination volumes fell roughly 40–50% from 2020 peaks), and NIM compression during competitive cycles can meaningfully pressure profitability.
Mortgage and CRE cyclicality
Residential mortgage activity remains sensitive to housing turnover and affordability after 30-year rates climbed above 7% in 2022–23, denting purchase and refinance volumes; refinancing booms and busts have driven Washington Trust fee income volatility. Commercial real estate cycles and post-pandemic valuation pressure have elevated concentration and credit risk, so disciplined underwriting is needed to offset these cyclical headwinds.
- Higher rates reduced refinance volumes sharply
- CRE valuation pressure raises concentration risk
- Fee income volatile across rate cycles
- Underwriting discipline critical to mitigate losses
Technology and digital gaps
Keeping pace with fintech-grade user experiences requires sustained investment; Washington Trust reported about $5.8 billion in assets in 2024, limiting scale economies versus national competitors.
Legacy systems can slow product rollout and third-party integration, while data analytics maturity trails larger banks, hindering acquisition and engagement of digital-first customers.
- Scale: limited by ~5.8B assets (2024)
- UX: needs continued investment
- Legacy systems: slow integrations
- Analytics: behind larger banks, hurts digital customer growth
Regional bank with $5.8B assets faces RI/MA concentration, rate and scale pressures
Washington Trust’s revenue and deposits are highly concentrated in RI/MA; $5.8B assets (2024) amplify local downturn risk. Scale limits tech/marketing spend and raises per-unit compliance costs versus national peers (JPMorgan ~$3.8T). NII is exposed to rate volatility (Fed funds 5.25–5.50% in 2024–25) while mortgage and CRE sensitivity pressures fee income and credit.
| Metric | Value |
|---|---|
| Assets (2024) | $5.8B |
| Geographic focus | RI/MA majority |
| Fed funds (2024–25) | 5.25–5.50% |
| Peer (JPMorgan) | $3.8T |
What You See Is What You Get
Washington Trust SWOT Analysis
This is the actual Washington Trust SWOT analysis document you’ll receive upon purchase—no surprises, just professional quality and a ready-to-use, editable file. The preview below is pulled directly from the full report to show exact formatting and depth. Buy now to unlock the complete, detailed version immediately after checkout.











