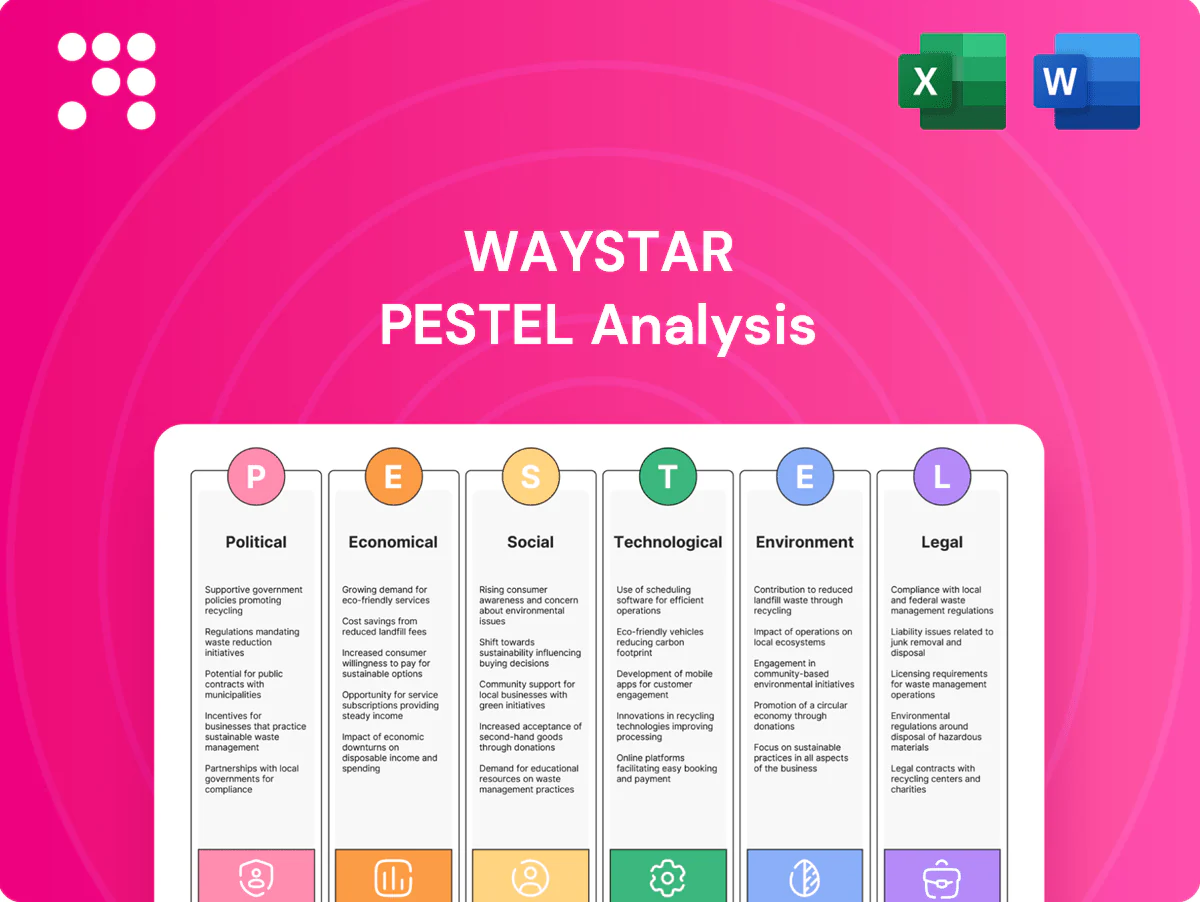
Waystar PESTLE Analysis

Your Competitive Advantage Starts with This Report
Our PESTLE Analysis of Waystar reveals how political shifts, reimbursement trends, and rapid healthcare tech advances shape its growth and risks; ideal for investors and strategists needing clarity. Purchase the full report to access detailed, actionable insights and ready-to-use charts for immediate decision-making.
Political factors

US health policy shifts
Shifts in US health policy—notably Medicare (about 64 million beneficiaries) and Medicaid/CHIP (roughly 86 million enrollees in 2024)—directly alter provider cash flows and demand for Waystar’s revenue-cycle platform. Election cycles can swing priorities between cost containment and access expansion, changing reimbursement rules and utilization. Waystar must invest in continuous policy surveillance and rapid product updates; proactive lobbying and payer-provider coalitions can blunt adverse rule impacts.
Interoperability mandates
ONC and CMS 2020 rules (Cures Act implementations) mandate FHIR-based APIs and data-sharing, forcing product roadmaps toward real-time exchange; over 90% of US hospitals use certified EHRs, making integrations essential. Compliance creates competitive advantage by enabling seamless EHR and payer connections, while non-compliance risks exclusion from major networks and contracts. Waystar should invest in standards leadership and certification readiness.

Government funding & incentives
Federal and state grants can catalyze provider upgrades; BEAD's $42.45 billion broadband fund expands rural connectivity and creates health IT opportunities. Public health priorities like rural access and Medicaid (about 80 million enrollees) drive targeted procurements. Waystar can map products to funded programs to accelerate adoption and use quantified ROI metrics to help providers secure budget approvals.

Data sovereignty & localization
Data sovereignty rules increasingly require PHI to be stored or controlled locally in some jurisdictions; by 2024 over 70 countries had data localization measures. This shifts cloud architecture, vendor selection, and cross-border flows, pushing Waystar toward regional data hubs and contractual safeguards. IBM reports the 2024 average cost of a healthcare breach was $10.93M, highlighting compliance stakes. Early alignment lowers sales friction and remediation expenses.
- Impact: local storage mandates in 70+ countries
- Action: build regional hubs and strict vendor SLAs
- Risk: $10.93M average healthcare breach cost (IBM 2024)
- Benefit: fewer sales obstacles, lower compliance spend
Public-private payment reforms
Policy shifts, ~64M/~86M enrollees; $42.45B BEAD; $10.93M breach cost
US policy shifts (Medicare ~64M, Medicaid/CHIP ~86M) and Cures Act/FHIR mandates force Waystar to adapt product roadmaps; BEAD $42.45B broadband funding and >70 countries with localization rules create regional infrastructure needs; 2024 average healthcare breach cost $10.93M raises compliance stakes; value-based and transparency reforms increase demand for configurable rule engines.
| Factor | Metric |
|---|---|
| Medicare | ~64M beneficiaries |
| Medicaid/CHIP | ~86M enrollees |
| BEAD fund | $42.45B |
| Data localization | 70+ countries |
| Breach cost (2024) | $10.93M |
What is included in the product
 Detailed Word Document
Explores how macro-environmental factors uniquely affect Waystar across Political, Economic, Social, Technological, Environmental and Legal dimensions, with data-backed trends and industry-specific sub-points; designed for executives and investors, reflecting current market and regulatory dynamics and offering forward-looking insights for strategy, risk mitigation and funding readiness.

 Customizable Excel Spreadsheet
Waystar PESTLE Analysis provides a clean, visually segmented summary of external risks and market drivers, easily dropped into presentations or shared across teams, with editable notes for region-specific context to streamline planning and stakeholder alignment.
Economic factors

Provider margin pressure
Hospitals and physician groups facing thin margins—with labor typically ~60% of operating costs and uncompensated care near $60 billion nationally (AHA, 2022)—prioritize cash acceleration and cost reduction, boosting demand for RCM automation and denial prevention. Vendors must demonstrate fast payback and measurable yield lifts; tiered offerings align with varied provider solvency profiles and capital constraints.
Interest rates & capital access
Higher U.S. policy rates (effective federal funds ~5.33% mid‑2025) and commercial loan spreads (~7–9%) constrain provider CapEx and lengthen sales cycles, making opex‑friendly SaaS and outcome‑based pricing more attractive; Waystar can counter with financing programs, modular deployments and ROI guarantees to shorten buy cycles. A later lower‑rate cycle would likely reopen upsell pathways for advanced analytics as IT spend rebounds.

Payer mix & reimbursement trends
Shifts toward Medicare Advantage—enrollment ~32 million in 2024, roughly 55–58% of Medicare beneficiaries—and widespread Medicaid managed care (~70%+ enrollees) are altering denial patterns and payment timing, increasing claim variability. Growing contract complexity raises the value of comprehensive rules libraries and direct payer connectivity. Waystar must continuously refresh payer-specific edits and use analytics on underpayments to strengthen clients’ renegotiation leverage.

Industry consolidation
Industry consolidation in 2024 accelerated platform rationalization as large health systems and physician aggregators standardized tech stacks, allowing winners to lock enterprise-wide contracts while smaller vendors face displacement; healthcare M&A deal value exceeded $120B globally in 2024, amplifying scale advantages. Waystar must deliver scalable implementation playbooks and migration tooling to convert rollups into long-term customers. Robust partner ecosystems can defend share during platform swaps by offering integration continuity and migration services.
Labor constraints & outsourcing
RCM staffing shortages are accelerating demand for automation and managed services as providers seek to cut back-office overload; McKinsey 2024 estimates automation can reduce administrative costs by up to 40%, enabling bots and AI triage to replace repetitive tasks and lower FTE dependence.
- Bundle tech + BPO for outcomes-based SLAs
- Measure productivity gains as sales metric
- Reduced FTE cost improves margin and retention
Policy shifts, ~64M/~86M enrollees; $42.45B BEAD; $10.93M breach cost
Provider margins remain thin—labor ~60% of costs and uncompensated care ~$60B (AHA 2022)—driving urgent demand for RCM automation and cash acceleration. Higher policy rates (~5.33% mid‑2025) and loan spreads (7–9%) favor opex SaaS and outcome pricing; financing and ROI guarantees shorten sales cycles. MA enrollment ~32M (2024) and 70%+ Medicaid managed care increase claim variability, raising value of payer‑specific rules and analytics.
| Metric | Value |
|---|---|
| Labor % of costs | ~60% |
| Fed funds (mid‑2025) | ~5.33% |
Preview the Actual Deliverable
Waystar PESTLE Analysis
The preview shown here is the exact Waystar PESTLE Analysis document you’ll receive after purchase—fully formatted and ready to use. Everything displayed is final content and structure, with no placeholders or teasers. After payment you’ll instantly download this exact, professionally structured file.

Your Competitive Advantage Starts with This Report
Our PESTLE Analysis of Waystar reveals how political shifts, reimbursement trends, and rapid healthcare tech advances shape its growth and risks; ideal for investors and strategists needing clarity. Purchase the full report to access detailed, actionable insights and ready-to-use charts for immediate decision-making.
Political factors
US health policy shifts
Shifts in US health policy—notably Medicare (about 64 million beneficiaries) and Medicaid/CHIP (roughly 86 million enrollees in 2024)—directly alter provider cash flows and demand for Waystar’s revenue-cycle platform. Election cycles can swing priorities between cost containment and access expansion, changing reimbursement rules and utilization. Waystar must invest in continuous policy surveillance and rapid product updates; proactive lobbying and payer-provider coalitions can blunt adverse rule impacts.
Interoperability mandates
ONC and CMS 2020 rules (Cures Act implementations) mandate FHIR-based APIs and data-sharing, forcing product roadmaps toward real-time exchange; over 90% of US hospitals use certified EHRs, making integrations essential. Compliance creates competitive advantage by enabling seamless EHR and payer connections, while non-compliance risks exclusion from major networks and contracts. Waystar should invest in standards leadership and certification readiness.
Government funding & incentives
Federal and state grants can catalyze provider upgrades; BEAD's $42.45 billion broadband fund expands rural connectivity and creates health IT opportunities. Public health priorities like rural access and Medicaid (about 80 million enrollees) drive targeted procurements. Waystar can map products to funded programs to accelerate adoption and use quantified ROI metrics to help providers secure budget approvals.
Data sovereignty & localization
Data sovereignty rules increasingly require PHI to be stored or controlled locally in some jurisdictions; by 2024 over 70 countries had data localization measures. This shifts cloud architecture, vendor selection, and cross-border flows, pushing Waystar toward regional data hubs and contractual safeguards. IBM reports the 2024 average cost of a healthcare breach was $10.93M, highlighting compliance stakes. Early alignment lowers sales friction and remediation expenses.
- Impact: local storage mandates in 70+ countries
- Action: build regional hubs and strict vendor SLAs
- Risk: $10.93M average healthcare breach cost (IBM 2024)
- Benefit: fewer sales obstacles, lower compliance spend
Public-private payment reforms
Policy shifts, ~64M/~86M enrollees; $42.45B BEAD; $10.93M breach cost
US policy shifts (Medicare ~64M, Medicaid/CHIP ~86M) and Cures Act/FHIR mandates force Waystar to adapt product roadmaps; BEAD $42.45B broadband funding and >70 countries with localization rules create regional infrastructure needs; 2024 average healthcare breach cost $10.93M raises compliance stakes; value-based and transparency reforms increase demand for configurable rule engines.
| Factor | Metric |
|---|---|
| Medicare | ~64M beneficiaries |
| Medicaid/CHIP | ~86M enrollees |
| BEAD fund | $42.45B |
| Data localization | 70+ countries |
| Breach cost (2024) | $10.93M |
What is included in the product
Detailed Word Document
Explores how macro-environmental factors uniquely affect Waystar across Political, Economic, Social, Technological, Environmental and Legal dimensions, with data-backed trends and industry-specific sub-points; designed for executives and investors, reflecting current market and regulatory dynamics and offering forward-looking insights for strategy, risk mitigation and funding readiness.
Customizable Excel Spreadsheet
Waystar PESTLE Analysis provides a clean, visually segmented summary of external risks and market drivers, easily dropped into presentations or shared across teams, with editable notes for region-specific context to streamline planning and stakeholder alignment.
Economic factors
Provider margin pressure
Hospitals and physician groups facing thin margins—with labor typically ~60% of operating costs and uncompensated care near $60 billion nationally (AHA, 2022)—prioritize cash acceleration and cost reduction, boosting demand for RCM automation and denial prevention. Vendors must demonstrate fast payback and measurable yield lifts; tiered offerings align with varied provider solvency profiles and capital constraints.
Interest rates & capital access
Higher U.S. policy rates (effective federal funds ~5.33% mid‑2025) and commercial loan spreads (~7–9%) constrain provider CapEx and lengthen sales cycles, making opex‑friendly SaaS and outcome‑based pricing more attractive; Waystar can counter with financing programs, modular deployments and ROI guarantees to shorten buy cycles. A later lower‑rate cycle would likely reopen upsell pathways for advanced analytics as IT spend rebounds.
Payer mix & reimbursement trends
Shifts toward Medicare Advantage—enrollment ~32 million in 2024, roughly 55–58% of Medicare beneficiaries—and widespread Medicaid managed care (~70%+ enrollees) are altering denial patterns and payment timing, increasing claim variability. Growing contract complexity raises the value of comprehensive rules libraries and direct payer connectivity. Waystar must continuously refresh payer-specific edits and use analytics on underpayments to strengthen clients’ renegotiation leverage.
Industry consolidation
Industry consolidation in 2024 accelerated platform rationalization as large health systems and physician aggregators standardized tech stacks, allowing winners to lock enterprise-wide contracts while smaller vendors face displacement; healthcare M&A deal value exceeded $120B globally in 2024, amplifying scale advantages. Waystar must deliver scalable implementation playbooks and migration tooling to convert rollups into long-term customers. Robust partner ecosystems can defend share during platform swaps by offering integration continuity and migration services.
Labor constraints & outsourcing
RCM staffing shortages are accelerating demand for automation and managed services as providers seek to cut back-office overload; McKinsey 2024 estimates automation can reduce administrative costs by up to 40%, enabling bots and AI triage to replace repetitive tasks and lower FTE dependence.
- Bundle tech + BPO for outcomes-based SLAs
- Measure productivity gains as sales metric
- Reduced FTE cost improves margin and retention
Policy shifts, ~64M/~86M enrollees; $42.45B BEAD; $10.93M breach cost
Provider margins remain thin—labor ~60% of costs and uncompensated care ~$60B (AHA 2022)—driving urgent demand for RCM automation and cash acceleration. Higher policy rates (~5.33% mid‑2025) and loan spreads (7–9%) favor opex SaaS and outcome pricing; financing and ROI guarantees shorten sales cycles. MA enrollment ~32M (2024) and 70%+ Medicaid managed care increase claim variability, raising value of payer‑specific rules and analytics.
| Metric | Value |
|---|---|
| Labor % of costs | ~60% |
| Fed funds (mid‑2025) | ~5.33% |
Preview the Actual Deliverable
Waystar PESTLE Analysis
The preview shown here is the exact Waystar PESTLE Analysis document you’ll receive after purchase—fully formatted and ready to use. Everything displayed is final content and structure, with no placeholders or teasers. After payment you’ll instantly download this exact, professionally structured file.
Original: $10.00
-65%$10.00
$3.50Description
Your Competitive Advantage Starts with This Report
Our PESTLE Analysis of Waystar reveals how political shifts, reimbursement trends, and rapid healthcare tech advances shape its growth and risks; ideal for investors and strategists needing clarity. Purchase the full report to access detailed, actionable insights and ready-to-use charts for immediate decision-making.
Political factors
US health policy shifts
Shifts in US health policy—notably Medicare (about 64 million beneficiaries) and Medicaid/CHIP (roughly 86 million enrollees in 2024)—directly alter provider cash flows and demand for Waystar’s revenue-cycle platform. Election cycles can swing priorities between cost containment and access expansion, changing reimbursement rules and utilization. Waystar must invest in continuous policy surveillance and rapid product updates; proactive lobbying and payer-provider coalitions can blunt adverse rule impacts.
Interoperability mandates
ONC and CMS 2020 rules (Cures Act implementations) mandate FHIR-based APIs and data-sharing, forcing product roadmaps toward real-time exchange; over 90% of US hospitals use certified EHRs, making integrations essential. Compliance creates competitive advantage by enabling seamless EHR and payer connections, while non-compliance risks exclusion from major networks and contracts. Waystar should invest in standards leadership and certification readiness.
Government funding & incentives
Federal and state grants can catalyze provider upgrades; BEAD's $42.45 billion broadband fund expands rural connectivity and creates health IT opportunities. Public health priorities like rural access and Medicaid (about 80 million enrollees) drive targeted procurements. Waystar can map products to funded programs to accelerate adoption and use quantified ROI metrics to help providers secure budget approvals.
Data sovereignty & localization
Data sovereignty rules increasingly require PHI to be stored or controlled locally in some jurisdictions; by 2024 over 70 countries had data localization measures. This shifts cloud architecture, vendor selection, and cross-border flows, pushing Waystar toward regional data hubs and contractual safeguards. IBM reports the 2024 average cost of a healthcare breach was $10.93M, highlighting compliance stakes. Early alignment lowers sales friction and remediation expenses.
- Impact: local storage mandates in 70+ countries
- Action: build regional hubs and strict vendor SLAs
- Risk: $10.93M average healthcare breach cost (IBM 2024)
- Benefit: fewer sales obstacles, lower compliance spend
Public-private payment reforms
Policy shifts, ~64M/~86M enrollees; $42.45B BEAD; $10.93M breach cost
US policy shifts (Medicare ~64M, Medicaid/CHIP ~86M) and Cures Act/FHIR mandates force Waystar to adapt product roadmaps; BEAD $42.45B broadband funding and >70 countries with localization rules create regional infrastructure needs; 2024 average healthcare breach cost $10.93M raises compliance stakes; value-based and transparency reforms increase demand for configurable rule engines.
| Factor | Metric |
|---|---|
| Medicare | ~64M beneficiaries |
| Medicaid/CHIP | ~86M enrollees |
| BEAD fund | $42.45B |
| Data localization | 70+ countries |
| Breach cost (2024) | $10.93M |
What is included in the product
Detailed Word Document
Explores how macro-environmental factors uniquely affect Waystar across Political, Economic, Social, Technological, Environmental and Legal dimensions, with data-backed trends and industry-specific sub-points; designed for executives and investors, reflecting current market and regulatory dynamics and offering forward-looking insights for strategy, risk mitigation and funding readiness.
Customizable Excel Spreadsheet
Waystar PESTLE Analysis provides a clean, visually segmented summary of external risks and market drivers, easily dropped into presentations or shared across teams, with editable notes for region-specific context to streamline planning and stakeholder alignment.
Economic factors
Provider margin pressure
Hospitals and physician groups facing thin margins—with labor typically ~60% of operating costs and uncompensated care near $60 billion nationally (AHA, 2022)—prioritize cash acceleration and cost reduction, boosting demand for RCM automation and denial prevention. Vendors must demonstrate fast payback and measurable yield lifts; tiered offerings align with varied provider solvency profiles and capital constraints.
Interest rates & capital access
Higher U.S. policy rates (effective federal funds ~5.33% mid‑2025) and commercial loan spreads (~7–9%) constrain provider CapEx and lengthen sales cycles, making opex‑friendly SaaS and outcome‑based pricing more attractive; Waystar can counter with financing programs, modular deployments and ROI guarantees to shorten buy cycles. A later lower‑rate cycle would likely reopen upsell pathways for advanced analytics as IT spend rebounds.
Payer mix & reimbursement trends
Shifts toward Medicare Advantage—enrollment ~32 million in 2024, roughly 55–58% of Medicare beneficiaries—and widespread Medicaid managed care (~70%+ enrollees) are altering denial patterns and payment timing, increasing claim variability. Growing contract complexity raises the value of comprehensive rules libraries and direct payer connectivity. Waystar must continuously refresh payer-specific edits and use analytics on underpayments to strengthen clients’ renegotiation leverage.
Industry consolidation
Industry consolidation in 2024 accelerated platform rationalization as large health systems and physician aggregators standardized tech stacks, allowing winners to lock enterprise-wide contracts while smaller vendors face displacement; healthcare M&A deal value exceeded $120B globally in 2024, amplifying scale advantages. Waystar must deliver scalable implementation playbooks and migration tooling to convert rollups into long-term customers. Robust partner ecosystems can defend share during platform swaps by offering integration continuity and migration services.
Labor constraints & outsourcing
RCM staffing shortages are accelerating demand for automation and managed services as providers seek to cut back-office overload; McKinsey 2024 estimates automation can reduce administrative costs by up to 40%, enabling bots and AI triage to replace repetitive tasks and lower FTE dependence.
- Bundle tech + BPO for outcomes-based SLAs
- Measure productivity gains as sales metric
- Reduced FTE cost improves margin and retention
Policy shifts, ~64M/~86M enrollees; $42.45B BEAD; $10.93M breach cost
Provider margins remain thin—labor ~60% of costs and uncompensated care ~$60B (AHA 2022)—driving urgent demand for RCM automation and cash acceleration. Higher policy rates (~5.33% mid‑2025) and loan spreads (7–9%) favor opex SaaS and outcome pricing; financing and ROI guarantees shorten sales cycles. MA enrollment ~32M (2024) and 70%+ Medicaid managed care increase claim variability, raising value of payer‑specific rules and analytics.
| Metric | Value |
|---|---|
| Labor % of costs | ~60% |
| Fed funds (mid‑2025) | ~5.33% |
Preview the Actual Deliverable
Waystar PESTLE Analysis
The preview shown here is the exact Waystar PESTLE Analysis document you’ll receive after purchase—fully formatted and ready to use. Everything displayed is final content and structure, with no placeholders or teasers. After payment you’ll instantly download this exact, professionally structured file.











