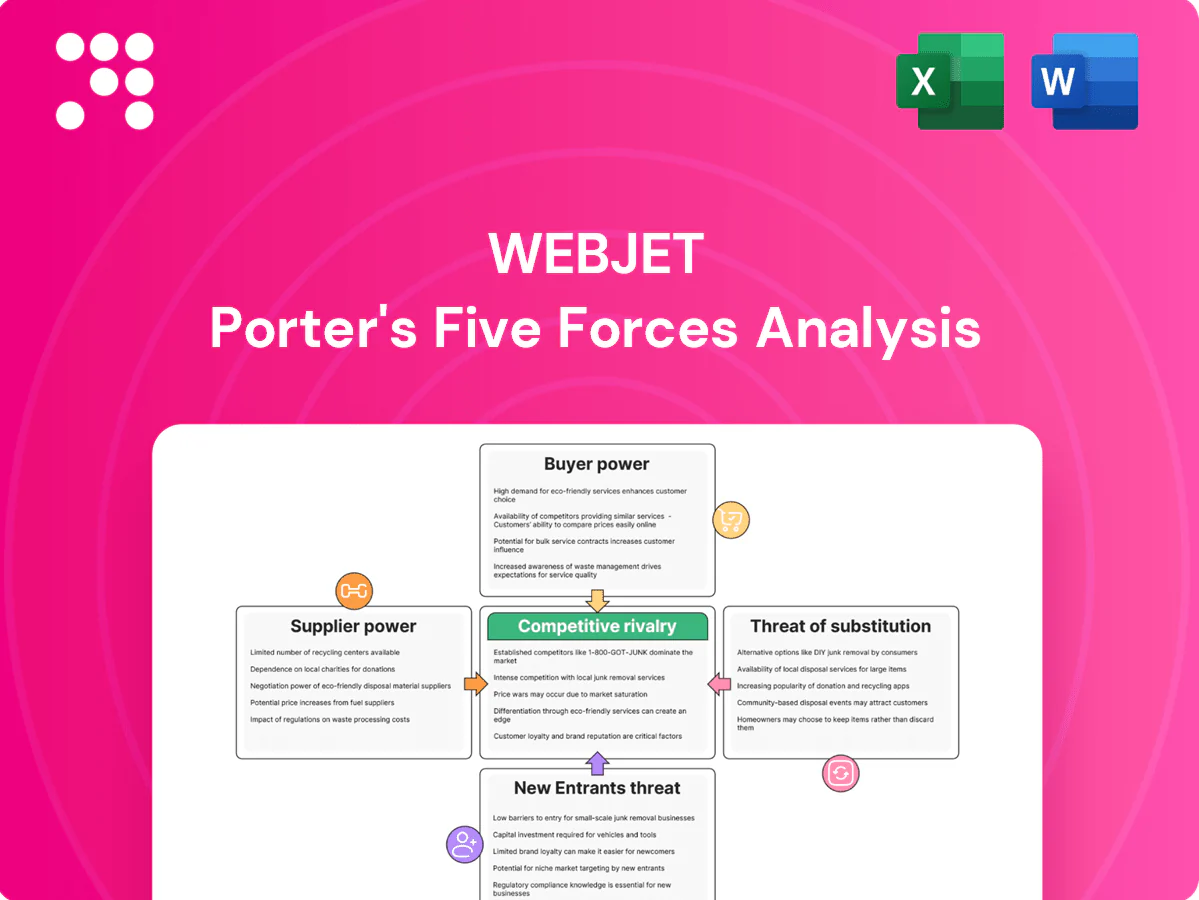
Webjet Porter's Five Forces Analysis

A Must-Have Tool for Decision-Makers
Webjet faces intense supplier and buyer dynamics, moderate threat from substitutes, and high rivalry shaped by pricing and distribution scale. This snapshot highlights key competitive pressures and strategic levers for growth. Unlock the full Porter's Five Forces Analysis to explore Webjet’s market forces and actionable recommendations.
Suppliers Bargaining Power

Airlines’ capacity and fare control
Airlines control seat inventory, schedules and fare classes, directly shaping OTAs margins; Qantas Group supplied roughly 70% of Australian domestic capacity in 2024, concentrating leverage on key ANZ routes. Consolidation and capacity discipline have supported higher yields while NDC adoption—over 100 airlines certified by 2024—reshapes content access and fee models. Fuel-price volatility and crew/airport strikes in 2023–24 tightened supply, reducing discounting latitude.
Hotel chains and independent properties
For WebBeds hotels are the primary inventory suppliers and large chains wield increasing leverage: Marriott (≈8,500 hotels, ~1.5M rooms in 2024) and Hilton (≈7,100 hotels in 2024) can demand tighter rate parity and allocations across wholesalers. Independents provide breadth but are highly fragmented, diluting average supplier power. During peak seasons or in concentrated destinations supplier power spikes, pressuring margins and availability for wholesalers.

Global distribution systems and tech pipes
GDSs and connectivity providers (Amadeus, Sabre, Travelport) mediate flight/hotel content and impose fees typically $3–10 per booking and technical constraints that affect margins. Reliance on proprietary APIs and switching costs creates supplier leverage; NDC/caching and real‑time availability upgrades often require $50k–$300k investments, creating lock‑in. Outages or policy changes can cut conversion rates by up to 15–25% and raise distribution costs materially.

Payment, fraud, and insurance partners
Payment gateways, BNPL providers and insurers materially shape Webjet economics: typical gateway fees 0.2–3% and BNPL merchant fees 1–6% compress take rates while industry chargeback rates (~0.5–1% in 2024) raise liability. Volume-based pricing offers counter-leverage but AML/KYC and PCI demands increase dependence; cross-border settlement and FX spreads (0.5–2%) magnify B2B supplier impact; strict partner risk rules can cut approval rates.
- Fees: gateway 0.2–3%
- BNPL: 1–6% fees
- Chargebacks: ~0.5–1% (2024)
- FX/spreads: 0.5–2%
- Compliance raises supplier dependence
Destination and regulatory stakeholders
Destination and regulatory stakeholders — airports, tourism bodies and local regulators — determine capacity, fees and compliance that flow directly into Webjet’s cost base; Airports Council International estimated 2024 passenger traffic recovered to about 96% of 2019 levels, tightening slot availability at key hubs. Taxes, surcharges and licensing terms (often passed to consumers) compress price competitiveness while visa and border policy shifts reallocate demand and inventory needs, reinforcing suppliers’ pricing leverage.
- Airports: slot scarcity at major hubs raises distribution costs
- Regulators: taxes and surcharges directly affect retail fares
- Visa/border changes: alter seasonality and inventory utilization
Airline concentration, NDC shift and booking/payment fees squeeze travel margins
Airlines (Qantas ≈70% AU domestic 2024) and consolidated hotel chains concentrate supply leverage, while NDC adoption (100+ airlines certified by 2024) shifts fee and access dynamics. GDS/connectivity fees ($3–10/booking) and integration costs ($50k–$300k) create lock‑in; payment fees (gateway 0.2–3%, BNPL 1–6%) plus chargebacks (~0.5–1%) compress margins. Airports/regulators (passenger traffic ≈96% of 2019 in 2024) tighten slots and surcharges.
| Supplier | Metric (2024) |
|---|---|
| Airlines | Qantas ~70% AU domestic |
| NDC | 100+ airlines certified |
| GDS | $3–10/booking |
| Payments | Gateway 0.2–3%; BNPL 1–6% |
| Airports | Traffic ~96% of 2019 |
What is included in the product
 Detailed Word Document
Comprehensive Porter's Five Forces analysis tailored to Webjet that uncovers competitive drivers, buyer and supplier leverage, substitutes and disruptive threats, entry barriers protecting incumbents, and strategic implications for pricing and profitability—fully editable for reports and presentations.

 Customizable Excel Spreadsheet
A one-sheet Porter's Five Forces for Webjet—quickly visualize competitive pressure with customizable scores and radar chart, copy-ready for decks, no macros, and easy swapping of data to model scenarios (new entrants, regulation) for faster strategic decisions.
Customers Bargaining Power

Price-transparent retail consumers
ANZ travelers compare prices across OTAs, metasearch and direct channels in real time, with 2024 surveys showing over 70% routinely shop multiple sources; low switching costs make fee sensitivity high and loyalty fragile. Promotions, coupons and free cancellations materially sway bookings, often flipping decisions within minutes. Customer reviews and UX friction quickly shift demand, amplifying price transparency and bargaining power.
B2B agents and tour operators
B2B agents and tour operators buy at scale from WebBeds and leverage rebates, extended payment terms and tighter service-level demands to lower effective rates. Multi-homing across bedbanks amplifies their bargaining power, enabling rapid switching if allocations or pricing lag. SLAs and allocation guarantees directly link pricing to measurable performance metrics, while consolidated agencies can push for exclusives or dynamic-rate arrangements tied to volume and sell-through.

Corporate and managed travel buyers
Policy-driven corporate and managed travel buyers prioritize reliability, reporting and duty-of-care over lowest fare, leveraging collective volume to secure tailored content and 24/7 support; by 2024 global business travel was reported at roughly 90% of 2019 levels, amplifying buyer leverage. Integration with OBT/TMC platforms is a prerequisite, narrowing vendor options and increasing switching risk; service failures can drive rapid churn among large managed accounts.

Demand volatility and booking windows
Short booking windows let customers re-shop at scale, driving last-minute fare comparison and higher refund/change claims; post‑pandemic 2024 market behavior shows pronounced volatility and frequent requests for flexible terms, compressing Webjet margins and increasing working capital strain as cash refunds and deferred revenue rise.
- Short booking windows: accelerate re-shopping
- Macro shocks: abrupt volume shifts, higher flexibility demands
- Post‑pandemic expectations: free changes/refunds
- Financial impact: margin compression and working capital pressure
Loyalty ecosystems and bundles
Airline and hotel loyalty programs continue to steer customers to direct channels by offering points and perks; in 2024 global loyalty memberships exceeded 1 billion, intensifying competition for direct bookings. Buyers increasingly weigh status accrual against third-party price savings, while credit card partnerships and digital wallets in 2024 captured a larger share of travel transactions, threatening OTA margins. Webjet must offset this with its own rewards, BNPL options and compelling package value to retain share.
- Loyalty scale: 1+ billion members (2024)
- Buyer trade-off: status vs savings
- Payment pull: cards and wallets rising (2024)
- Webjet defensive levers: rewards, BNPL, package value
Multi-source shoppers >70%, loyalty and corporate rebound shift bookings
ANZ retail shoppers compare OTAs, metasearch and direct in real time, with 2024 surveys showing over 70% routinely shop multiple sources, raising price sensitivity and churn. B2B buyers multi-home across bedbanks, extracting rebates and terms; corporate travel recovered to ~90% of 2019 by 2024, boosting negotiation leverage. Loyalty programs exceeded 1 billion members in 2024, steering volume to direct channels.
| Metric | 2024 | Impact |
|---|---|---|
| Retail multi-source shoppers | >70% | High price sensitivity |
| Business travel recovery | ~90% of 2019 | Stronger B2B leverage |
| Loyalty memberships | >1 billion | Direct channel pull |
What You See Is What You Get
Webjet Porter's Five Forces Analysis
This preview shows the exact Webjet Porter's Five Forces Analysis you'll receive after purchase—no placeholders or samples. The file is fully formatted, professionally written, and ready for immediate download and use. What you see is precisely what you get.

A Must-Have Tool for Decision-Makers
Webjet faces intense supplier and buyer dynamics, moderate threat from substitutes, and high rivalry shaped by pricing and distribution scale. This snapshot highlights key competitive pressures and strategic levers for growth. Unlock the full Porter's Five Forces Analysis to explore Webjet’s market forces and actionable recommendations.
Suppliers Bargaining Power
Airlines’ capacity and fare control
Airlines control seat inventory, schedules and fare classes, directly shaping OTAs margins; Qantas Group supplied roughly 70% of Australian domestic capacity in 2024, concentrating leverage on key ANZ routes. Consolidation and capacity discipline have supported higher yields while NDC adoption—over 100 airlines certified by 2024—reshapes content access and fee models. Fuel-price volatility and crew/airport strikes in 2023–24 tightened supply, reducing discounting latitude.
Hotel chains and independent properties
For WebBeds hotels are the primary inventory suppliers and large chains wield increasing leverage: Marriott (≈8,500 hotels, ~1.5M rooms in 2024) and Hilton (≈7,100 hotels in 2024) can demand tighter rate parity and allocations across wholesalers. Independents provide breadth but are highly fragmented, diluting average supplier power. During peak seasons or in concentrated destinations supplier power spikes, pressuring margins and availability for wholesalers.
Global distribution systems and tech pipes
GDSs and connectivity providers (Amadeus, Sabre, Travelport) mediate flight/hotel content and impose fees typically $3–10 per booking and technical constraints that affect margins. Reliance on proprietary APIs and switching costs creates supplier leverage; NDC/caching and real‑time availability upgrades often require $50k–$300k investments, creating lock‑in. Outages or policy changes can cut conversion rates by up to 15–25% and raise distribution costs materially.
Payment, fraud, and insurance partners
Payment gateways, BNPL providers and insurers materially shape Webjet economics: typical gateway fees 0.2–3% and BNPL merchant fees 1–6% compress take rates while industry chargeback rates (~0.5–1% in 2024) raise liability. Volume-based pricing offers counter-leverage but AML/KYC and PCI demands increase dependence; cross-border settlement and FX spreads (0.5–2%) magnify B2B supplier impact; strict partner risk rules can cut approval rates.
- Fees: gateway 0.2–3%
- BNPL: 1–6% fees
- Chargebacks: ~0.5–1% (2024)
- FX/spreads: 0.5–2%
- Compliance raises supplier dependence
Destination and regulatory stakeholders
Destination and regulatory stakeholders — airports, tourism bodies and local regulators — determine capacity, fees and compliance that flow directly into Webjet’s cost base; Airports Council International estimated 2024 passenger traffic recovered to about 96% of 2019 levels, tightening slot availability at key hubs. Taxes, surcharges and licensing terms (often passed to consumers) compress price competitiveness while visa and border policy shifts reallocate demand and inventory needs, reinforcing suppliers’ pricing leverage.
- Airports: slot scarcity at major hubs raises distribution costs
- Regulators: taxes and surcharges directly affect retail fares
- Visa/border changes: alter seasonality and inventory utilization
Airline concentration, NDC shift and booking/payment fees squeeze travel margins
Airlines (Qantas ≈70% AU domestic 2024) and consolidated hotel chains concentrate supply leverage, while NDC adoption (100+ airlines certified by 2024) shifts fee and access dynamics. GDS/connectivity fees ($3–10/booking) and integration costs ($50k–$300k) create lock‑in; payment fees (gateway 0.2–3%, BNPL 1–6%) plus chargebacks (~0.5–1%) compress margins. Airports/regulators (passenger traffic ≈96% of 2019 in 2024) tighten slots and surcharges.
| Supplier | Metric (2024) |
|---|---|
| Airlines | Qantas ~70% AU domestic |
| NDC | 100+ airlines certified |
| GDS | $3–10/booking |
| Payments | Gateway 0.2–3%; BNPL 1–6% |
| Airports | Traffic ~96% of 2019 |
What is included in the product
Detailed Word Document
Comprehensive Porter's Five Forces analysis tailored to Webjet that uncovers competitive drivers, buyer and supplier leverage, substitutes and disruptive threats, entry barriers protecting incumbents, and strategic implications for pricing and profitability—fully editable for reports and presentations.
Customizable Excel Spreadsheet
A one-sheet Porter's Five Forces for Webjet—quickly visualize competitive pressure with customizable scores and radar chart, copy-ready for decks, no macros, and easy swapping of data to model scenarios (new entrants, regulation) for faster strategic decisions.
Customers Bargaining Power
Price-transparent retail consumers
ANZ travelers compare prices across OTAs, metasearch and direct channels in real time, with 2024 surveys showing over 70% routinely shop multiple sources; low switching costs make fee sensitivity high and loyalty fragile. Promotions, coupons and free cancellations materially sway bookings, often flipping decisions within minutes. Customer reviews and UX friction quickly shift demand, amplifying price transparency and bargaining power.
B2B agents and tour operators
B2B agents and tour operators buy at scale from WebBeds and leverage rebates, extended payment terms and tighter service-level demands to lower effective rates. Multi-homing across bedbanks amplifies their bargaining power, enabling rapid switching if allocations or pricing lag. SLAs and allocation guarantees directly link pricing to measurable performance metrics, while consolidated agencies can push for exclusives or dynamic-rate arrangements tied to volume and sell-through.
Corporate and managed travel buyers
Policy-driven corporate and managed travel buyers prioritize reliability, reporting and duty-of-care over lowest fare, leveraging collective volume to secure tailored content and 24/7 support; by 2024 global business travel was reported at roughly 90% of 2019 levels, amplifying buyer leverage. Integration with OBT/TMC platforms is a prerequisite, narrowing vendor options and increasing switching risk; service failures can drive rapid churn among large managed accounts.
Demand volatility and booking windows
Short booking windows let customers re-shop at scale, driving last-minute fare comparison and higher refund/change claims; post‑pandemic 2024 market behavior shows pronounced volatility and frequent requests for flexible terms, compressing Webjet margins and increasing working capital strain as cash refunds and deferred revenue rise.
- Short booking windows: accelerate re-shopping
- Macro shocks: abrupt volume shifts, higher flexibility demands
- Post‑pandemic expectations: free changes/refunds
- Financial impact: margin compression and working capital pressure
Loyalty ecosystems and bundles
Airline and hotel loyalty programs continue to steer customers to direct channels by offering points and perks; in 2024 global loyalty memberships exceeded 1 billion, intensifying competition for direct bookings. Buyers increasingly weigh status accrual against third-party price savings, while credit card partnerships and digital wallets in 2024 captured a larger share of travel transactions, threatening OTA margins. Webjet must offset this with its own rewards, BNPL options and compelling package value to retain share.
- Loyalty scale: 1+ billion members (2024)
- Buyer trade-off: status vs savings
- Payment pull: cards and wallets rising (2024)
- Webjet defensive levers: rewards, BNPL, package value
Multi-source shoppers >70%, loyalty and corporate rebound shift bookings
ANZ retail shoppers compare OTAs, metasearch and direct in real time, with 2024 surveys showing over 70% routinely shop multiple sources, raising price sensitivity and churn. B2B buyers multi-home across bedbanks, extracting rebates and terms; corporate travel recovered to ~90% of 2019 by 2024, boosting negotiation leverage. Loyalty programs exceeded 1 billion members in 2024, steering volume to direct channels.
| Metric | 2024 | Impact |
|---|---|---|
| Retail multi-source shoppers | >70% | High price sensitivity |
| Business travel recovery | ~90% of 2019 | Stronger B2B leverage |
| Loyalty memberships | >1 billion | Direct channel pull |
What You See Is What You Get
Webjet Porter's Five Forces Analysis
This preview shows the exact Webjet Porter's Five Forces Analysis you'll receive after purchase—no placeholders or samples. The file is fully formatted, professionally written, and ready for immediate download and use. What you see is precisely what you get.
Original: $10.00
-65%$10.00
$3.50Description
A Must-Have Tool for Decision-Makers
Webjet faces intense supplier and buyer dynamics, moderate threat from substitutes, and high rivalry shaped by pricing and distribution scale. This snapshot highlights key competitive pressures and strategic levers for growth. Unlock the full Porter's Five Forces Analysis to explore Webjet’s market forces and actionable recommendations.
Suppliers Bargaining Power
Airlines’ capacity and fare control
Airlines control seat inventory, schedules and fare classes, directly shaping OTAs margins; Qantas Group supplied roughly 70% of Australian domestic capacity in 2024, concentrating leverage on key ANZ routes. Consolidation and capacity discipline have supported higher yields while NDC adoption—over 100 airlines certified by 2024—reshapes content access and fee models. Fuel-price volatility and crew/airport strikes in 2023–24 tightened supply, reducing discounting latitude.
Hotel chains and independent properties
For WebBeds hotels are the primary inventory suppliers and large chains wield increasing leverage: Marriott (≈8,500 hotels, ~1.5M rooms in 2024) and Hilton (≈7,100 hotels in 2024) can demand tighter rate parity and allocations across wholesalers. Independents provide breadth but are highly fragmented, diluting average supplier power. During peak seasons or in concentrated destinations supplier power spikes, pressuring margins and availability for wholesalers.
Global distribution systems and tech pipes
GDSs and connectivity providers (Amadeus, Sabre, Travelport) mediate flight/hotel content and impose fees typically $3–10 per booking and technical constraints that affect margins. Reliance on proprietary APIs and switching costs creates supplier leverage; NDC/caching and real‑time availability upgrades often require $50k–$300k investments, creating lock‑in. Outages or policy changes can cut conversion rates by up to 15–25% and raise distribution costs materially.
Payment, fraud, and insurance partners
Payment gateways, BNPL providers and insurers materially shape Webjet economics: typical gateway fees 0.2–3% and BNPL merchant fees 1–6% compress take rates while industry chargeback rates (~0.5–1% in 2024) raise liability. Volume-based pricing offers counter-leverage but AML/KYC and PCI demands increase dependence; cross-border settlement and FX spreads (0.5–2%) magnify B2B supplier impact; strict partner risk rules can cut approval rates.
- Fees: gateway 0.2–3%
- BNPL: 1–6% fees
- Chargebacks: ~0.5–1% (2024)
- FX/spreads: 0.5–2%
- Compliance raises supplier dependence
Destination and regulatory stakeholders
Destination and regulatory stakeholders — airports, tourism bodies and local regulators — determine capacity, fees and compliance that flow directly into Webjet’s cost base; Airports Council International estimated 2024 passenger traffic recovered to about 96% of 2019 levels, tightening slot availability at key hubs. Taxes, surcharges and licensing terms (often passed to consumers) compress price competitiveness while visa and border policy shifts reallocate demand and inventory needs, reinforcing suppliers’ pricing leverage.
- Airports: slot scarcity at major hubs raises distribution costs
- Regulators: taxes and surcharges directly affect retail fares
- Visa/border changes: alter seasonality and inventory utilization
Airline concentration, NDC shift and booking/payment fees squeeze travel margins
Airlines (Qantas ≈70% AU domestic 2024) and consolidated hotel chains concentrate supply leverage, while NDC adoption (100+ airlines certified by 2024) shifts fee and access dynamics. GDS/connectivity fees ($3–10/booking) and integration costs ($50k–$300k) create lock‑in; payment fees (gateway 0.2–3%, BNPL 1–6%) plus chargebacks (~0.5–1%) compress margins. Airports/regulators (passenger traffic ≈96% of 2019 in 2024) tighten slots and surcharges.
| Supplier | Metric (2024) |
|---|---|
| Airlines | Qantas ~70% AU domestic |
| NDC | 100+ airlines certified |
| GDS | $3–10/booking |
| Payments | Gateway 0.2–3%; BNPL 1–6% |
| Airports | Traffic ~96% of 2019 |
What is included in the product
Detailed Word Document
Comprehensive Porter's Five Forces analysis tailored to Webjet that uncovers competitive drivers, buyer and supplier leverage, substitutes and disruptive threats, entry barriers protecting incumbents, and strategic implications for pricing and profitability—fully editable for reports and presentations.
Customizable Excel Spreadsheet
A one-sheet Porter's Five Forces for Webjet—quickly visualize competitive pressure with customizable scores and radar chart, copy-ready for decks, no macros, and easy swapping of data to model scenarios (new entrants, regulation) for faster strategic decisions.
Customers Bargaining Power
Price-transparent retail consumers
ANZ travelers compare prices across OTAs, metasearch and direct channels in real time, with 2024 surveys showing over 70% routinely shop multiple sources; low switching costs make fee sensitivity high and loyalty fragile. Promotions, coupons and free cancellations materially sway bookings, often flipping decisions within minutes. Customer reviews and UX friction quickly shift demand, amplifying price transparency and bargaining power.
B2B agents and tour operators
B2B agents and tour operators buy at scale from WebBeds and leverage rebates, extended payment terms and tighter service-level demands to lower effective rates. Multi-homing across bedbanks amplifies their bargaining power, enabling rapid switching if allocations or pricing lag. SLAs and allocation guarantees directly link pricing to measurable performance metrics, while consolidated agencies can push for exclusives or dynamic-rate arrangements tied to volume and sell-through.
Corporate and managed travel buyers
Policy-driven corporate and managed travel buyers prioritize reliability, reporting and duty-of-care over lowest fare, leveraging collective volume to secure tailored content and 24/7 support; by 2024 global business travel was reported at roughly 90% of 2019 levels, amplifying buyer leverage. Integration with OBT/TMC platforms is a prerequisite, narrowing vendor options and increasing switching risk; service failures can drive rapid churn among large managed accounts.
Demand volatility and booking windows
Short booking windows let customers re-shop at scale, driving last-minute fare comparison and higher refund/change claims; post‑pandemic 2024 market behavior shows pronounced volatility and frequent requests for flexible terms, compressing Webjet margins and increasing working capital strain as cash refunds and deferred revenue rise.
- Short booking windows: accelerate re-shopping
- Macro shocks: abrupt volume shifts, higher flexibility demands
- Post‑pandemic expectations: free changes/refunds
- Financial impact: margin compression and working capital pressure
Loyalty ecosystems and bundles
Airline and hotel loyalty programs continue to steer customers to direct channels by offering points and perks; in 2024 global loyalty memberships exceeded 1 billion, intensifying competition for direct bookings. Buyers increasingly weigh status accrual against third-party price savings, while credit card partnerships and digital wallets in 2024 captured a larger share of travel transactions, threatening OTA margins. Webjet must offset this with its own rewards, BNPL options and compelling package value to retain share.
- Loyalty scale: 1+ billion members (2024)
- Buyer trade-off: status vs savings
- Payment pull: cards and wallets rising (2024)
- Webjet defensive levers: rewards, BNPL, package value
Multi-source shoppers >70%, loyalty and corporate rebound shift bookings
ANZ retail shoppers compare OTAs, metasearch and direct in real time, with 2024 surveys showing over 70% routinely shop multiple sources, raising price sensitivity and churn. B2B buyers multi-home across bedbanks, extracting rebates and terms; corporate travel recovered to ~90% of 2019 by 2024, boosting negotiation leverage. Loyalty programs exceeded 1 billion members in 2024, steering volume to direct channels.
| Metric | 2024 | Impact |
|---|---|---|
| Retail multi-source shoppers | >70% | High price sensitivity |
| Business travel recovery | ~90% of 2019 | Stronger B2B leverage |
| Loyalty memberships | >1 billion | Direct channel pull |
What You See Is What You Get
Webjet Porter's Five Forces Analysis
This preview shows the exact Webjet Porter's Five Forces Analysis you'll receive after purchase—no placeholders or samples. The file is fully formatted, professionally written, and ready for immediate download and use. What you see is precisely what you get.











