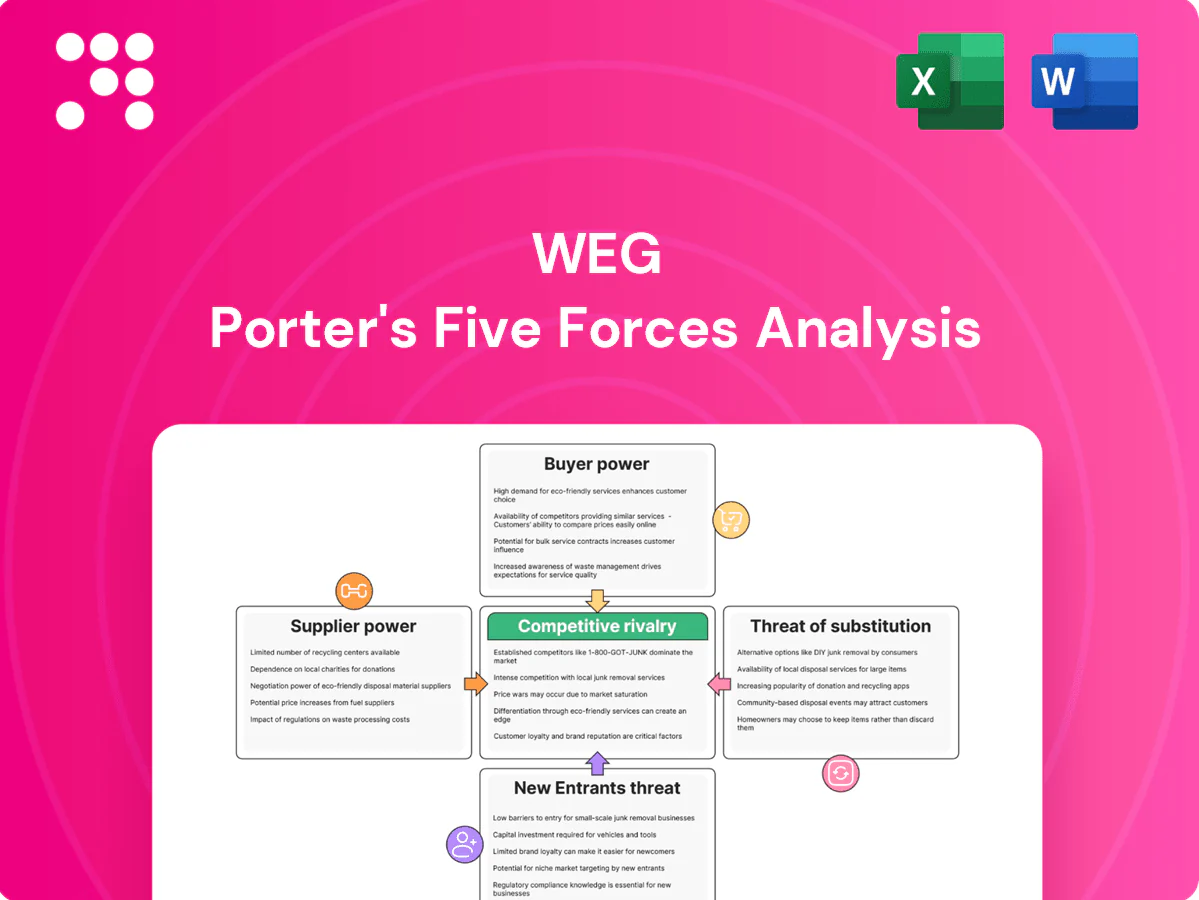
WEG Porter's Five Forces Analysis

Elevate Your Analysis with the Complete Porter's Five Forces Analysis
WEG faces varied competitive forces—strong buyer and supplier considerations, moderate threat of substitutes, and steady rivalry shaped by scale and technology; barriers to entry are significant but evolving with localization and innovation. This brief snapshot only scratches the surface. Unlock the full Porter's Five Forces Analysis to explore WEG’s competitive dynamics, market pressures, and strategic advantages in detail.
Suppliers Bargaining Power

Critical raw materials concentration
WEG relies on copper, electrical steel, aluminum and specialty resins supplied by a concentrated global base; Chile and Peru supplied roughly 40% of global copper mine output in 2024 and China produced about 55% of primary aluminum in 2024, magnifying supplier leverage. Price volatility and allocation during upcycles can squeeze margins and disrupt delivery; long-term contracts and hedging reduce but do not eliminate exposure. Any supply shock feeds directly into motors, transformers and generator cost stacks.
Power electronics and semiconductors
As of 2024, drives and converters depend on limited-tier IGBT, MOSFET and control-chip vendors, with allocation favoring large OEMs via strategic agreements. IGBT lead times have spiked into the 12–24 week range during node-specific shortages, delaying project fulfillment and raising working capital needs. WEG’s scale improves supplier access but cannot fully negate bottlenecks at specific process nodes.

Specialized components and tooling
Precision bearings, insulation systems and transformer cores need certified suppliers, with qualification cycles commonly 6–12 months, creating switching frictions that raise supplier leverage. Dual-sourcing is feasible but typically adds 3–9 months for compliance and performance testing. This heightens dependency in high-spec product lines, concentrating risk and cost with key suppliers.

Logistics and regionalization
- 12 countries production (2024)
- 135+ markets presence (2024)
- High local supplier leverage where alternatives limited
- Regional content rules limit sourcing flexibility
- Multi-region procurement mitigates supplier power
ESG and compliance requirements
Rising ESG, traceability, and conflict-mineral standards have narrowed WEG’s approved vendor pool, concentrating orders with a smaller set of compliant suppliers and increasing their bargaining power.
WEG’s brand demands and supplier audits force investment or exit, elevating short-term input prices and delivery risk as noncompliant vendors drop out and compliant suppliers capture more volume.
- Compliance-driven supplier consolidation
- Higher supplier pricing power
- Increased audit-driven capex for suppliers
- Short-term delivery and cost risk
Concentrated metals and IGBT shortages raise costs; multi-region sourcing mitigates risk
WEG faces concentrated inputs: Chile/Peru ~40% of copper supply (2024) and China ~55% of primary aluminum (2024), raising supplier leverage. IGBT/MOSFET shortages pushed lead times to 12–24 weeks in 2024, stalling deliveries. Qualification cycles (6–12 months) and ESG compliance shrink approved vendor pools, increasing prices and switching costs. Multi-region sourcing and local development partially mitigate risk.
| Metric | 2024 |
|---|---|
| Copper share (Chile+Peru) | ~40% |
| Primary aluminum (China) | ~55% |
| IGBT lead times | 12–24 wks |
| Production footprint | 12 countries |
| Markets | 135+ |
What is included in the product
 Detailed Word Document
Comprehensive Porter's Five Forces analysis tailored to WEG, uncovering competitive rivalry, supplier and buyer power, threat of new entrants and substitutes, and identifying disruptive forces and market entry barriers to inform pricing, profitability and strategic action—delivered in fully editable Word format for reports, investor decks, or strategy use.

 Customizable Excel Spreadsheet
A concise one-sheet WEG Porter's Five Forces that visualizes competitive pressure in a radar chart for quick strategic decisions; customize force levels, swap in your own data, and export deck-ready visuals—no macros or finance expertise required.
Customers Bargaining Power

Large industrial and utility buyers
Utilities, EPCs and global OEMs place recurrent, sizable orders and run competitive tenders—in 2024 WEG reported robust project-driven demand with consolidated net revenue near R$30 billion, reflecting large buyer influence on volumes and pricing.
Their scale forces tougher price, warranty and service terms and framework agreements commonly compress margins on commoditized SKUs by double-digit percentage points.
Negotiation strength weakens when projects require customized, certified solutions, where technical differentiation and certification premiums preserve higher margins.
Product standardization vs customization
Commodity motors and basic transformers, which make up the bulk of global shipments in the roughly USD 90 billion electric motor/transformer market, are highly comparable across brands, increasing buyer leverage. Customized high-efficiency systems and engineered packages, often commanding 10–30% price premiums, reduce direct comparability. Integration with drives, automation and long-term service contracts lowers substitutability and shifts purchasing toward lifecycle-cost decisions.

Switching costs and installed base
Compatibility, certification, and an extensive spares ecosystem around WEG products create material switching frictions tied to an installed base exceeding 10 million units worldwide, strengthening lock‑in. Service contracts and local WEG support networks further reduce buyer power, with recurring service revenue cushioning margins. Still, many industrial buyers maintain dual sourcing—common in heavy industry—so price pressure remains moderated but persistent.

Project cyclicality and demand timing
When capex slows buyers delay or batch orders to extract price and payment concessions, while in upcycles stretched lead times let WEG and peers secure higher prices; these cyclical swings materially affect tender outcomes. WEG’s backlog and active mix management partially smooth volatility by shifting toward services and higher-margin segments, but tender-driven markets still see pronounced bargaining swings.
- cyclical order batching
- lead-time pricing power
- backlog smoothing
- tender sensitivity
Total cost of ownership focus
Buyers focus on total cost of ownership, weighing efficiency, reliability and downtime costs alongside price; IE4 motors can cut energy use by up to 30% vs IE2, turning lifecycle savings into a willingness to pay premiums. WEG’s global service network in 140+ countries and documented response times reduce downtime risk, and strong performance data shifts leverage away from pure price; lacking differentiation, buyers default to lowest-bid dynamics.
- Efficiency: IE4 ≈ up to 30% energy savings
- Service: WEG in 140+ countries improves uptime
- Pricing: strong ROI data enables premiums
- Risk: no differentiation → lowest-bid wins
Tenders raise buyer leverage; IE4-certified motors can cut energy use by up to 30%
Large utilities, EPCs and OEM tenders give buyers strong price and service leverage—2024 WEG net revenue ≈ R$30bn and global motor/transformer market ≈ USD90bn. Commodities face toughest pressure; customized, certified solutions and IE4 efficiency (≈ up to 30% energy savings) and WEG’s 10M+ installed base and 140+ country service network reduce buyer power.
| Metric | Value |
|---|---|
| WEG 2024 net revenue | R$30bn |
| Market size | ≈ USD90bn |
| Installed base | >10M units |
| Service footprint | 140+ countries |
| IE4 energy savings | up to 30% |
Same Document Delivered
WEG Porter's Five Forces Analysis
This preview shows the exact WEG Porter’s Five Forces analysis you’ll receive—no surprises or placeholders. It covers competitive rivalry, supplier and buyer power, threat of substitutes, and entry barriers in full. Once purchased, you’ll get this same professionally formatted file instantly. It’s ready for immediate use in decision-making or reporting.

Elevate Your Analysis with the Complete Porter's Five Forces Analysis
WEG faces varied competitive forces—strong buyer and supplier considerations, moderate threat of substitutes, and steady rivalry shaped by scale and technology; barriers to entry are significant but evolving with localization and innovation. This brief snapshot only scratches the surface. Unlock the full Porter's Five Forces Analysis to explore WEG’s competitive dynamics, market pressures, and strategic advantages in detail.
Suppliers Bargaining Power
Critical raw materials concentration
WEG relies on copper, electrical steel, aluminum and specialty resins supplied by a concentrated global base; Chile and Peru supplied roughly 40% of global copper mine output in 2024 and China produced about 55% of primary aluminum in 2024, magnifying supplier leverage. Price volatility and allocation during upcycles can squeeze margins and disrupt delivery; long-term contracts and hedging reduce but do not eliminate exposure. Any supply shock feeds directly into motors, transformers and generator cost stacks.
Power electronics and semiconductors
As of 2024, drives and converters depend on limited-tier IGBT, MOSFET and control-chip vendors, with allocation favoring large OEMs via strategic agreements. IGBT lead times have spiked into the 12–24 week range during node-specific shortages, delaying project fulfillment and raising working capital needs. WEG’s scale improves supplier access but cannot fully negate bottlenecks at specific process nodes.
Specialized components and tooling
Precision bearings, insulation systems and transformer cores need certified suppliers, with qualification cycles commonly 6–12 months, creating switching frictions that raise supplier leverage. Dual-sourcing is feasible but typically adds 3–9 months for compliance and performance testing. This heightens dependency in high-spec product lines, concentrating risk and cost with key suppliers.
Logistics and regionalization
- 12 countries production (2024)
- 135+ markets presence (2024)
- High local supplier leverage where alternatives limited
- Regional content rules limit sourcing flexibility
- Multi-region procurement mitigates supplier power
ESG and compliance requirements
Rising ESG, traceability, and conflict-mineral standards have narrowed WEG’s approved vendor pool, concentrating orders with a smaller set of compliant suppliers and increasing their bargaining power.
WEG’s brand demands and supplier audits force investment or exit, elevating short-term input prices and delivery risk as noncompliant vendors drop out and compliant suppliers capture more volume.
- Compliance-driven supplier consolidation
- Higher supplier pricing power
- Increased audit-driven capex for suppliers
- Short-term delivery and cost risk
Concentrated metals and IGBT shortages raise costs; multi-region sourcing mitigates risk
WEG faces concentrated inputs: Chile/Peru ~40% of copper supply (2024) and China ~55% of primary aluminum (2024), raising supplier leverage. IGBT/MOSFET shortages pushed lead times to 12–24 weeks in 2024, stalling deliveries. Qualification cycles (6–12 months) and ESG compliance shrink approved vendor pools, increasing prices and switching costs. Multi-region sourcing and local development partially mitigate risk.
| Metric | 2024 |
|---|---|
| Copper share (Chile+Peru) | ~40% |
| Primary aluminum (China) | ~55% |
| IGBT lead times | 12–24 wks |
| Production footprint | 12 countries |
| Markets | 135+ |
What is included in the product
Detailed Word Document
Comprehensive Porter's Five Forces analysis tailored to WEG, uncovering competitive rivalry, supplier and buyer power, threat of new entrants and substitutes, and identifying disruptive forces and market entry barriers to inform pricing, profitability and strategic action—delivered in fully editable Word format for reports, investor decks, or strategy use.
Customizable Excel Spreadsheet
A concise one-sheet WEG Porter's Five Forces that visualizes competitive pressure in a radar chart for quick strategic decisions; customize force levels, swap in your own data, and export deck-ready visuals—no macros or finance expertise required.
Customers Bargaining Power
Large industrial and utility buyers
Utilities, EPCs and global OEMs place recurrent, sizable orders and run competitive tenders—in 2024 WEG reported robust project-driven demand with consolidated net revenue near R$30 billion, reflecting large buyer influence on volumes and pricing.
Their scale forces tougher price, warranty and service terms and framework agreements commonly compress margins on commoditized SKUs by double-digit percentage points.
Negotiation strength weakens when projects require customized, certified solutions, where technical differentiation and certification premiums preserve higher margins.
Product standardization vs customization
Commodity motors and basic transformers, which make up the bulk of global shipments in the roughly USD 90 billion electric motor/transformer market, are highly comparable across brands, increasing buyer leverage. Customized high-efficiency systems and engineered packages, often commanding 10–30% price premiums, reduce direct comparability. Integration with drives, automation and long-term service contracts lowers substitutability and shifts purchasing toward lifecycle-cost decisions.
Switching costs and installed base
Compatibility, certification, and an extensive spares ecosystem around WEG products create material switching frictions tied to an installed base exceeding 10 million units worldwide, strengthening lock‑in. Service contracts and local WEG support networks further reduce buyer power, with recurring service revenue cushioning margins. Still, many industrial buyers maintain dual sourcing—common in heavy industry—so price pressure remains moderated but persistent.
Project cyclicality and demand timing
When capex slows buyers delay or batch orders to extract price and payment concessions, while in upcycles stretched lead times let WEG and peers secure higher prices; these cyclical swings materially affect tender outcomes. WEG’s backlog and active mix management partially smooth volatility by shifting toward services and higher-margin segments, but tender-driven markets still see pronounced bargaining swings.
- cyclical order batching
- lead-time pricing power
- backlog smoothing
- tender sensitivity
Total cost of ownership focus
Buyers focus on total cost of ownership, weighing efficiency, reliability and downtime costs alongside price; IE4 motors can cut energy use by up to 30% vs IE2, turning lifecycle savings into a willingness to pay premiums. WEG’s global service network in 140+ countries and documented response times reduce downtime risk, and strong performance data shifts leverage away from pure price; lacking differentiation, buyers default to lowest-bid dynamics.
- Efficiency: IE4 ≈ up to 30% energy savings
- Service: WEG in 140+ countries improves uptime
- Pricing: strong ROI data enables premiums
- Risk: no differentiation → lowest-bid wins
Tenders raise buyer leverage; IE4-certified motors can cut energy use by up to 30%
Large utilities, EPCs and OEM tenders give buyers strong price and service leverage—2024 WEG net revenue ≈ R$30bn and global motor/transformer market ≈ USD90bn. Commodities face toughest pressure; customized, certified solutions and IE4 efficiency (≈ up to 30% energy savings) and WEG’s 10M+ installed base and 140+ country service network reduce buyer power.
| Metric | Value |
|---|---|
| WEG 2024 net revenue | R$30bn |
| Market size | ≈ USD90bn |
| Installed base | >10M units |
| Service footprint | 140+ countries |
| IE4 energy savings | up to 30% |
Same Document Delivered
WEG Porter's Five Forces Analysis
This preview shows the exact WEG Porter’s Five Forces analysis you’ll receive—no surprises or placeholders. It covers competitive rivalry, supplier and buyer power, threat of substitutes, and entry barriers in full. Once purchased, you’ll get this same professionally formatted file instantly. It’s ready for immediate use in decision-making or reporting.
Description
Elevate Your Analysis with the Complete Porter's Five Forces Analysis
WEG faces varied competitive forces—strong buyer and supplier considerations, moderate threat of substitutes, and steady rivalry shaped by scale and technology; barriers to entry are significant but evolving with localization and innovation. This brief snapshot only scratches the surface. Unlock the full Porter's Five Forces Analysis to explore WEG’s competitive dynamics, market pressures, and strategic advantages in detail.
Suppliers Bargaining Power
Critical raw materials concentration
WEG relies on copper, electrical steel, aluminum and specialty resins supplied by a concentrated global base; Chile and Peru supplied roughly 40% of global copper mine output in 2024 and China produced about 55% of primary aluminum in 2024, magnifying supplier leverage. Price volatility and allocation during upcycles can squeeze margins and disrupt delivery; long-term contracts and hedging reduce but do not eliminate exposure. Any supply shock feeds directly into motors, transformers and generator cost stacks.
Power electronics and semiconductors
As of 2024, drives and converters depend on limited-tier IGBT, MOSFET and control-chip vendors, with allocation favoring large OEMs via strategic agreements. IGBT lead times have spiked into the 12–24 week range during node-specific shortages, delaying project fulfillment and raising working capital needs. WEG’s scale improves supplier access but cannot fully negate bottlenecks at specific process nodes.
Specialized components and tooling
Precision bearings, insulation systems and transformer cores need certified suppliers, with qualification cycles commonly 6–12 months, creating switching frictions that raise supplier leverage. Dual-sourcing is feasible but typically adds 3–9 months for compliance and performance testing. This heightens dependency in high-spec product lines, concentrating risk and cost with key suppliers.
Logistics and regionalization
- 12 countries production (2024)
- 135+ markets presence (2024)
- High local supplier leverage where alternatives limited
- Regional content rules limit sourcing flexibility
- Multi-region procurement mitigates supplier power
ESG and compliance requirements
Rising ESG, traceability, and conflict-mineral standards have narrowed WEG’s approved vendor pool, concentrating orders with a smaller set of compliant suppliers and increasing their bargaining power.
WEG’s brand demands and supplier audits force investment or exit, elevating short-term input prices and delivery risk as noncompliant vendors drop out and compliant suppliers capture more volume.
- Compliance-driven supplier consolidation
- Higher supplier pricing power
- Increased audit-driven capex for suppliers
- Short-term delivery and cost risk
Concentrated metals and IGBT shortages raise costs; multi-region sourcing mitigates risk
WEG faces concentrated inputs: Chile/Peru ~40% of copper supply (2024) and China ~55% of primary aluminum (2024), raising supplier leverage. IGBT/MOSFET shortages pushed lead times to 12–24 weeks in 2024, stalling deliveries. Qualification cycles (6–12 months) and ESG compliance shrink approved vendor pools, increasing prices and switching costs. Multi-region sourcing and local development partially mitigate risk.
| Metric | 2024 |
|---|---|
| Copper share (Chile+Peru) | ~40% |
| Primary aluminum (China) | ~55% |
| IGBT lead times | 12–24 wks |
| Production footprint | 12 countries |
| Markets | 135+ |
What is included in the product
Detailed Word Document
Comprehensive Porter's Five Forces analysis tailored to WEG, uncovering competitive rivalry, supplier and buyer power, threat of new entrants and substitutes, and identifying disruptive forces and market entry barriers to inform pricing, profitability and strategic action—delivered in fully editable Word format for reports, investor decks, or strategy use.
Customizable Excel Spreadsheet
A concise one-sheet WEG Porter's Five Forces that visualizes competitive pressure in a radar chart for quick strategic decisions; customize force levels, swap in your own data, and export deck-ready visuals—no macros or finance expertise required.
Customers Bargaining Power
Large industrial and utility buyers
Utilities, EPCs and global OEMs place recurrent, sizable orders and run competitive tenders—in 2024 WEG reported robust project-driven demand with consolidated net revenue near R$30 billion, reflecting large buyer influence on volumes and pricing.
Their scale forces tougher price, warranty and service terms and framework agreements commonly compress margins on commoditized SKUs by double-digit percentage points.
Negotiation strength weakens when projects require customized, certified solutions, where technical differentiation and certification premiums preserve higher margins.
Product standardization vs customization
Commodity motors and basic transformers, which make up the bulk of global shipments in the roughly USD 90 billion electric motor/transformer market, are highly comparable across brands, increasing buyer leverage. Customized high-efficiency systems and engineered packages, often commanding 10–30% price premiums, reduce direct comparability. Integration with drives, automation and long-term service contracts lowers substitutability and shifts purchasing toward lifecycle-cost decisions.
Switching costs and installed base
Compatibility, certification, and an extensive spares ecosystem around WEG products create material switching frictions tied to an installed base exceeding 10 million units worldwide, strengthening lock‑in. Service contracts and local WEG support networks further reduce buyer power, with recurring service revenue cushioning margins. Still, many industrial buyers maintain dual sourcing—common in heavy industry—so price pressure remains moderated but persistent.
Project cyclicality and demand timing
When capex slows buyers delay or batch orders to extract price and payment concessions, while in upcycles stretched lead times let WEG and peers secure higher prices; these cyclical swings materially affect tender outcomes. WEG’s backlog and active mix management partially smooth volatility by shifting toward services and higher-margin segments, but tender-driven markets still see pronounced bargaining swings.
- cyclical order batching
- lead-time pricing power
- backlog smoothing
- tender sensitivity
Total cost of ownership focus
Buyers focus on total cost of ownership, weighing efficiency, reliability and downtime costs alongside price; IE4 motors can cut energy use by up to 30% vs IE2, turning lifecycle savings into a willingness to pay premiums. WEG’s global service network in 140+ countries and documented response times reduce downtime risk, and strong performance data shifts leverage away from pure price; lacking differentiation, buyers default to lowest-bid dynamics.
- Efficiency: IE4 ≈ up to 30% energy savings
- Service: WEG in 140+ countries improves uptime
- Pricing: strong ROI data enables premiums
- Risk: no differentiation → lowest-bid wins
Tenders raise buyer leverage; IE4-certified motors can cut energy use by up to 30%
Large utilities, EPCs and OEM tenders give buyers strong price and service leverage—2024 WEG net revenue ≈ R$30bn and global motor/transformer market ≈ USD90bn. Commodities face toughest pressure; customized, certified solutions and IE4 efficiency (≈ up to 30% energy savings) and WEG’s 10M+ installed base and 140+ country service network reduce buyer power.
| Metric | Value |
|---|---|
| WEG 2024 net revenue | R$30bn |
| Market size | ≈ USD90bn |
| Installed base | >10M units |
| Service footprint | 140+ countries |
| IE4 energy savings | up to 30% |
Same Document Delivered
WEG Porter's Five Forces Analysis
This preview shows the exact WEG Porter’s Five Forces analysis you’ll receive—no surprises or placeholders. It covers competitive rivalry, supplier and buyer power, threat of substitutes, and entry barriers in full. Once purchased, you’ll get this same professionally formatted file instantly. It’s ready for immediate use in decision-making or reporting.











