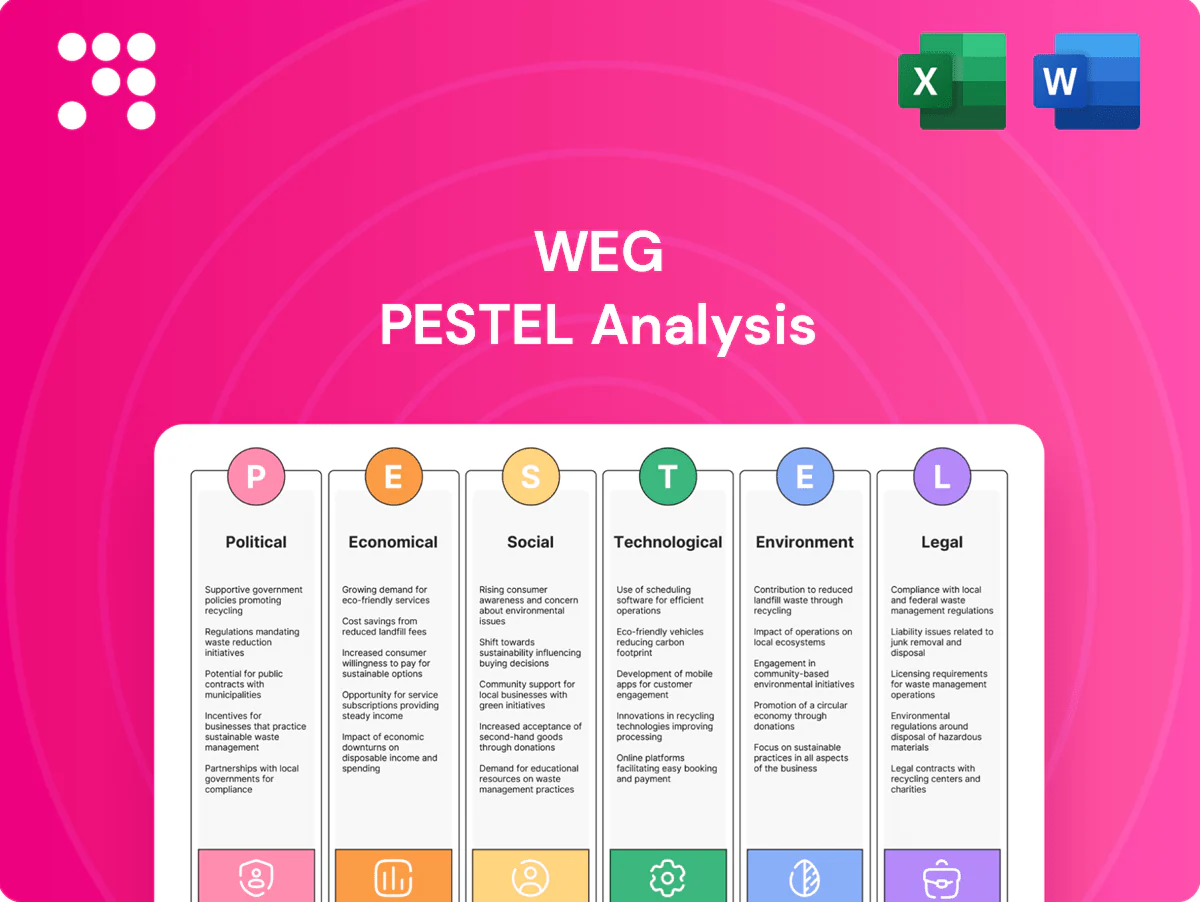
WEG PESTLE Analysis

Make Smarter Strategic Decisions with a Complete PESTEL View
Discover how political shifts, economic cycles, and green-tech trends are reshaping WEG’s strategic outlook in our concise PESTLE snapshot—perfect for investors and strategists seeking clarity fast. This analysis highlights regulatory risks, supply-chain pressures, and innovation opportunities you need to know. Purchase the full PESTLE for the complete, actionable breakdown and downloadable templates to use immediately.
Political factors

Industrial policy shifts
Changes in Brazil and key export markets’ industrial policies — where industry accounts for roughly 18% of Brazil’s GDP (2023) — can alter incentives for local manufacturing and content rules, affecting WEG’s sourcing and regional strategy. WEG’s capex and footprint decisions depend on subsidies, tax credits and procurement preferences for domestic producers; exports historically represent about 40% of WEG’s revenue mix. Policy continuity supports long-horizon investments in motors, transformers and grid projects, while abrupt shifts raise execution and stranded-asset risks.
Energy transition agendas
Governments' net-zero commitments, including Brazil's 2050 target, are driving public investment in renewables, grid expansion and electrification, expanding addressable demand for WEG products. Policy clarity on auctions and interconnection has accelerated project pipelines; global clean energy investment reached about $1.7 trillion in 2023 (IEA). Inconsistent timelines or rollbacks, however, can delay orders, while stable frameworks de-risk large-scale generation, transmission and industrial efficiency projects.

Trade tariffs and localization
Tariffs on electrical equipment and components—often reaching double digits in some emerging markets—raise WEGs input costs and force price adjustments that squeeze margins. Localization clauses in infrastructure tenders, frequently demanding up to 60% local content, shape where WEG manufactures and assembles, boosting regional CAPEX. WEGs multi-hub footprint of over 30 factories in about 14 countries improves export competitiveness under favorable trade deals and mitigates protectionist shocks.

Geopolitical supply risks
Geopolitical tensions raise delivery delays in metals, semiconductors and power electronics, with industry lead times swinging roughly 12–24 weeks across 2022–2024; sanctions on Russia and Iran complicate sales and EPC partnerships under US, EU and UK regimes. Diversified suppliers and dual-sourcing have proven to reduce single-source disruption, while proactive compliance screening preserves eligibility for global bids.
- Lead-time volatility: 12–24 weeks (2022–2024)
- Sanctions impact: Russia, Iran restrictions under US/EU/UK regimes
- Risk mitigation: dual-sourcing + compliance screening
Public procurement cycles
Public procurement cycles drive lumpiness in WEG orders as government budgets for transmission, distribution and infrastructure are released in tranches; election cycles shift spending toward visible projects like transport or social programs, affecting timing and mix. Strong local relationships and certifications increase tender win rates, while clearer pipeline visibility improves factory loading and working-capital planning.
- Procurement lumpiness: affects order timing
- Election shifts: alters sectoral spend
- Local ties: boost tender success
- Pipeline visibility: optimizes capacity & cash
Brazil policy, tariffs and 12-24 week lead times reshape exporters amid $1.7T clean-energy
Industrial policy shifts in Brazil (industry ~18% of GDP, 2023) and key markets affect WEG’s sourcing and capex; exports ~40% of revenue make trade rules critical. Net-zero commitments (Brazil 2050) and $1.7T global clean-energy spend (2023) expand demand but policy rollbacks delay orders. Tariffs/local-content (up to 60%) and 12–24 week lead-time volatility (2022–24) hinge regional footprint decisions.
| Metric | Value |
|---|---|
| Industry share (BR) | 18% (2023) |
| Exports of revenue | ~40% |
| Clean-energy spend | $1.7T (2023) |
| Factories/countries | 30/14 |
| Lead-time | 12–24 weeks |
What is included in the product
 Detailed Word Document
Explores how macro-environmental factors impact WEG across Political, Economic, Social, Technological, Environmental and Legal dimensions, each supported by current data and sector-specific examples; designed for executives, investors and consultants to identify threats, opportunities and inform proactive strategy and funding decisions.

 Customizable Excel Spreadsheet
A concise, clean summary of WEG's PESTLE analysis, visually segmented by category for quick interpretation and easily drop‑in ready for presentations to foster fast alignment across teams.
Economic factors

Capex cycles
Industrial capex cycles in mining, oil & gas and manufacturing drive demand for motors, drives and automation; WEG’s 2024 net revenue of BRL 35.1 billion shows sensitivity to these sectors. Downcycles defer upgrades and new installs, reducing short-term order intake, while upcycles shift spend to efficiency retrofits and capacity expansions that lift average selling prices. WEG’s diversified sector mix smooths volatility but cannot eliminate it.
FX and inflation
Currency swings (BRL ~5.10/USD in H1 2025) materially affect WEG’s export revenues, input costs and translation exposure, while Brazil’s headline inflation (~4.6% y/y mid-2025) raises materials and labor costs, pressuring margins absent agile pricing; WEG uses FX hedging and index-linked contracts to mitigate volatility and reports routine hedge programs covering a meaningful portion of export flows, and greater localization of suppliers has reduced sensitivity to imported-cost swings.

Commodity prices
Copper (~$9,000/t LME 2024), aluminum (~$2,300/t), HRC steel (~$800/t) and rare-earths (NdPr ~ $70/kg) drive BOM for WEG motors, transformers and generators, so price spikes force repricing or redesign to protect unit economics. Long-term supplier contracts offer partial insulation, while tight inventory turns and JIT inventory preserve cash flow and margin resilience.

Interest rates and credit
Rising rates increased customer WACC—global policy rates averaged ~3.5% in 2024, delaying grid and industrial projects and extending payback periods. Concessional energy-efficiency financing (0.5–2% below market) unlocked orders in Brazil and the EU in 2024. WEG's net debt/EBITDA ~0.6 (FY2024) enables vendor financing and competitive terms; regional credit spreads shape sales mix and timing.
- Higher WACC: delays capex
- Concessional finance: unlocks EE orders
- WEG balance sheet: enables vendor finance
- Regional credit: alters timing/mix
Global growth dispersion
Global demand dispersion sees Americas ~2.1% growth, EMEA ~1.2% and APAC ~4.5% (IMF July 2025), driving uneven factory utilization for WEG; slower EMEA activity can be offset by APAC infrastructure and renewables expansion. WEGs mix across T&D, renewables and industrial automation cushions regional cycles, while agile production shifts limit margin erosion.
- Regional growth tags: Americas 2.1%, EMEA 1.2%, APAC 4.5%
- Portfolio tag: T&D, Renewables, Automation
- Mitigation tag: agile capacity allocation
Brazil policy, tariffs and 12-24 week lead times reshape exporters amid $1.7T clean-energy
Industrial capex cycles, FX (BRL ~5.10/USD H1‑2025) and commodity swings (Cu $9,000/t, Al $2,300/t, NdPr $70/kg) drive WEG top‑line and margins; 2024 net revenue BRL 35.1bn and net debt/EBITDA 0.6 underpin vendor finance. Inflation ~4.6% mid‑2025 and higher WACC slow projects, while concessional finance and portfolio mix (T&D, renewables, automation) mitigate volatility.
| Metric | Value |
|---|---|
| 2024 revenue | BRL 35.1bn |
| BRL/USD H1‑2025 | ~5.10 |
| Inflation mid‑2025 | 4.6% |
| Net debt/EBITDA | 0.6 |
| IMF growth (2025) | Am 2.1% / EMEA 1.2% / APAC 4.5% |
Preview Before You Purchase
WEG PESTLE Analysis
The preview shown here is the exact WEG PESTLE Analysis document you’ll receive after purchase—fully formatted, professionally structured, and ready to use. No placeholders or surprises; this is the real file. The content and layout match the delivered download immediately after checkout.

Make Smarter Strategic Decisions with a Complete PESTEL View
Discover how political shifts, economic cycles, and green-tech trends are reshaping WEG’s strategic outlook in our concise PESTLE snapshot—perfect for investors and strategists seeking clarity fast. This analysis highlights regulatory risks, supply-chain pressures, and innovation opportunities you need to know. Purchase the full PESTLE for the complete, actionable breakdown and downloadable templates to use immediately.
Political factors
Industrial policy shifts
Changes in Brazil and key export markets’ industrial policies — where industry accounts for roughly 18% of Brazil’s GDP (2023) — can alter incentives for local manufacturing and content rules, affecting WEG’s sourcing and regional strategy. WEG’s capex and footprint decisions depend on subsidies, tax credits and procurement preferences for domestic producers; exports historically represent about 40% of WEG’s revenue mix. Policy continuity supports long-horizon investments in motors, transformers and grid projects, while abrupt shifts raise execution and stranded-asset risks.
Energy transition agendas
Governments' net-zero commitments, including Brazil's 2050 target, are driving public investment in renewables, grid expansion and electrification, expanding addressable demand for WEG products. Policy clarity on auctions and interconnection has accelerated project pipelines; global clean energy investment reached about $1.7 trillion in 2023 (IEA). Inconsistent timelines or rollbacks, however, can delay orders, while stable frameworks de-risk large-scale generation, transmission and industrial efficiency projects.
Trade tariffs and localization
Tariffs on electrical equipment and components—often reaching double digits in some emerging markets—raise WEGs input costs and force price adjustments that squeeze margins. Localization clauses in infrastructure tenders, frequently demanding up to 60% local content, shape where WEG manufactures and assembles, boosting regional CAPEX. WEGs multi-hub footprint of over 30 factories in about 14 countries improves export competitiveness under favorable trade deals and mitigates protectionist shocks.
Geopolitical supply risks
Geopolitical tensions raise delivery delays in metals, semiconductors and power electronics, with industry lead times swinging roughly 12–24 weeks across 2022–2024; sanctions on Russia and Iran complicate sales and EPC partnerships under US, EU and UK regimes. Diversified suppliers and dual-sourcing have proven to reduce single-source disruption, while proactive compliance screening preserves eligibility for global bids.
- Lead-time volatility: 12–24 weeks (2022–2024)
- Sanctions impact: Russia, Iran restrictions under US/EU/UK regimes
- Risk mitigation: dual-sourcing + compliance screening
Public procurement cycles
Public procurement cycles drive lumpiness in WEG orders as government budgets for transmission, distribution and infrastructure are released in tranches; election cycles shift spending toward visible projects like transport or social programs, affecting timing and mix. Strong local relationships and certifications increase tender win rates, while clearer pipeline visibility improves factory loading and working-capital planning.
- Procurement lumpiness: affects order timing
- Election shifts: alters sectoral spend
- Local ties: boost tender success
- Pipeline visibility: optimizes capacity & cash
Brazil policy, tariffs and 12-24 week lead times reshape exporters amid $1.7T clean-energy
Industrial policy shifts in Brazil (industry ~18% of GDP, 2023) and key markets affect WEG’s sourcing and capex; exports ~40% of revenue make trade rules critical. Net-zero commitments (Brazil 2050) and $1.7T global clean-energy spend (2023) expand demand but policy rollbacks delay orders. Tariffs/local-content (up to 60%) and 12–24 week lead-time volatility (2022–24) hinge regional footprint decisions.
| Metric | Value |
|---|---|
| Industry share (BR) | 18% (2023) |
| Exports of revenue | ~40% |
| Clean-energy spend | $1.7T (2023) |
| Factories/countries | 30/14 |
| Lead-time | 12–24 weeks |
What is included in the product
Detailed Word Document
Explores how macro-environmental factors impact WEG across Political, Economic, Social, Technological, Environmental and Legal dimensions, each supported by current data and sector-specific examples; designed for executives, investors and consultants to identify threats, opportunities and inform proactive strategy and funding decisions.
Customizable Excel Spreadsheet
A concise, clean summary of WEG's PESTLE analysis, visually segmented by category for quick interpretation and easily drop‑in ready for presentations to foster fast alignment across teams.
Economic factors
Capex cycles
Industrial capex cycles in mining, oil & gas and manufacturing drive demand for motors, drives and automation; WEG’s 2024 net revenue of BRL 35.1 billion shows sensitivity to these sectors. Downcycles defer upgrades and new installs, reducing short-term order intake, while upcycles shift spend to efficiency retrofits and capacity expansions that lift average selling prices. WEG’s diversified sector mix smooths volatility but cannot eliminate it.
FX and inflation
Currency swings (BRL ~5.10/USD in H1 2025) materially affect WEG’s export revenues, input costs and translation exposure, while Brazil’s headline inflation (~4.6% y/y mid-2025) raises materials and labor costs, pressuring margins absent agile pricing; WEG uses FX hedging and index-linked contracts to mitigate volatility and reports routine hedge programs covering a meaningful portion of export flows, and greater localization of suppliers has reduced sensitivity to imported-cost swings.
Commodity prices
Copper (~$9,000/t LME 2024), aluminum (~$2,300/t), HRC steel (~$800/t) and rare-earths (NdPr ~ $70/kg) drive BOM for WEG motors, transformers and generators, so price spikes force repricing or redesign to protect unit economics. Long-term supplier contracts offer partial insulation, while tight inventory turns and JIT inventory preserve cash flow and margin resilience.
Interest rates and credit
Rising rates increased customer WACC—global policy rates averaged ~3.5% in 2024, delaying grid and industrial projects and extending payback periods. Concessional energy-efficiency financing (0.5–2% below market) unlocked orders in Brazil and the EU in 2024. WEG's net debt/EBITDA ~0.6 (FY2024) enables vendor financing and competitive terms; regional credit spreads shape sales mix and timing.
- Higher WACC: delays capex
- Concessional finance: unlocks EE orders
- WEG balance sheet: enables vendor finance
- Regional credit: alters timing/mix
Global growth dispersion
Global demand dispersion sees Americas ~2.1% growth, EMEA ~1.2% and APAC ~4.5% (IMF July 2025), driving uneven factory utilization for WEG; slower EMEA activity can be offset by APAC infrastructure and renewables expansion. WEGs mix across T&D, renewables and industrial automation cushions regional cycles, while agile production shifts limit margin erosion.
- Regional growth tags: Americas 2.1%, EMEA 1.2%, APAC 4.5%
- Portfolio tag: T&D, Renewables, Automation
- Mitigation tag: agile capacity allocation
Brazil policy, tariffs and 12-24 week lead times reshape exporters amid $1.7T clean-energy
Industrial capex cycles, FX (BRL ~5.10/USD H1‑2025) and commodity swings (Cu $9,000/t, Al $2,300/t, NdPr $70/kg) drive WEG top‑line and margins; 2024 net revenue BRL 35.1bn and net debt/EBITDA 0.6 underpin vendor finance. Inflation ~4.6% mid‑2025 and higher WACC slow projects, while concessional finance and portfolio mix (T&D, renewables, automation) mitigate volatility.
| Metric | Value |
|---|---|
| 2024 revenue | BRL 35.1bn |
| BRL/USD H1‑2025 | ~5.10 |
| Inflation mid‑2025 | 4.6% |
| Net debt/EBITDA | 0.6 |
| IMF growth (2025) | Am 2.1% / EMEA 1.2% / APAC 4.5% |
Preview Before You Purchase
WEG PESTLE Analysis
The preview shown here is the exact WEG PESTLE Analysis document you’ll receive after purchase—fully formatted, professionally structured, and ready to use. No placeholders or surprises; this is the real file. The content and layout match the delivered download immediately after checkout.
Original: $10.00
-65%$10.00
$3.50Description
Make Smarter Strategic Decisions with a Complete PESTEL View
Discover how political shifts, economic cycles, and green-tech trends are reshaping WEG’s strategic outlook in our concise PESTLE snapshot—perfect for investors and strategists seeking clarity fast. This analysis highlights regulatory risks, supply-chain pressures, and innovation opportunities you need to know. Purchase the full PESTLE for the complete, actionable breakdown and downloadable templates to use immediately.
Political factors
Industrial policy shifts
Changes in Brazil and key export markets’ industrial policies — where industry accounts for roughly 18% of Brazil’s GDP (2023) — can alter incentives for local manufacturing and content rules, affecting WEG’s sourcing and regional strategy. WEG’s capex and footprint decisions depend on subsidies, tax credits and procurement preferences for domestic producers; exports historically represent about 40% of WEG’s revenue mix. Policy continuity supports long-horizon investments in motors, transformers and grid projects, while abrupt shifts raise execution and stranded-asset risks.
Energy transition agendas
Governments' net-zero commitments, including Brazil's 2050 target, are driving public investment in renewables, grid expansion and electrification, expanding addressable demand for WEG products. Policy clarity on auctions and interconnection has accelerated project pipelines; global clean energy investment reached about $1.7 trillion in 2023 (IEA). Inconsistent timelines or rollbacks, however, can delay orders, while stable frameworks de-risk large-scale generation, transmission and industrial efficiency projects.
Trade tariffs and localization
Tariffs on electrical equipment and components—often reaching double digits in some emerging markets—raise WEGs input costs and force price adjustments that squeeze margins. Localization clauses in infrastructure tenders, frequently demanding up to 60% local content, shape where WEG manufactures and assembles, boosting regional CAPEX. WEGs multi-hub footprint of over 30 factories in about 14 countries improves export competitiveness under favorable trade deals and mitigates protectionist shocks.
Geopolitical supply risks
Geopolitical tensions raise delivery delays in metals, semiconductors and power electronics, with industry lead times swinging roughly 12–24 weeks across 2022–2024; sanctions on Russia and Iran complicate sales and EPC partnerships under US, EU and UK regimes. Diversified suppliers and dual-sourcing have proven to reduce single-source disruption, while proactive compliance screening preserves eligibility for global bids.
- Lead-time volatility: 12–24 weeks (2022–2024)
- Sanctions impact: Russia, Iran restrictions under US/EU/UK regimes
- Risk mitigation: dual-sourcing + compliance screening
Public procurement cycles
Public procurement cycles drive lumpiness in WEG orders as government budgets for transmission, distribution and infrastructure are released in tranches; election cycles shift spending toward visible projects like transport or social programs, affecting timing and mix. Strong local relationships and certifications increase tender win rates, while clearer pipeline visibility improves factory loading and working-capital planning.
- Procurement lumpiness: affects order timing
- Election shifts: alters sectoral spend
- Local ties: boost tender success
- Pipeline visibility: optimizes capacity & cash
Brazil policy, tariffs and 12-24 week lead times reshape exporters amid $1.7T clean-energy
Industrial policy shifts in Brazil (industry ~18% of GDP, 2023) and key markets affect WEG’s sourcing and capex; exports ~40% of revenue make trade rules critical. Net-zero commitments (Brazil 2050) and $1.7T global clean-energy spend (2023) expand demand but policy rollbacks delay orders. Tariffs/local-content (up to 60%) and 12–24 week lead-time volatility (2022–24) hinge regional footprint decisions.
| Metric | Value |
|---|---|
| Industry share (BR) | 18% (2023) |
| Exports of revenue | ~40% |
| Clean-energy spend | $1.7T (2023) |
| Factories/countries | 30/14 |
| Lead-time | 12–24 weeks |
What is included in the product
Detailed Word Document
Explores how macro-environmental factors impact WEG across Political, Economic, Social, Technological, Environmental and Legal dimensions, each supported by current data and sector-specific examples; designed for executives, investors and consultants to identify threats, opportunities and inform proactive strategy and funding decisions.
Customizable Excel Spreadsheet
A concise, clean summary of WEG's PESTLE analysis, visually segmented by category for quick interpretation and easily drop‑in ready for presentations to foster fast alignment across teams.
Economic factors
Capex cycles
Industrial capex cycles in mining, oil & gas and manufacturing drive demand for motors, drives and automation; WEG’s 2024 net revenue of BRL 35.1 billion shows sensitivity to these sectors. Downcycles defer upgrades and new installs, reducing short-term order intake, while upcycles shift spend to efficiency retrofits and capacity expansions that lift average selling prices. WEG’s diversified sector mix smooths volatility but cannot eliminate it.
FX and inflation
Currency swings (BRL ~5.10/USD in H1 2025) materially affect WEG’s export revenues, input costs and translation exposure, while Brazil’s headline inflation (~4.6% y/y mid-2025) raises materials and labor costs, pressuring margins absent agile pricing; WEG uses FX hedging and index-linked contracts to mitigate volatility and reports routine hedge programs covering a meaningful portion of export flows, and greater localization of suppliers has reduced sensitivity to imported-cost swings.
Commodity prices
Copper (~$9,000/t LME 2024), aluminum (~$2,300/t), HRC steel (~$800/t) and rare-earths (NdPr ~ $70/kg) drive BOM for WEG motors, transformers and generators, so price spikes force repricing or redesign to protect unit economics. Long-term supplier contracts offer partial insulation, while tight inventory turns and JIT inventory preserve cash flow and margin resilience.
Interest rates and credit
Rising rates increased customer WACC—global policy rates averaged ~3.5% in 2024, delaying grid and industrial projects and extending payback periods. Concessional energy-efficiency financing (0.5–2% below market) unlocked orders in Brazil and the EU in 2024. WEG's net debt/EBITDA ~0.6 (FY2024) enables vendor financing and competitive terms; regional credit spreads shape sales mix and timing.
- Higher WACC: delays capex
- Concessional finance: unlocks EE orders
- WEG balance sheet: enables vendor finance
- Regional credit: alters timing/mix
Global growth dispersion
Global demand dispersion sees Americas ~2.1% growth, EMEA ~1.2% and APAC ~4.5% (IMF July 2025), driving uneven factory utilization for WEG; slower EMEA activity can be offset by APAC infrastructure and renewables expansion. WEGs mix across T&D, renewables and industrial automation cushions regional cycles, while agile production shifts limit margin erosion.
- Regional growth tags: Americas 2.1%, EMEA 1.2%, APAC 4.5%
- Portfolio tag: T&D, Renewables, Automation
- Mitigation tag: agile capacity allocation
Brazil policy, tariffs and 12-24 week lead times reshape exporters amid $1.7T clean-energy
Industrial capex cycles, FX (BRL ~5.10/USD H1‑2025) and commodity swings (Cu $9,000/t, Al $2,300/t, NdPr $70/kg) drive WEG top‑line and margins; 2024 net revenue BRL 35.1bn and net debt/EBITDA 0.6 underpin vendor finance. Inflation ~4.6% mid‑2025 and higher WACC slow projects, while concessional finance and portfolio mix (T&D, renewables, automation) mitigate volatility.
| Metric | Value |
|---|---|
| 2024 revenue | BRL 35.1bn |
| BRL/USD H1‑2025 | ~5.10 |
| Inflation mid‑2025 | 4.6% |
| Net debt/EBITDA | 0.6 |
| IMF growth (2025) | Am 2.1% / EMEA 1.2% / APAC 4.5% |
Preview Before You Purchase
WEG PESTLE Analysis
The preview shown here is the exact WEG PESTLE Analysis document you’ll receive after purchase—fully formatted, professionally structured, and ready to use. No placeholders or surprises; this is the real file. The content and layout match the delivered download immediately after checkout.











