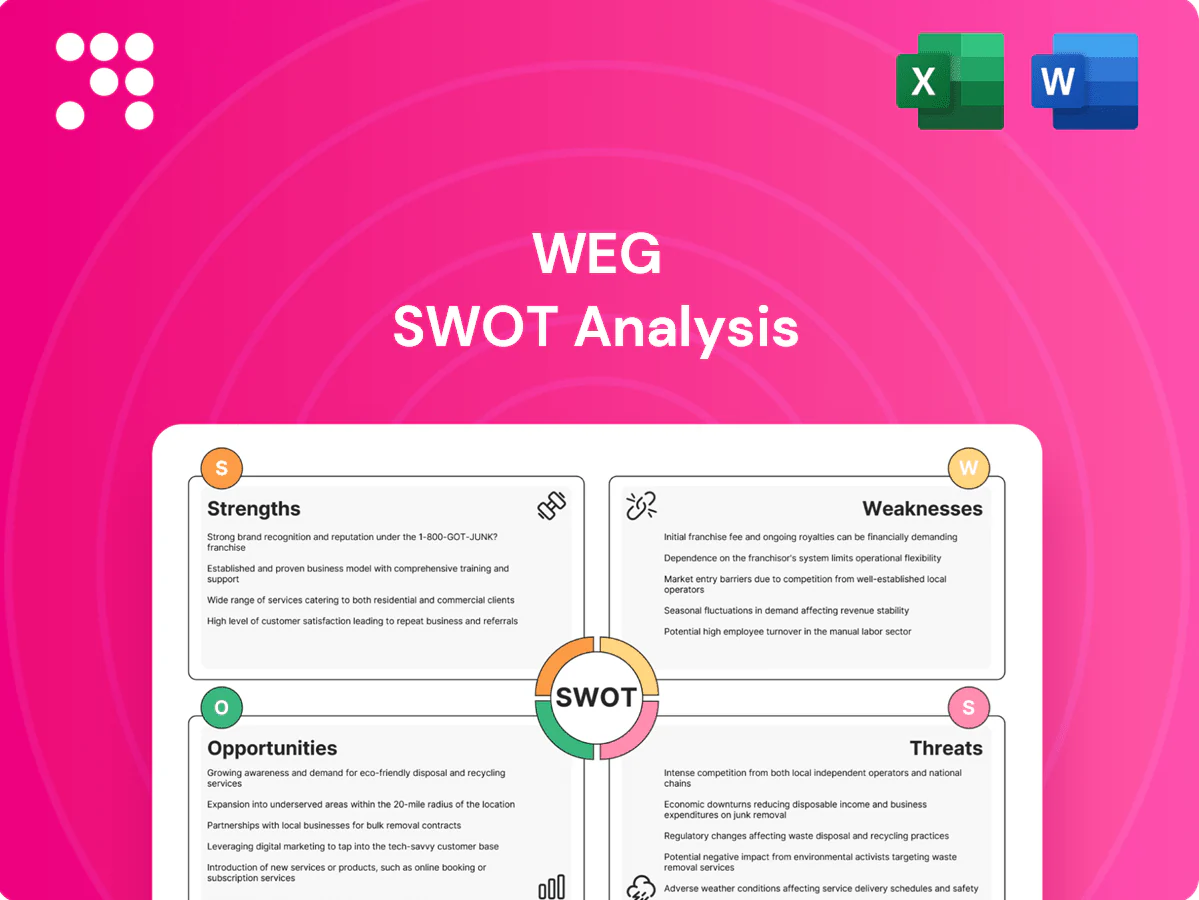
WEG SWOT Analysis

Dive Deeper Into the Company’s Strategic Blueprint
Discover WEG’s competitive edge and market risks in this concise SWOT snapshot: robust global manufacturing and diversified product lines, rising electrification demand, plus exposure to commodity cycles and supply-chain pressures. Want the full strategic picture? Purchase the complete SWOT analysis—word and Excel deliverables with actionable insights for investors and strategists.
Strengths

Diversified product portfolio
WEG's diversified portfolio — motors, generators, transformers, drives and coatings across industrial, commercial and residential segments — reduces dependence on any single product or end-market. This breadth enables cross-selling and bundled solutions, boosting average order value and aftermarket services penetration. Operating in over 135 countries, diversification stabilizes revenue through cycles.
Integrated energy solutions
Offering generation, transmission, distribution and automation lets WEG deliver turnkey projects with single-vendor accountability and interoperable systems, boosting win rates in complex bids. This full-stack approach raises switching costs and anchors customers into multi-year contracts. It also drives lifecycle service revenues across WEGs global footprint in 135+ countries, strengthening recurring-revenue potential.

Global manufacturing footprint
WEG's global manufacturing footprint spans 30+ countries, shortening lead times and lowering logistics risk through regional supply chains; localized plants (11 countries) boost cost competitiveness and regulatory compliance while proximity to customers improves service and customization, and geographic spread dilutes geopolitical and currency exposure—supporting the group's scale that underpinned revenue growth in recent years.

Cost efficiency and scale
- Purchasing scale: global sourcing across 33 plants
- Standardization: platform-based product lines
- Pricing power: competitive pricing with margin retention
- Resilience: lower breakeven per unit in downturns
Strong R&D and industrial know-how
WEG’s 64-year engineering heritage and global footprint in 135+ countries underpins deep electromechanical design and drives expertise that differentiates its product range. Continuous innovation yields premium IE efficiency ratings and integrated digital features, while engineering depth enables application-specific customization for mission-critical industries. This sustains strong brand credibility among industrial customers.
- Founded: 1961 (64 years)
- Presence: 135+ countries
- Focus: IE efficiency, digital drives, customization
Industrial leader: 33 factories, 135+ countries
WEG’s broad product portfolio and turnkey generation-to-automation scope reduce single-market exposure and raise switching costs, supporting recurring services. A 33-factory global manufacturing footprint and presence in 135+ countries enable scale, lower unit costs and local compliance. Six-decade engineering heritage drives IE-efficiency leadership and application customization for mission-critical customers.
| Metric | Value |
|---|---|
| Founded | 1961 (64 years) |
| Presence | 135+ countries |
| Factories | 33 (14 countries) |
| Localized plants | 11 countries |
What is included in the product
 Detailed Word Document
Provides a strategic overview of WEG’s internal strengths and weaknesses and external opportunities and threats, mapping competitive position, growth drivers, operational gaps, and market risks to inform strategic decisions.

 Customizable Excel Spreadsheet
Provides a concise WEG SWOT matrix that highlights core strengths, weaknesses, opportunities and threats for rapid strategic alignment and risk mitigation, ideal for quick stakeholder briefings and actionable decision-making.
Weaknesses

Exposure to cyclical capex
Demand for WEG closely tracks industrial, infrastructure, mining and oil & gas capex cycles, so project deferrals can quickly compress orders and revenue; WEG reported consolidated net revenue of R$35.4 billion in 2023, highlighting scale exposed to cycles. A concentration in large-projects amplifies quarter-to-quarter volatility in order intake and margins, with backlog of roughly R$13.6 billion not immune to sudden macro slowdowns. Backlogs and service revenues may blunt but often do not fully offset sharp downturns in end-market investment.
FX and Brazil concentration
WEG's reported results are highly sensitive to Brazilian real volatility versus USD and EUR, with Brazil accounting for roughly 40% of net revenue in 2024, amplifying FX-translated earnings swings. Local cost base in reais versus an export mix priced in dollars and euros creates timing and margin mismatches as the real moved about 12% versus the dollar in 2024. Currency swings compress pricing power and raise imported input costs, and hedging programs only partially mitigate earnings variability.

Raw material sensitivity
Copper, electrical steel and resins are key cost drivers for WEG; LME copper averaged about US$9,500/ton in 2024 and traded near US$9,200/ton in H1 2025, squeezing gross margins on fixed-price contracts. Supply disruptions have extended lead times industrywide, and competitive pressure limits passing higher input costs to customers.

Complex global supply chain
WEG's complex global supply chain — operating in 135+ countries with 30+ manufacturing units — raises coordination risk across multi-country sourcing and assembly, increasing lead-time variability. Compliance, cross-border logistics and inventory management add recurring overhead and working-capital pressure. Disruptions in one region can ripple across product lines, while visibility and forecasting remain difficult for long-cycle industrial items.
- Coordination risk: multi-country sourcing/assembly
- Overhead: compliance, logistics, inventory
- Contagion: disruptions ripple across product lines
- Planning: poor visibility for long-cycle items
Competitive pricing pressure
Commoditized motors and transformers expose WEG to aggressive global and regional rivals, where discounting to defend share can materially erode margins; differentiation is harder for products built to standard specs, forcing competition on price rather than technology or brand. Service and integrated solutions must offset price-led bids to preserve profitability and long-term customer ties.
- price pressure
- margin erosion
- standard-spec commoditization
- service differentiation required
Cyclical exporter: R$35.4bn rev; Brazil ~40%, FX & copper risk
WEG is cyclically exposed: consolidated revenue R$35.4bn (2023) and backlog ~R$13.6bn amplify order/margin volatility when capex is deferred. Brazil accounted for ~40% of revenue in 2024, making earnings sensitive to FX (real moved ~12% vs USD in 2024). Input costs (LME copper ~US$9,500/t in 2024) and commoditized motors compress margins; complex global supply chains raise lead-time and working-capital risk.
| Metric | Value |
|---|---|
| 2023 revenue | R$35.4bn |
| Backlog | R$13.6bn |
| Brazil share (2024) | ~40% |
| FX move (2024) | ~12% vs USD |
| LME copper (2024) | ~US$9,500/t |
Preview Before You Purchase
WEG SWOT Analysis
This is the actual WEG SWOT analysis document you’ll receive upon purchase — no surprises, just professional quality. The preview below is taken directly from the full SWOT report you'll get, and the complete, editable version is unlocked after checkout. Buy now to download the full, detailed file immediately.

Dive Deeper Into the Company’s Strategic Blueprint
Discover WEG’s competitive edge and market risks in this concise SWOT snapshot: robust global manufacturing and diversified product lines, rising electrification demand, plus exposure to commodity cycles and supply-chain pressures. Want the full strategic picture? Purchase the complete SWOT analysis—word and Excel deliverables with actionable insights for investors and strategists.
Strengths
Diversified product portfolio
WEG's diversified portfolio — motors, generators, transformers, drives and coatings across industrial, commercial and residential segments — reduces dependence on any single product or end-market. This breadth enables cross-selling and bundled solutions, boosting average order value and aftermarket services penetration. Operating in over 135 countries, diversification stabilizes revenue through cycles.
Integrated energy solutions
Offering generation, transmission, distribution and automation lets WEG deliver turnkey projects with single-vendor accountability and interoperable systems, boosting win rates in complex bids. This full-stack approach raises switching costs and anchors customers into multi-year contracts. It also drives lifecycle service revenues across WEGs global footprint in 135+ countries, strengthening recurring-revenue potential.
Global manufacturing footprint
WEG's global manufacturing footprint spans 30+ countries, shortening lead times and lowering logistics risk through regional supply chains; localized plants (11 countries) boost cost competitiveness and regulatory compliance while proximity to customers improves service and customization, and geographic spread dilutes geopolitical and currency exposure—supporting the group's scale that underpinned revenue growth in recent years.
Cost efficiency and scale
- Purchasing scale: global sourcing across 33 plants
- Standardization: platform-based product lines
- Pricing power: competitive pricing with margin retention
- Resilience: lower breakeven per unit in downturns
Strong R&D and industrial know-how
WEG’s 64-year engineering heritage and global footprint in 135+ countries underpins deep electromechanical design and drives expertise that differentiates its product range. Continuous innovation yields premium IE efficiency ratings and integrated digital features, while engineering depth enables application-specific customization for mission-critical industries. This sustains strong brand credibility among industrial customers.
- Founded: 1961 (64 years)
- Presence: 135+ countries
- Focus: IE efficiency, digital drives, customization
Industrial leader: 33 factories, 135+ countries
WEG’s broad product portfolio and turnkey generation-to-automation scope reduce single-market exposure and raise switching costs, supporting recurring services. A 33-factory global manufacturing footprint and presence in 135+ countries enable scale, lower unit costs and local compliance. Six-decade engineering heritage drives IE-efficiency leadership and application customization for mission-critical customers.
| Metric | Value |
|---|---|
| Founded | 1961 (64 years) |
| Presence | 135+ countries |
| Factories | 33 (14 countries) |
| Localized plants | 11 countries |
What is included in the product
Detailed Word Document
Provides a strategic overview of WEG’s internal strengths and weaknesses and external opportunities and threats, mapping competitive position, growth drivers, operational gaps, and market risks to inform strategic decisions.
Customizable Excel Spreadsheet
Provides a concise WEG SWOT matrix that highlights core strengths, weaknesses, opportunities and threats for rapid strategic alignment and risk mitigation, ideal for quick stakeholder briefings and actionable decision-making.
Weaknesses
Exposure to cyclical capex
Demand for WEG closely tracks industrial, infrastructure, mining and oil & gas capex cycles, so project deferrals can quickly compress orders and revenue; WEG reported consolidated net revenue of R$35.4 billion in 2023, highlighting scale exposed to cycles. A concentration in large-projects amplifies quarter-to-quarter volatility in order intake and margins, with backlog of roughly R$13.6 billion not immune to sudden macro slowdowns. Backlogs and service revenues may blunt but often do not fully offset sharp downturns in end-market investment.
FX and Brazil concentration
WEG's reported results are highly sensitive to Brazilian real volatility versus USD and EUR, with Brazil accounting for roughly 40% of net revenue in 2024, amplifying FX-translated earnings swings. Local cost base in reais versus an export mix priced in dollars and euros creates timing and margin mismatches as the real moved about 12% versus the dollar in 2024. Currency swings compress pricing power and raise imported input costs, and hedging programs only partially mitigate earnings variability.
Raw material sensitivity
Copper, electrical steel and resins are key cost drivers for WEG; LME copper averaged about US$9,500/ton in 2024 and traded near US$9,200/ton in H1 2025, squeezing gross margins on fixed-price contracts. Supply disruptions have extended lead times industrywide, and competitive pressure limits passing higher input costs to customers.
Complex global supply chain
WEG's complex global supply chain — operating in 135+ countries with 30+ manufacturing units — raises coordination risk across multi-country sourcing and assembly, increasing lead-time variability. Compliance, cross-border logistics and inventory management add recurring overhead and working-capital pressure. Disruptions in one region can ripple across product lines, while visibility and forecasting remain difficult for long-cycle industrial items.
- Coordination risk: multi-country sourcing/assembly
- Overhead: compliance, logistics, inventory
- Contagion: disruptions ripple across product lines
- Planning: poor visibility for long-cycle items
Competitive pricing pressure
Commoditized motors and transformers expose WEG to aggressive global and regional rivals, where discounting to defend share can materially erode margins; differentiation is harder for products built to standard specs, forcing competition on price rather than technology or brand. Service and integrated solutions must offset price-led bids to preserve profitability and long-term customer ties.
- price pressure
- margin erosion
- standard-spec commoditization
- service differentiation required
Cyclical exporter: R$35.4bn rev; Brazil ~40%, FX & copper risk
WEG is cyclically exposed: consolidated revenue R$35.4bn (2023) and backlog ~R$13.6bn amplify order/margin volatility when capex is deferred. Brazil accounted for ~40% of revenue in 2024, making earnings sensitive to FX (real moved ~12% vs USD in 2024). Input costs (LME copper ~US$9,500/t in 2024) and commoditized motors compress margins; complex global supply chains raise lead-time and working-capital risk.
| Metric | Value |
|---|---|
| 2023 revenue | R$35.4bn |
| Backlog | R$13.6bn |
| Brazil share (2024) | ~40% |
| FX move (2024) | ~12% vs USD |
| LME copper (2024) | ~US$9,500/t |
Preview Before You Purchase
WEG SWOT Analysis
This is the actual WEG SWOT analysis document you’ll receive upon purchase — no surprises, just professional quality. The preview below is taken directly from the full SWOT report you'll get, and the complete, editable version is unlocked after checkout. Buy now to download the full, detailed file immediately.
Original: $10.00
-65%$10.00
$3.50Description
Dive Deeper Into the Company’s Strategic Blueprint
Discover WEG’s competitive edge and market risks in this concise SWOT snapshot: robust global manufacturing and diversified product lines, rising electrification demand, plus exposure to commodity cycles and supply-chain pressures. Want the full strategic picture? Purchase the complete SWOT analysis—word and Excel deliverables with actionable insights for investors and strategists.
Strengths
Diversified product portfolio
WEG's diversified portfolio — motors, generators, transformers, drives and coatings across industrial, commercial and residential segments — reduces dependence on any single product or end-market. This breadth enables cross-selling and bundled solutions, boosting average order value and aftermarket services penetration. Operating in over 135 countries, diversification stabilizes revenue through cycles.
Integrated energy solutions
Offering generation, transmission, distribution and automation lets WEG deliver turnkey projects with single-vendor accountability and interoperable systems, boosting win rates in complex bids. This full-stack approach raises switching costs and anchors customers into multi-year contracts. It also drives lifecycle service revenues across WEGs global footprint in 135+ countries, strengthening recurring-revenue potential.
Global manufacturing footprint
WEG's global manufacturing footprint spans 30+ countries, shortening lead times and lowering logistics risk through regional supply chains; localized plants (11 countries) boost cost competitiveness and regulatory compliance while proximity to customers improves service and customization, and geographic spread dilutes geopolitical and currency exposure—supporting the group's scale that underpinned revenue growth in recent years.
Cost efficiency and scale
- Purchasing scale: global sourcing across 33 plants
- Standardization: platform-based product lines
- Pricing power: competitive pricing with margin retention
- Resilience: lower breakeven per unit in downturns
Strong R&D and industrial know-how
WEG’s 64-year engineering heritage and global footprint in 135+ countries underpins deep electromechanical design and drives expertise that differentiates its product range. Continuous innovation yields premium IE efficiency ratings and integrated digital features, while engineering depth enables application-specific customization for mission-critical industries. This sustains strong brand credibility among industrial customers.
- Founded: 1961 (64 years)
- Presence: 135+ countries
- Focus: IE efficiency, digital drives, customization
Industrial leader: 33 factories, 135+ countries
WEG’s broad product portfolio and turnkey generation-to-automation scope reduce single-market exposure and raise switching costs, supporting recurring services. A 33-factory global manufacturing footprint and presence in 135+ countries enable scale, lower unit costs and local compliance. Six-decade engineering heritage drives IE-efficiency leadership and application customization for mission-critical customers.
| Metric | Value |
|---|---|
| Founded | 1961 (64 years) |
| Presence | 135+ countries |
| Factories | 33 (14 countries) |
| Localized plants | 11 countries |
What is included in the product
Detailed Word Document
Provides a strategic overview of WEG’s internal strengths and weaknesses and external opportunities and threats, mapping competitive position, growth drivers, operational gaps, and market risks to inform strategic decisions.
Customizable Excel Spreadsheet
Provides a concise WEG SWOT matrix that highlights core strengths, weaknesses, opportunities and threats for rapid strategic alignment and risk mitigation, ideal for quick stakeholder briefings and actionable decision-making.
Weaknesses
Exposure to cyclical capex
Demand for WEG closely tracks industrial, infrastructure, mining and oil & gas capex cycles, so project deferrals can quickly compress orders and revenue; WEG reported consolidated net revenue of R$35.4 billion in 2023, highlighting scale exposed to cycles. A concentration in large-projects amplifies quarter-to-quarter volatility in order intake and margins, with backlog of roughly R$13.6 billion not immune to sudden macro slowdowns. Backlogs and service revenues may blunt but often do not fully offset sharp downturns in end-market investment.
FX and Brazil concentration
WEG's reported results are highly sensitive to Brazilian real volatility versus USD and EUR, with Brazil accounting for roughly 40% of net revenue in 2024, amplifying FX-translated earnings swings. Local cost base in reais versus an export mix priced in dollars and euros creates timing and margin mismatches as the real moved about 12% versus the dollar in 2024. Currency swings compress pricing power and raise imported input costs, and hedging programs only partially mitigate earnings variability.
Raw material sensitivity
Copper, electrical steel and resins are key cost drivers for WEG; LME copper averaged about US$9,500/ton in 2024 and traded near US$9,200/ton in H1 2025, squeezing gross margins on fixed-price contracts. Supply disruptions have extended lead times industrywide, and competitive pressure limits passing higher input costs to customers.
Complex global supply chain
WEG's complex global supply chain — operating in 135+ countries with 30+ manufacturing units — raises coordination risk across multi-country sourcing and assembly, increasing lead-time variability. Compliance, cross-border logistics and inventory management add recurring overhead and working-capital pressure. Disruptions in one region can ripple across product lines, while visibility and forecasting remain difficult for long-cycle industrial items.
- Coordination risk: multi-country sourcing/assembly
- Overhead: compliance, logistics, inventory
- Contagion: disruptions ripple across product lines
- Planning: poor visibility for long-cycle items
Competitive pricing pressure
Commoditized motors and transformers expose WEG to aggressive global and regional rivals, where discounting to defend share can materially erode margins; differentiation is harder for products built to standard specs, forcing competition on price rather than technology or brand. Service and integrated solutions must offset price-led bids to preserve profitability and long-term customer ties.
- price pressure
- margin erosion
- standard-spec commoditization
- service differentiation required
Cyclical exporter: R$35.4bn rev; Brazil ~40%, FX & copper risk
WEG is cyclically exposed: consolidated revenue R$35.4bn (2023) and backlog ~R$13.6bn amplify order/margin volatility when capex is deferred. Brazil accounted for ~40% of revenue in 2024, making earnings sensitive to FX (real moved ~12% vs USD in 2024). Input costs (LME copper ~US$9,500/t in 2024) and commoditized motors compress margins; complex global supply chains raise lead-time and working-capital risk.
| Metric | Value |
|---|---|
| 2023 revenue | R$35.4bn |
| Backlog | R$13.6bn |
| Brazil share (2024) | ~40% |
| FX move (2024) | ~12% vs USD |
| LME copper (2024) | ~US$9,500/t |
Preview Before You Purchase
WEG SWOT Analysis
This is the actual WEG SWOT analysis document you’ll receive upon purchase — no surprises, just professional quality. The preview below is taken directly from the full SWOT report you'll get, and the complete, editable version is unlocked after checkout. Buy now to download the full, detailed file immediately.











