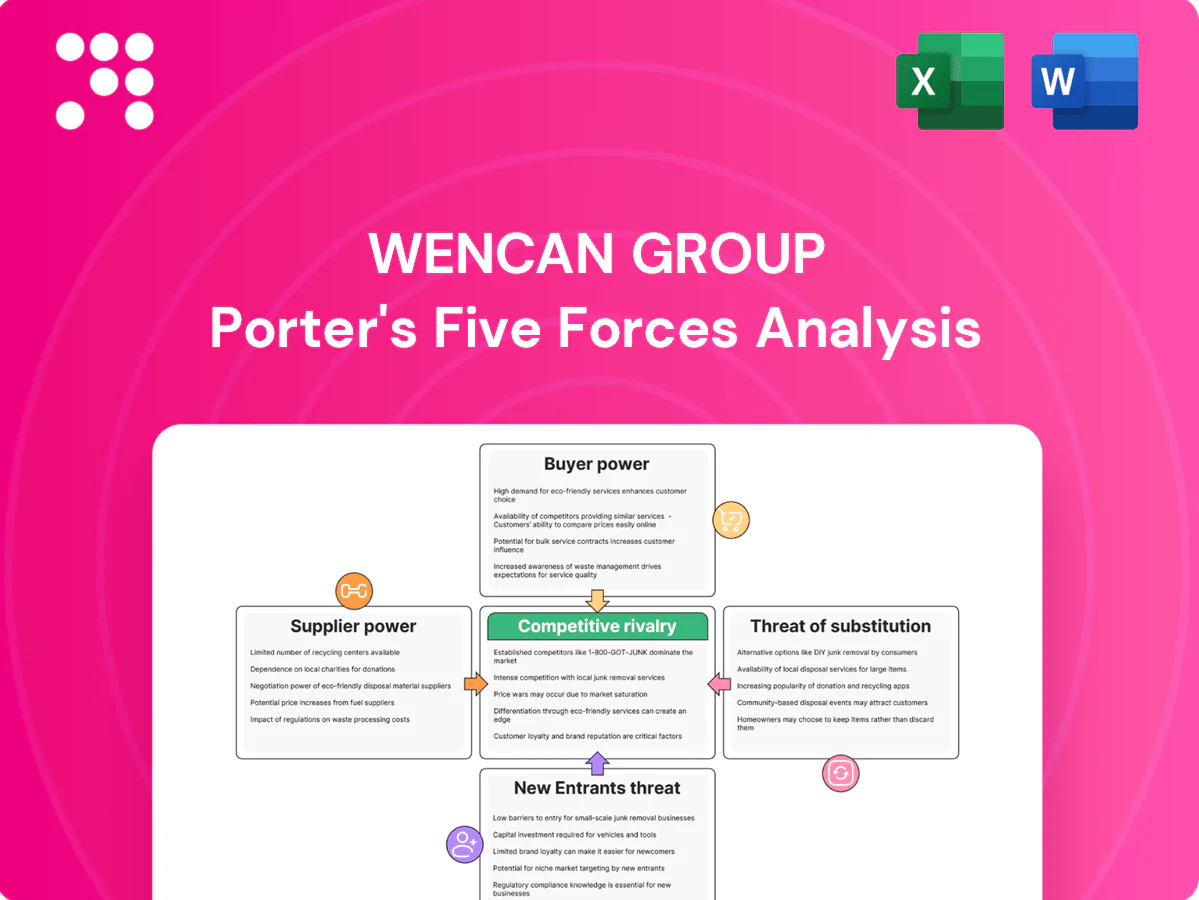
Wencan Group Porter's Five Forces Analysis

Elevate Your Analysis with the Complete Porter's Five Forces Analysis
Wencan Group faces moderate supplier leverage, intense buyer scrutiny, and evolving substitute threats as it navigates a crowded market, while barriers to entry and rival rivalry shape margins and strategic choices. This snapshot highlights key pressures on growth and profitability. Unlock the full Porter's Five Forces Analysis to access force-by-force ratings, visuals, and actionable strategy.
Suppliers Bargaining Power

Concentrated aluminum and alloy inputs
Primary inputs for Wencan—aluminum ingots, alloying elements and tight chemistries—must meet automotive-grade specs, and global smelters are highly concentrated: China produced roughly 55–60% of primary aluminum in 2023–24 while Russia accounted for about 5% of global output. A handful of regional foundries and metal traders can therefore influence pricing and allocation; LME aluminum averaged near 2,500 USD/tonne in 2024. Hedging reduces spot volatility but cannot eliminate basis risk, so upstream smelting outages or sanctions can sharply tighten supply and lift costs.
Tooling, dies, and machine OEM dependence
Large-tonnage die-casting machines, precision dies and furnace systems are concentrated among a small set of qualified OEMs, with global suppliers for >1,000-ton presses numbering in the single digits.
Industry reports (2024) show bespoke die lead times of 12–20 weeks, constraining Wencan Group’s production flexibility and weakening its bargaining leverage.
Controls and spare parts are often proprietary, creating supplier lock-in that raises switching costs and can drive service premiums and downtime exposure.

Energy and gas price sensitivity
Foundry operations are energy-intensive, with energy often accounting for up to 20% of manufacturing costs; China industrial electricity averaged about 0.6 CNY/kWh in 2024 and benchmark gas tightened after 2022 LNG shocks. Regional tariffs and grid stability materially affect unit economics, while utilities offer limited short-term negotiability; energy price spikes have historically been only 40–60% pass-through to customers, compressing margins.

Specialty coatings, chemicals, and QA consumables
Release agents, filters, thermal coatings and metrology consumables are sourced from specialized niches where PPAP and multi-month audit cycles limit rapid substitution, giving suppliers leverage; vendors can and do negotiate quality-linked premiums and service terms. Dual-sourcing exists but is operationally constrained by qualification timelines and audit frequency.
- PPAP: multi-month qualification
- Audit cycles: typically annual
- Suppliers: negotiate quality premiums
- Dual-sourcing: available but constrained
Scrap and recycling loop dynamics
- Recycled share ~33% (2024)
- Discounts 10–40% by contamination
- Reintroduction capped by QC/traceability
- Market spreads ~20% in 2024
55-60% China share tightens upstream; LME ~2,500 USD/t, dies 12-20 wks
Supplier power is high: China produced ~55–60% of primary aluminum in 2023–24 and LME aluminum averaged ~2,500 USD/tonne in 2024, tightening upstream leverage. Critical capital goods (presses, dies) are supplied by few OEMs with die lead times of 12–20 weeks, raising switching costs. Recycled aluminum ~33% (2024) partially mitigates dependence but QC limits substitution.
| Metric | 2024 |
|---|---|
| China share | 55–60% |
| LME Al | ~2,500 USD/t |
| Die lead time | 12–20 wks |
| Recycled share | ~33% |
What is included in the product
 Detailed Word Document
Provides a concise Porter’s Five Forces assessment of Wencan Group, evaluating competitive rivalry, buyer and supplier power, threats from new entrants and substitutes, and highlighting disruptive, regulatory, and strategic levers.

 Customizable Excel Spreadsheet
One-sheet Porter's Five Forces for Wencan Group that instantly highlights competitive pain points and relief strategies—customize pressure levels, swap in your data, and visualize impact with a ready-to-use spider chart for decks or dashboards.
Customers Bargaining Power

Automotive OEM/Tier-1 concentration
Customers for Wencan are large global OEMs and Tier-1s with professional procurement teams; in 2024 the top 10 automakers accounted for roughly 60% of global vehicle production, concentrating demand and leverage. High buyer concentration pressures suppliers on price and contract terms, with annual price-down expectations becoming standard. Volume aggregation across platforms further amplifies buyers’ negotiating power and margin compression.
High qualification and switching costs
PPAP requirements and IATF 16949 certification, plus lengthy tooling validation—often 6–18 months and tooling costs commonly $200k–$1M per part—make switching suppliers costly. Once designed-in, buyers face 12–24 months and material risk to dual-source, which tempers buyer power on in-production programs. Re-sourcing typically occurs at platform refreshes every 5–7 years, when negotiation leverage increases.

Design control and specification pressure
Customers retain ownership of many part designs and tolerance specs, dictating materials and processes and driving 2024 OEM-directed BOM control estimated at 65% for key assemblies. Value engineering requests push continuous cost reductions, commonly targeting 5–10% cuts per program cycle. Open-book costing and should-cost models—now used by roughly 60% of tier-1 buyers in 2024—intensify margin pressure, forcing suppliers to prove yield and OEE improvements to defend margins.

Global footprint and logistics leverage
OEMs increasingly award volumes to suppliers with multi-region plants for risk mitigation and total-landed-cost optimization; in 2024 buyers used logistics and localization incentives as explicit negotiation levers, shifting awards geographically to capture tariff, freight and lead-time advantages. Non-local plants face direct pricing pressure to offset freight and inventory holding costs.
- Multi-region preference: mitigates disruption
- Geographic awards: optimize total landed cost
- Logistics/localization: used as negotiation levers
- Non-local plants: face pricing pressure to cover freight
EV transition and content mix shifts
Top-10 automakers concentrate spend; high tooling costs, long validation, EVs boost aluminum demand
Customers are concentrated: top 10 automakers ~60% of global production (2024), creating strong price leverage and routine 5–10% cost-down targets.
Switching costs high: PPAP/IATF 16949, tooling $200k–$1M, 6–18 months validation; re-sourcing mainly at 5–7 year platform refreshes.
EV shift: 2024 EVs ~15M (16% share) raises aluminum structural demand; early design involvement yields stickier awards.
| Metric | 2024 |
|---|---|
| Top10 automakers share | ~60% |
| EV sales | ~15M (16%) |
| Tooling cost/part | $200k–$1M |
| Validation time | 6–18 months |
| Re-source cycle | 5–7 yrs |
Preview Before You Purchase
Wencan Group Porter's Five Forces Analysis
This Porter's Five Forces analysis of Wencan Group assesses competitive rivalry, supplier and buyer power, threat of substitutes, and barriers to entry—offering strategic insight and actionable implications. This preview is the exact, fully formatted document you will receive immediately after purchase—no placeholders, no edits required.

Elevate Your Analysis with the Complete Porter's Five Forces Analysis
Wencan Group faces moderate supplier leverage, intense buyer scrutiny, and evolving substitute threats as it navigates a crowded market, while barriers to entry and rival rivalry shape margins and strategic choices. This snapshot highlights key pressures on growth and profitability. Unlock the full Porter's Five Forces Analysis to access force-by-force ratings, visuals, and actionable strategy.
Suppliers Bargaining Power
Concentrated aluminum and alloy inputs
Primary inputs for Wencan—aluminum ingots, alloying elements and tight chemistries—must meet automotive-grade specs, and global smelters are highly concentrated: China produced roughly 55–60% of primary aluminum in 2023–24 while Russia accounted for about 5% of global output. A handful of regional foundries and metal traders can therefore influence pricing and allocation; LME aluminum averaged near 2,500 USD/tonne in 2024. Hedging reduces spot volatility but cannot eliminate basis risk, so upstream smelting outages or sanctions can sharply tighten supply and lift costs.
Tooling, dies, and machine OEM dependence
Large-tonnage die-casting machines, precision dies and furnace systems are concentrated among a small set of qualified OEMs, with global suppliers for >1,000-ton presses numbering in the single digits.
Industry reports (2024) show bespoke die lead times of 12–20 weeks, constraining Wencan Group’s production flexibility and weakening its bargaining leverage.
Controls and spare parts are often proprietary, creating supplier lock-in that raises switching costs and can drive service premiums and downtime exposure.
Energy and gas price sensitivity
Foundry operations are energy-intensive, with energy often accounting for up to 20% of manufacturing costs; China industrial electricity averaged about 0.6 CNY/kWh in 2024 and benchmark gas tightened after 2022 LNG shocks. Regional tariffs and grid stability materially affect unit economics, while utilities offer limited short-term negotiability; energy price spikes have historically been only 40–60% pass-through to customers, compressing margins.
Specialty coatings, chemicals, and QA consumables
Release agents, filters, thermal coatings and metrology consumables are sourced from specialized niches where PPAP and multi-month audit cycles limit rapid substitution, giving suppliers leverage; vendors can and do negotiate quality-linked premiums and service terms. Dual-sourcing exists but is operationally constrained by qualification timelines and audit frequency.
- PPAP: multi-month qualification
- Audit cycles: typically annual
- Suppliers: negotiate quality premiums
- Dual-sourcing: available but constrained
Scrap and recycling loop dynamics
- Recycled share ~33% (2024)
- Discounts 10–40% by contamination
- Reintroduction capped by QC/traceability
- Market spreads ~20% in 2024
55-60% China share tightens upstream; LME ~2,500 USD/t, dies 12-20 wks
Supplier power is high: China produced ~55–60% of primary aluminum in 2023–24 and LME aluminum averaged ~2,500 USD/tonne in 2024, tightening upstream leverage. Critical capital goods (presses, dies) are supplied by few OEMs with die lead times of 12–20 weeks, raising switching costs. Recycled aluminum ~33% (2024) partially mitigates dependence but QC limits substitution.
| Metric | 2024 |
|---|---|
| China share | 55–60% |
| LME Al | ~2,500 USD/t |
| Die lead time | 12–20 wks |
| Recycled share | ~33% |
What is included in the product
Detailed Word Document
Provides a concise Porter’s Five Forces assessment of Wencan Group, evaluating competitive rivalry, buyer and supplier power, threats from new entrants and substitutes, and highlighting disruptive, regulatory, and strategic levers.
Customizable Excel Spreadsheet
One-sheet Porter's Five Forces for Wencan Group that instantly highlights competitive pain points and relief strategies—customize pressure levels, swap in your data, and visualize impact with a ready-to-use spider chart for decks or dashboards.
Customers Bargaining Power
Automotive OEM/Tier-1 concentration
Customers for Wencan are large global OEMs and Tier-1s with professional procurement teams; in 2024 the top 10 automakers accounted for roughly 60% of global vehicle production, concentrating demand and leverage. High buyer concentration pressures suppliers on price and contract terms, with annual price-down expectations becoming standard. Volume aggregation across platforms further amplifies buyers’ negotiating power and margin compression.
High qualification and switching costs
PPAP requirements and IATF 16949 certification, plus lengthy tooling validation—often 6–18 months and tooling costs commonly $200k–$1M per part—make switching suppliers costly. Once designed-in, buyers face 12–24 months and material risk to dual-source, which tempers buyer power on in-production programs. Re-sourcing typically occurs at platform refreshes every 5–7 years, when negotiation leverage increases.
Design control and specification pressure
Customers retain ownership of many part designs and tolerance specs, dictating materials and processes and driving 2024 OEM-directed BOM control estimated at 65% for key assemblies. Value engineering requests push continuous cost reductions, commonly targeting 5–10% cuts per program cycle. Open-book costing and should-cost models—now used by roughly 60% of tier-1 buyers in 2024—intensify margin pressure, forcing suppliers to prove yield and OEE improvements to defend margins.
Global footprint and logistics leverage
OEMs increasingly award volumes to suppliers with multi-region plants for risk mitigation and total-landed-cost optimization; in 2024 buyers used logistics and localization incentives as explicit negotiation levers, shifting awards geographically to capture tariff, freight and lead-time advantages. Non-local plants face direct pricing pressure to offset freight and inventory holding costs.
- Multi-region preference: mitigates disruption
- Geographic awards: optimize total landed cost
- Logistics/localization: used as negotiation levers
- Non-local plants: face pricing pressure to cover freight
EV transition and content mix shifts
Top-10 automakers concentrate spend; high tooling costs, long validation, EVs boost aluminum demand
Customers are concentrated: top 10 automakers ~60% of global production (2024), creating strong price leverage and routine 5–10% cost-down targets.
Switching costs high: PPAP/IATF 16949, tooling $200k–$1M, 6–18 months validation; re-sourcing mainly at 5–7 year platform refreshes.
EV shift: 2024 EVs ~15M (16% share) raises aluminum structural demand; early design involvement yields stickier awards.
| Metric | 2024 |
|---|---|
| Top10 automakers share | ~60% |
| EV sales | ~15M (16%) |
| Tooling cost/part | $200k–$1M |
| Validation time | 6–18 months |
| Re-source cycle | 5–7 yrs |
Preview Before You Purchase
Wencan Group Porter's Five Forces Analysis
This Porter's Five Forces analysis of Wencan Group assesses competitive rivalry, supplier and buyer power, threat of substitutes, and barriers to entry—offering strategic insight and actionable implications. This preview is the exact, fully formatted document you will receive immediately after purchase—no placeholders, no edits required.
Original: $10.00
-65%$10.00
$3.50Description
Elevate Your Analysis with the Complete Porter's Five Forces Analysis
Wencan Group faces moderate supplier leverage, intense buyer scrutiny, and evolving substitute threats as it navigates a crowded market, while barriers to entry and rival rivalry shape margins and strategic choices. This snapshot highlights key pressures on growth and profitability. Unlock the full Porter's Five Forces Analysis to access force-by-force ratings, visuals, and actionable strategy.
Suppliers Bargaining Power
Concentrated aluminum and alloy inputs
Primary inputs for Wencan—aluminum ingots, alloying elements and tight chemistries—must meet automotive-grade specs, and global smelters are highly concentrated: China produced roughly 55–60% of primary aluminum in 2023–24 while Russia accounted for about 5% of global output. A handful of regional foundries and metal traders can therefore influence pricing and allocation; LME aluminum averaged near 2,500 USD/tonne in 2024. Hedging reduces spot volatility but cannot eliminate basis risk, so upstream smelting outages or sanctions can sharply tighten supply and lift costs.
Tooling, dies, and machine OEM dependence
Large-tonnage die-casting machines, precision dies and furnace systems are concentrated among a small set of qualified OEMs, with global suppliers for >1,000-ton presses numbering in the single digits.
Industry reports (2024) show bespoke die lead times of 12–20 weeks, constraining Wencan Group’s production flexibility and weakening its bargaining leverage.
Controls and spare parts are often proprietary, creating supplier lock-in that raises switching costs and can drive service premiums and downtime exposure.
Energy and gas price sensitivity
Foundry operations are energy-intensive, with energy often accounting for up to 20% of manufacturing costs; China industrial electricity averaged about 0.6 CNY/kWh in 2024 and benchmark gas tightened after 2022 LNG shocks. Regional tariffs and grid stability materially affect unit economics, while utilities offer limited short-term negotiability; energy price spikes have historically been only 40–60% pass-through to customers, compressing margins.
Specialty coatings, chemicals, and QA consumables
Release agents, filters, thermal coatings and metrology consumables are sourced from specialized niches where PPAP and multi-month audit cycles limit rapid substitution, giving suppliers leverage; vendors can and do negotiate quality-linked premiums and service terms. Dual-sourcing exists but is operationally constrained by qualification timelines and audit frequency.
- PPAP: multi-month qualification
- Audit cycles: typically annual
- Suppliers: negotiate quality premiums
- Dual-sourcing: available but constrained
Scrap and recycling loop dynamics
- Recycled share ~33% (2024)
- Discounts 10–40% by contamination
- Reintroduction capped by QC/traceability
- Market spreads ~20% in 2024
55-60% China share tightens upstream; LME ~2,500 USD/t, dies 12-20 wks
Supplier power is high: China produced ~55–60% of primary aluminum in 2023–24 and LME aluminum averaged ~2,500 USD/tonne in 2024, tightening upstream leverage. Critical capital goods (presses, dies) are supplied by few OEMs with die lead times of 12–20 weeks, raising switching costs. Recycled aluminum ~33% (2024) partially mitigates dependence but QC limits substitution.
| Metric | 2024 |
|---|---|
| China share | 55–60% |
| LME Al | ~2,500 USD/t |
| Die lead time | 12–20 wks |
| Recycled share | ~33% |
What is included in the product
Detailed Word Document
Provides a concise Porter’s Five Forces assessment of Wencan Group, evaluating competitive rivalry, buyer and supplier power, threats from new entrants and substitutes, and highlighting disruptive, regulatory, and strategic levers.
Customizable Excel Spreadsheet
One-sheet Porter's Five Forces for Wencan Group that instantly highlights competitive pain points and relief strategies—customize pressure levels, swap in your data, and visualize impact with a ready-to-use spider chart for decks or dashboards.
Customers Bargaining Power
Automotive OEM/Tier-1 concentration
Customers for Wencan are large global OEMs and Tier-1s with professional procurement teams; in 2024 the top 10 automakers accounted for roughly 60% of global vehicle production, concentrating demand and leverage. High buyer concentration pressures suppliers on price and contract terms, with annual price-down expectations becoming standard. Volume aggregation across platforms further amplifies buyers’ negotiating power and margin compression.
High qualification and switching costs
PPAP requirements and IATF 16949 certification, plus lengthy tooling validation—often 6–18 months and tooling costs commonly $200k–$1M per part—make switching suppliers costly. Once designed-in, buyers face 12–24 months and material risk to dual-source, which tempers buyer power on in-production programs. Re-sourcing typically occurs at platform refreshes every 5–7 years, when negotiation leverage increases.
Design control and specification pressure
Customers retain ownership of many part designs and tolerance specs, dictating materials and processes and driving 2024 OEM-directed BOM control estimated at 65% for key assemblies. Value engineering requests push continuous cost reductions, commonly targeting 5–10% cuts per program cycle. Open-book costing and should-cost models—now used by roughly 60% of tier-1 buyers in 2024—intensify margin pressure, forcing suppliers to prove yield and OEE improvements to defend margins.
Global footprint and logistics leverage
OEMs increasingly award volumes to suppliers with multi-region plants for risk mitigation and total-landed-cost optimization; in 2024 buyers used logistics and localization incentives as explicit negotiation levers, shifting awards geographically to capture tariff, freight and lead-time advantages. Non-local plants face direct pricing pressure to offset freight and inventory holding costs.
- Multi-region preference: mitigates disruption
- Geographic awards: optimize total landed cost
- Logistics/localization: used as negotiation levers
- Non-local plants: face pricing pressure to cover freight
EV transition and content mix shifts
Top-10 automakers concentrate spend; high tooling costs, long validation, EVs boost aluminum demand
Customers are concentrated: top 10 automakers ~60% of global production (2024), creating strong price leverage and routine 5–10% cost-down targets.
Switching costs high: PPAP/IATF 16949, tooling $200k–$1M, 6–18 months validation; re-sourcing mainly at 5–7 year platform refreshes.
EV shift: 2024 EVs ~15M (16% share) raises aluminum structural demand; early design involvement yields stickier awards.
| Metric | 2024 |
|---|---|
| Top10 automakers share | ~60% |
| EV sales | ~15M (16%) |
| Tooling cost/part | $200k–$1M |
| Validation time | 6–18 months |
| Re-source cycle | 5–7 yrs |
Preview Before You Purchase
Wencan Group Porter's Five Forces Analysis
This Porter's Five Forces analysis of Wencan Group assesses competitive rivalry, supplier and buyer power, threat of substitutes, and barriers to entry—offering strategic insight and actionable implications. This preview is the exact, fully formatted document you will receive immediately after purchase—no placeholders, no edits required.











