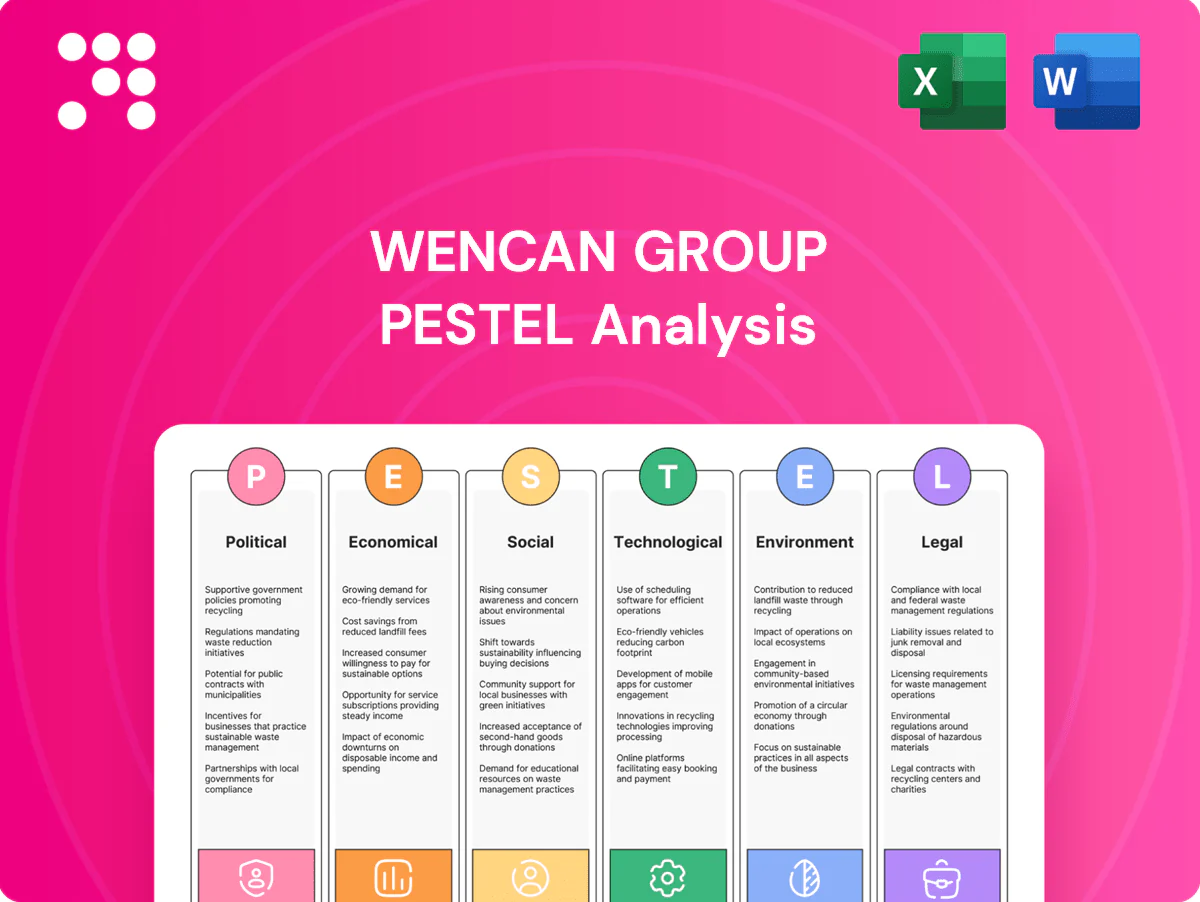
Wencan Group PESTLE Analysis

Make Smarter Strategic Decisions with a Complete PESTEL View
Unlock how macro forces shape Wencan Group's trajectory with our concise PESTLE snapshot. This analysis highlights political, economic, social, technological, legal and environmental risks and opportunities that matter to investors and strategists. Buy the full PESTLE now for the complete, actionable breakdown ready for immediate use.
Political factors

Trade policy and tariffs on aluminum and auto parts
Shifts in tariffs and anti-dumping duties—e.g., US Section 232 aluminum tariff of 10% and anti-dumping duties on some Chinese aluminum up to 48.5%—can raise Wencan Group input costs and compress margins. Exposure to US–EU–China tensions (reciprocal tariffs peaked at ~25% in 2018–19) risks sudden duty spikes. Preferential deals (USMCA, EU free‑trade corridors) enable duty‑free access to OEM hubs like Mexico and EU, boosting competitiveness. Active customs planning and diversified shipping lanes reduce disruption and duty exposure.
Industrial policy and EV incentives
Government EV subsidies and local-manufacturing incentives—with global EV sales at about 14.2 million in 2023 and China accounting for roughly 60%—boost demand for lightweight aluminum castings in battery housings and body structures. Local content rules tied to incentives push OEMs to source casting capacity regionally, accelerating localization. Sudden subsidy phase-downs or policy reversals create sharp demand volatility. Aligning closely with OEM localization plans captures these policy tailwinds.

Infrastructure and energy policy
Access to reliable, affordable power is critical for Wencan’s energy‑intensive die casting operations; China’s pledge to peak CO2 by 2030 and achieve carbon neutrality by 2060 drives grid decarbonization policies. Industrial electricity tariffs and regional grid carbon intensity directly affect operating costs and emissions intensity. Incentives for renewables and on‑site generation (China targets 25% non‑fossil electricity by 2030) can improve margins and ESG metrics. Plant siting should weigh local power mix and renewable availability; utility‑scale solar costs have fallen ~85% since 2010, improving onsite economics.

Regional geopolitical risk and supply security
Regional geopolitical frictions can halt cross-border logistics for metals, tooling and finished parts, with recent 2024 chokepoints prompting 15–30% longer lead times for some supply routes. Sanctions and export controls in 2024–25 have restricted customers and critical software, raising compliance costs. Building multi-country footprints (minimum three countries) and strategic inventories reduces concentration risk and shortens recovery times.
- 3-country production footprint
- 15–30% lead-time inflation (2024)
- dual sourcing for >80% critical materials
- strategic safety stock, rolling 6–12 months
Public procurement and local content rules
Some markets link public fleet purchases and incentives to local content, forcing OEMs like Wencan Group to shift sourcing and assembly strategies; thresholds commonly range from 30% to 60% local value-add, and by 2024 many procurement programs tied to EV incentives increased enforcement. Meeting these thresholds secures programs but requires capex and supplier development; transparent local-content reporting improves bid success. Partnerships with regional suppliers accelerate compliance and reduce time-to-market.
- Local-content thresholds: 30%–60%
- Capex/supplier development increases bid win probability
- Transparent reporting boosts procurement success
- Regional partnerships shorten compliance timelines
Tariff shocks and regionalized EV supply chains squeeze margins and raise costs
Tariff shocks (US 10% Section 232; Chinese AL anti‑dump up to 48.5%) and US‑EU‑China tensions raise input costs; 2018–19 peak reciprocal tariffs ~25%. EV demand (2023 sales 14.2M; China ~60%) and local‑content rules (30–60%) drive regionalization; power costs/carbon intensity affect margins.
| Factor | Key metric |
|---|---|
| Tariffs | 10%–48.5% |
| EV market | 14.2M (2023); China ~60% |
| Lead times (2024) | +15–30% |
| Local content | 30–60% |
What is included in the product
 Detailed Word Document
Explores how Political, Economic, Social, Technological, Environmental and Legal forces uniquely affect Wencan Group, with data-backed, region- and industry-specific insights; designed to help executives, consultants and investors identify risks, opportunities and forward-looking scenarios for strategy, funding and operational planning.

 Customizable Excel Spreadsheet
A concise, visually segmented PESTLE summary of Wencan Group that relieves meeting prep pain by being presentation-ready, easily shareable and editable for region- or business-line notes, and ideal for quick alignment across teams and planning sessions.
Economic factors

Aluminum price volatility
LME aluminum averaged about $2,300/t in 2024 and softened to roughly $2,100/t by mid‑2025, with energy surcharges adding roughly 10% to metal BOM in volatile months. Wencan’s effective hedging programs and pass‑through clauses with OEMs have preserved margins. Alloy mix and scrap recovery rates materially shift net metal cost per unit, and tight procurement–sales contract integration limits residual exposure.
Automotive cycle and model mix
Global light-vehicle production recovered to roughly 78 million units in 2024, with EVs reaching about 18% of new-car sales, increasing per-vehicle casting value and demand for aluminum and high-pressure die cast components. Program wins on premium and EV platforms boost revenue resilience by carrying higher content per vehicle and longer lifecycle margins. Model changeovers still create temporary demand swings and tooling amortization pressure, compressing near-term cash flow. A balanced program portfolio across mass, premium and EV segments smooths cyclical variability and improves capacity utilization.

Foreign exchange and global footprint
Currency swings between RMB, USD, EUR and JPY materially affect reported revenues and imported equipment costs; RMB traded roughly 6.7–7.4 per USD in 2024–H1 2025, EUR/USD averaged ~1.09 and USD/JPY hovered near 155, so FX can swing margins. Local production and sourcing provide natural hedges, pricing in customer currencies with indexation improves cashflow predictability, and treasury policies must match program life cycles to hedge timing and tenor.

Labor costs and productivity
Capital intensity and interest rates
High-pressure die-casting cells, furnaces and machining centers demand substantial capex, raising sensitivity to prevailing borrowing costs; US policy rates averaged 5.25–5.50% in 2024 and 10-year yields hovered near 4.2%, increasing financing costs for capacity and tooling. Strong utilization and long-term take-or-pay contracts materially improve ROI, while disciplined capex tied to secured programs cuts execution and demand risk.
- Capex intensity: high equipment and tooling spend
- Rates impact: 2024 Fed funds ~5.25–5.50%
- Mitigant: long-term take-or-pay contracts
- Policy: capex only for secured programs
Tariff shocks and regionalized EV supply chains squeeze margins and raise costs
LME aluminum ~2,300/t in 2024, ~2,100/t by mid‑2025; energy surcharges add ~10% to metal BOM, hedging and pass‑throughs preserved margins. Global light‑vehicle production ~78m (2024), EVs ~18% boosting aluminum content; model changeovers compress near‑term cash flow. RMB 6.7–7.4/USD, wage inflation 5–7% and robot density ~270/10,000 offset labor pressure; Fed funds ~5.25–5.50% raise capex cost.
| Metric | 2024–H1 2025 |
|---|---|
| LME aluminum | $2,300 → $2,100/t |
| Global LV prod. | ~78m units |
| EV share | ~18% |
| RMB/USD | 6.7–7.4 |
| Wage inflation | 5–7% |
| Robot density | ~270/10,000 |
| Fed funds | ~5.25–5.50% |
What You See Is What You Get
Wencan Group PESTLE Analysis
The Wencan Group PESTLE Analysis preview shown here is the exact document you’ll receive after purchase—fully formatted and professionally structured. It contains the complete political, economic, social, technological, legal and environmental assessment ready to download and use. No placeholders or surprises—what you see is the final file delivered upon checkout.

Make Smarter Strategic Decisions with a Complete PESTEL View
Unlock how macro forces shape Wencan Group's trajectory with our concise PESTLE snapshot. This analysis highlights political, economic, social, technological, legal and environmental risks and opportunities that matter to investors and strategists. Buy the full PESTLE now for the complete, actionable breakdown ready for immediate use.
Political factors
Trade policy and tariffs on aluminum and auto parts
Shifts in tariffs and anti-dumping duties—e.g., US Section 232 aluminum tariff of 10% and anti-dumping duties on some Chinese aluminum up to 48.5%—can raise Wencan Group input costs and compress margins. Exposure to US–EU–China tensions (reciprocal tariffs peaked at ~25% in 2018–19) risks sudden duty spikes. Preferential deals (USMCA, EU free‑trade corridors) enable duty‑free access to OEM hubs like Mexico and EU, boosting competitiveness. Active customs planning and diversified shipping lanes reduce disruption and duty exposure.
Industrial policy and EV incentives
Government EV subsidies and local-manufacturing incentives—with global EV sales at about 14.2 million in 2023 and China accounting for roughly 60%—boost demand for lightweight aluminum castings in battery housings and body structures. Local content rules tied to incentives push OEMs to source casting capacity regionally, accelerating localization. Sudden subsidy phase-downs or policy reversals create sharp demand volatility. Aligning closely with OEM localization plans captures these policy tailwinds.
Infrastructure and energy policy
Access to reliable, affordable power is critical for Wencan’s energy‑intensive die casting operations; China’s pledge to peak CO2 by 2030 and achieve carbon neutrality by 2060 drives grid decarbonization policies. Industrial electricity tariffs and regional grid carbon intensity directly affect operating costs and emissions intensity. Incentives for renewables and on‑site generation (China targets 25% non‑fossil electricity by 2030) can improve margins and ESG metrics. Plant siting should weigh local power mix and renewable availability; utility‑scale solar costs have fallen ~85% since 2010, improving onsite economics.
Regional geopolitical risk and supply security
Regional geopolitical frictions can halt cross-border logistics for metals, tooling and finished parts, with recent 2024 chokepoints prompting 15–30% longer lead times for some supply routes. Sanctions and export controls in 2024–25 have restricted customers and critical software, raising compliance costs. Building multi-country footprints (minimum three countries) and strategic inventories reduces concentration risk and shortens recovery times.
- 3-country production footprint
- 15–30% lead-time inflation (2024)
- dual sourcing for >80% critical materials
- strategic safety stock, rolling 6–12 months
Public procurement and local content rules
Some markets link public fleet purchases and incentives to local content, forcing OEMs like Wencan Group to shift sourcing and assembly strategies; thresholds commonly range from 30% to 60% local value-add, and by 2024 many procurement programs tied to EV incentives increased enforcement. Meeting these thresholds secures programs but requires capex and supplier development; transparent local-content reporting improves bid success. Partnerships with regional suppliers accelerate compliance and reduce time-to-market.
- Local-content thresholds: 30%–60%
- Capex/supplier development increases bid win probability
- Transparent reporting boosts procurement success
- Regional partnerships shorten compliance timelines
Tariff shocks and regionalized EV supply chains squeeze margins and raise costs
Tariff shocks (US 10% Section 232; Chinese AL anti‑dump up to 48.5%) and US‑EU‑China tensions raise input costs; 2018–19 peak reciprocal tariffs ~25%. EV demand (2023 sales 14.2M; China ~60%) and local‑content rules (30–60%) drive regionalization; power costs/carbon intensity affect margins.
| Factor | Key metric |
|---|---|
| Tariffs | 10%–48.5% |
| EV market | 14.2M (2023); China ~60% |
| Lead times (2024) | +15–30% |
| Local content | 30–60% |
What is included in the product
Detailed Word Document
Explores how Political, Economic, Social, Technological, Environmental and Legal forces uniquely affect Wencan Group, with data-backed, region- and industry-specific insights; designed to help executives, consultants and investors identify risks, opportunities and forward-looking scenarios for strategy, funding and operational planning.
Customizable Excel Spreadsheet
A concise, visually segmented PESTLE summary of Wencan Group that relieves meeting prep pain by being presentation-ready, easily shareable and editable for region- or business-line notes, and ideal for quick alignment across teams and planning sessions.
Economic factors
Aluminum price volatility
LME aluminum averaged about $2,300/t in 2024 and softened to roughly $2,100/t by mid‑2025, with energy surcharges adding roughly 10% to metal BOM in volatile months. Wencan’s effective hedging programs and pass‑through clauses with OEMs have preserved margins. Alloy mix and scrap recovery rates materially shift net metal cost per unit, and tight procurement–sales contract integration limits residual exposure.
Automotive cycle and model mix
Global light-vehicle production recovered to roughly 78 million units in 2024, with EVs reaching about 18% of new-car sales, increasing per-vehicle casting value and demand for aluminum and high-pressure die cast components. Program wins on premium and EV platforms boost revenue resilience by carrying higher content per vehicle and longer lifecycle margins. Model changeovers still create temporary demand swings and tooling amortization pressure, compressing near-term cash flow. A balanced program portfolio across mass, premium and EV segments smooths cyclical variability and improves capacity utilization.
Foreign exchange and global footprint
Currency swings between RMB, USD, EUR and JPY materially affect reported revenues and imported equipment costs; RMB traded roughly 6.7–7.4 per USD in 2024–H1 2025, EUR/USD averaged ~1.09 and USD/JPY hovered near 155, so FX can swing margins. Local production and sourcing provide natural hedges, pricing in customer currencies with indexation improves cashflow predictability, and treasury policies must match program life cycles to hedge timing and tenor.
Labor costs and productivity
Capital intensity and interest rates
High-pressure die-casting cells, furnaces and machining centers demand substantial capex, raising sensitivity to prevailing borrowing costs; US policy rates averaged 5.25–5.50% in 2024 and 10-year yields hovered near 4.2%, increasing financing costs for capacity and tooling. Strong utilization and long-term take-or-pay contracts materially improve ROI, while disciplined capex tied to secured programs cuts execution and demand risk.
- Capex intensity: high equipment and tooling spend
- Rates impact: 2024 Fed funds ~5.25–5.50%
- Mitigant: long-term take-or-pay contracts
- Policy: capex only for secured programs
Tariff shocks and regionalized EV supply chains squeeze margins and raise costs
LME aluminum ~2,300/t in 2024, ~2,100/t by mid‑2025; energy surcharges add ~10% to metal BOM, hedging and pass‑throughs preserved margins. Global light‑vehicle production ~78m (2024), EVs ~18% boosting aluminum content; model changeovers compress near‑term cash flow. RMB 6.7–7.4/USD, wage inflation 5–7% and robot density ~270/10,000 offset labor pressure; Fed funds ~5.25–5.50% raise capex cost.
| Metric | 2024–H1 2025 |
|---|---|
| LME aluminum | $2,300 → $2,100/t |
| Global LV prod. | ~78m units |
| EV share | ~18% |
| RMB/USD | 6.7–7.4 |
| Wage inflation | 5–7% |
| Robot density | ~270/10,000 |
| Fed funds | ~5.25–5.50% |
What You See Is What You Get
Wencan Group PESTLE Analysis
The Wencan Group PESTLE Analysis preview shown here is the exact document you’ll receive after purchase—fully formatted and professionally structured. It contains the complete political, economic, social, technological, legal and environmental assessment ready to download and use. No placeholders or surprises—what you see is the final file delivered upon checkout.
Original: $10.00
-65%$10.00
$3.50Description
Make Smarter Strategic Decisions with a Complete PESTEL View
Unlock how macro forces shape Wencan Group's trajectory with our concise PESTLE snapshot. This analysis highlights political, economic, social, technological, legal and environmental risks and opportunities that matter to investors and strategists. Buy the full PESTLE now for the complete, actionable breakdown ready for immediate use.
Political factors
Trade policy and tariffs on aluminum and auto parts
Shifts in tariffs and anti-dumping duties—e.g., US Section 232 aluminum tariff of 10% and anti-dumping duties on some Chinese aluminum up to 48.5%—can raise Wencan Group input costs and compress margins. Exposure to US–EU–China tensions (reciprocal tariffs peaked at ~25% in 2018–19) risks sudden duty spikes. Preferential deals (USMCA, EU free‑trade corridors) enable duty‑free access to OEM hubs like Mexico and EU, boosting competitiveness. Active customs planning and diversified shipping lanes reduce disruption and duty exposure.
Industrial policy and EV incentives
Government EV subsidies and local-manufacturing incentives—with global EV sales at about 14.2 million in 2023 and China accounting for roughly 60%—boost demand for lightweight aluminum castings in battery housings and body structures. Local content rules tied to incentives push OEMs to source casting capacity regionally, accelerating localization. Sudden subsidy phase-downs or policy reversals create sharp demand volatility. Aligning closely with OEM localization plans captures these policy tailwinds.
Infrastructure and energy policy
Access to reliable, affordable power is critical for Wencan’s energy‑intensive die casting operations; China’s pledge to peak CO2 by 2030 and achieve carbon neutrality by 2060 drives grid decarbonization policies. Industrial electricity tariffs and regional grid carbon intensity directly affect operating costs and emissions intensity. Incentives for renewables and on‑site generation (China targets 25% non‑fossil electricity by 2030) can improve margins and ESG metrics. Plant siting should weigh local power mix and renewable availability; utility‑scale solar costs have fallen ~85% since 2010, improving onsite economics.
Regional geopolitical risk and supply security
Regional geopolitical frictions can halt cross-border logistics for metals, tooling and finished parts, with recent 2024 chokepoints prompting 15–30% longer lead times for some supply routes. Sanctions and export controls in 2024–25 have restricted customers and critical software, raising compliance costs. Building multi-country footprints (minimum three countries) and strategic inventories reduces concentration risk and shortens recovery times.
- 3-country production footprint
- 15–30% lead-time inflation (2024)
- dual sourcing for >80% critical materials
- strategic safety stock, rolling 6–12 months
Public procurement and local content rules
Some markets link public fleet purchases and incentives to local content, forcing OEMs like Wencan Group to shift sourcing and assembly strategies; thresholds commonly range from 30% to 60% local value-add, and by 2024 many procurement programs tied to EV incentives increased enforcement. Meeting these thresholds secures programs but requires capex and supplier development; transparent local-content reporting improves bid success. Partnerships with regional suppliers accelerate compliance and reduce time-to-market.
- Local-content thresholds: 30%–60%
- Capex/supplier development increases bid win probability
- Transparent reporting boosts procurement success
- Regional partnerships shorten compliance timelines
Tariff shocks and regionalized EV supply chains squeeze margins and raise costs
Tariff shocks (US 10% Section 232; Chinese AL anti‑dump up to 48.5%) and US‑EU‑China tensions raise input costs; 2018–19 peak reciprocal tariffs ~25%. EV demand (2023 sales 14.2M; China ~60%) and local‑content rules (30–60%) drive regionalization; power costs/carbon intensity affect margins.
| Factor | Key metric |
|---|---|
| Tariffs | 10%–48.5% |
| EV market | 14.2M (2023); China ~60% |
| Lead times (2024) | +15–30% |
| Local content | 30–60% |
What is included in the product
Detailed Word Document
Explores how Political, Economic, Social, Technological, Environmental and Legal forces uniquely affect Wencan Group, with data-backed, region- and industry-specific insights; designed to help executives, consultants and investors identify risks, opportunities and forward-looking scenarios for strategy, funding and operational planning.
Customizable Excel Spreadsheet
A concise, visually segmented PESTLE summary of Wencan Group that relieves meeting prep pain by being presentation-ready, easily shareable and editable for region- or business-line notes, and ideal for quick alignment across teams and planning sessions.
Economic factors
Aluminum price volatility
LME aluminum averaged about $2,300/t in 2024 and softened to roughly $2,100/t by mid‑2025, with energy surcharges adding roughly 10% to metal BOM in volatile months. Wencan’s effective hedging programs and pass‑through clauses with OEMs have preserved margins. Alloy mix and scrap recovery rates materially shift net metal cost per unit, and tight procurement–sales contract integration limits residual exposure.
Automotive cycle and model mix
Global light-vehicle production recovered to roughly 78 million units in 2024, with EVs reaching about 18% of new-car sales, increasing per-vehicle casting value and demand for aluminum and high-pressure die cast components. Program wins on premium and EV platforms boost revenue resilience by carrying higher content per vehicle and longer lifecycle margins. Model changeovers still create temporary demand swings and tooling amortization pressure, compressing near-term cash flow. A balanced program portfolio across mass, premium and EV segments smooths cyclical variability and improves capacity utilization.
Foreign exchange and global footprint
Currency swings between RMB, USD, EUR and JPY materially affect reported revenues and imported equipment costs; RMB traded roughly 6.7–7.4 per USD in 2024–H1 2025, EUR/USD averaged ~1.09 and USD/JPY hovered near 155, so FX can swing margins. Local production and sourcing provide natural hedges, pricing in customer currencies with indexation improves cashflow predictability, and treasury policies must match program life cycles to hedge timing and tenor.
Labor costs and productivity
Capital intensity and interest rates
High-pressure die-casting cells, furnaces and machining centers demand substantial capex, raising sensitivity to prevailing borrowing costs; US policy rates averaged 5.25–5.50% in 2024 and 10-year yields hovered near 4.2%, increasing financing costs for capacity and tooling. Strong utilization and long-term take-or-pay contracts materially improve ROI, while disciplined capex tied to secured programs cuts execution and demand risk.
- Capex intensity: high equipment and tooling spend
- Rates impact: 2024 Fed funds ~5.25–5.50%
- Mitigant: long-term take-or-pay contracts
- Policy: capex only for secured programs
Tariff shocks and regionalized EV supply chains squeeze margins and raise costs
LME aluminum ~2,300/t in 2024, ~2,100/t by mid‑2025; energy surcharges add ~10% to metal BOM, hedging and pass‑throughs preserved margins. Global light‑vehicle production ~78m (2024), EVs ~18% boosting aluminum content; model changeovers compress near‑term cash flow. RMB 6.7–7.4/USD, wage inflation 5–7% and robot density ~270/10,000 offset labor pressure; Fed funds ~5.25–5.50% raise capex cost.
| Metric | 2024–H1 2025 |
|---|---|
| LME aluminum | $2,300 → $2,100/t |
| Global LV prod. | ~78m units |
| EV share | ~18% |
| RMB/USD | 6.7–7.4 |
| Wage inflation | 5–7% |
| Robot density | ~270/10,000 |
| Fed funds | ~5.25–5.50% |
What You See Is What You Get
Wencan Group PESTLE Analysis
The Wencan Group PESTLE Analysis preview shown here is the exact document you’ll receive after purchase—fully formatted and professionally structured. It contains the complete political, economic, social, technological, legal and environmental assessment ready to download and use. No placeholders or surprises—what you see is the final file delivered upon checkout.











