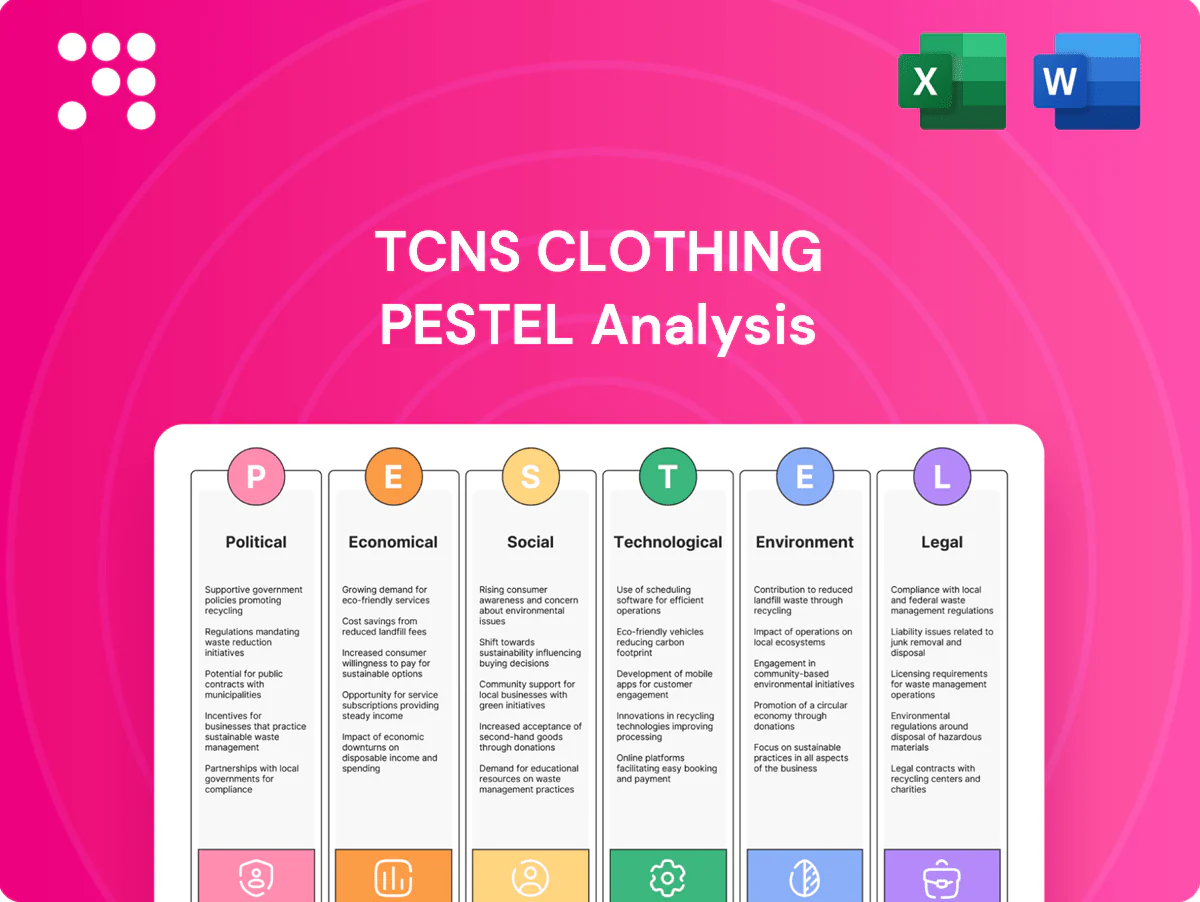
TCNS Clothing PESTLE Analysis

Your Shortcut to Market Insight Starts Here
Gain a competitive edge with our PESTLE Analysis of TCNS Clothing—concise, research-driven insight into political, economic, social, technological, legal, and environmental forces shaping its future. Ideal for investors and strategists; download the full report now for actionable, ready-to-use intelligence.
Political factors

Stable GST regime
Consistency in GST slabs (5%, 12%, 18% as retained into 2025) directly shapes TCNS Clothing pricing, margins and demand elasticity across value and premium segments. Rate hikes on value tiers would likely dent Aurelia volumes, while rationalization supports premium W and Wishful pricing power. Smooth input tax credit flows are vital for working capital and vendor alignment and policy clarity lowers compliance friction for EBOs and online channels.
Import duties on textiles
Customs duties on fabrics, trims and machinery in India typically range from 5–20%, materially raising sourcing costs and shaping TCNS Clothing’s product mix. Higher tariffs incentivize local procurement, constraining quality choices and extending lead times, while duty drawback and RoDTEP export incentives (rates up to ~3.5%) can partially offset costs for limited overseas sales. Any abrupt tariff shifts can disrupt seasonal drops and festive collections that often drive 30–40% of peak-period sales.

State retail regulations
State Shop and Establishment laws, store operating hours and festival-permit norms differ across India’s 28 states and 8 union territories, creating variable compliance windows for TCNS Clothing. Election cycles (eg, 2024 Lok Sabha Model Code of Conduct) impose curb timings and ad restrictions that dent footfall. Post-GST (2017) many local levies fell but municipal signage rules and local body fees still shape rollout economics, raising compliance complexity for pan‑India EBO/MBO networks.

Government textile schemes
PLI for textiles (central allocation 10,683 crore INR) and the PM MITRA initiative (7 mega textile parks) plus skill development programs lower manufacturing costs and upgrade capabilities for players like TCNS Clothing; subsidies for modern looms and effluent treatment boost product quality and sustainability, though access relies on eligibility and timely execution.
- PLI: 10,683 crore INR
- PM MITRA: 7 mega parks
- Skills: capacity & upskilling support
- Risk: eligibility, delays
- Benefit: stabilized peak-season capacity via cluster partnerships
Geopolitics and logistics
Geopolitics and logistics raise costs and lead times for TCNS: Red Sea disruptions and Suez diversions pushed some container rates and transit times sharply in 2023–24, while insurance premiums for risky routes rose over 200% on affected voyages; fuel price volatility and trade restrictions also tighten access to specialty fabrics and trims.
- Inbound materials: route diversions increased transit time and cost
- Fuel/insurance: premiums spiked >200% on high-risk routes
- Sourcing: near-shoring/diversification reduces India-focused risk
GST 5/12/18% and customs 5–20% squeeze margins; freight > 200%
GST slabs (5/12/18% retained into 2025) anchor pricing and margins; customs duties 5–20% raise sourcing costs while RoDTEP ~3.5% offers limited offset. PLI 10,683 crore and PM MITRA 7 parks lower manufacturing costs but depend on eligibility; Red Sea disruptions pushed insurance/freight premiums >200% in 2023–24, forcing near‑shoring.
| Factor | Metric | Impact |
|---|---|---|
| GST | 5/12/18% | Pricing/margins |
| Customs | 5–20% | Sourcing cost |
| PLI/PM MITRA | 10,683 cr / 7 parks | Capex/capability |
| Geopolitics | +200% insurance | Transit cost/time |
What is included in the product
 Detailed Word Document
Provides a concise PESTLE overview of how Political, Economic, Social, Technological, Environmental and Legal forces shape TCNS Clothing, with data-backed, region-specific insights and forward-looking implications to help executives, investors and strategists identify risks, opportunities and actionable scenarios.

 Customizable Excel Spreadsheet
A concise, visually segmented PESTLE summary for TCNS Clothing that’s easily editable and shareable—ideal for quick alignment across teams, supporting external-risk discussions, and dropping straight into presentations or planning packs.
Economic factors

Disposable income trends
Rising disposable incomes alongside India’s 7.2% GDP growth in FY24 have expanded middle‑class demand, boosting organized ethnic wear penetration. Economic slowdowns compress discretionary spends, shifting buyers to value lines and promotions. Festival and wedding seasons heighten sensitivity to macro swings, while resilient Tier‑2/3 markets often cushion metro weakness.
Inflation and input costs
Cotton (+12% y/y), viscose (+8% y/y), dyes (+15% y/y) and energy (+10% y/y) inflation in 2024 have materially compressed TCNS Clothing gross margins, forcing margin pressure across the portfolio.
Price hikes risk volume loss in price-sensitive segments, with mid-market consumers most vulnerable and discretionary volumes likely to decline.
Efficient assortment planning and tougher vendor negotiations are critical to protect margins, while strict markdown discipline limits erosion during demand softness.

Currency and import exposure
Rupee weakness — INR traded near 82–83 per USD in 2024–25 — raises landed costs for imported fabric, trims and tech tools, squeezing margins. TCNS mitigates via FX hedging and increased local sourcing, lowering import volatility. Currency swings also alter cross-border online pricing and marketplace fees, while a stable INR enables predictable seasonal pricing.

Interest rates and credit
Higher policy rates — RBI repo at 6.5% as of June 2025 — elevate TCNS Clothing’s working-capital costs across lengthy design-to-delivery cycles, forcing tighter receivables and payables management. Store expansion and refurbishment capex become more selective while supplier financing terms and faster inventory turns gain strategic importance. Strong cash-conversion cycles are crucial to fund marketing and digital investments without high-cost borrowing.
- Working-capital squeeze
- Selective capex
- Supplier finance focus
- Prioritise cash conversion
E-commerce growth dynamics
Online demand widens TCNS Clothing’s reach but raises returns (apparel returns often 30–40%) and compresses take-rates as marketplaces charge 8–15% commissions. Omnichannel margins hinge on last-mile (≈8–12% of order value), payment fees and disciplined discounting. Marketplaces can dilute brand equity without assortment control, while owned D2C sites boost data capture and can lift customer LTV by ~20–40%.
- Returns: 30–40%
- Marketplace fees: 8–15%
- Last-mile cost: 8–12%
- D2C LTV gain: 20–40%
GST 5/12/18% and customs 5–20% squeeze margins; freight > 200%
India GDP 7.2% FY24 boosts middle‑class demand; slowdowns shift buyers to value tiers. Input inflation (cotton +12%, viscose +8%, dyes +15%, energy +10% in 2024) squeezed margins. INR 82–83/USD and RBI repo 6.5% (Jun 2025) raise landed costs and W‑cap rates; online returns 30–40% and marketplace fees 8–15% compress omnichannel profitability.
| Metric | Value |
|---|---|
| GDP FY24 | 7.2% |
| Cotton 2024 | +12% y/y |
| INR/USD 2024–25 | 82–83 |
| RBI repo Jun 2025 | 6.5% |
Preview the Actual Deliverable
TCNS Clothing PESTLE Analysis
This TCNS Clothing PESTLE Analysis preview is the exact document you’ll receive after purchase—fully formatted and ready to use. The layout, content, and structure visible here are exactly what you’ll be able to download immediately after buying. No placeholders or teasers—this is the final, professionally structured file you’ll own upon checkout.

Your Shortcut to Market Insight Starts Here
Gain a competitive edge with our PESTLE Analysis of TCNS Clothing—concise, research-driven insight into political, economic, social, technological, legal, and environmental forces shaping its future. Ideal for investors and strategists; download the full report now for actionable, ready-to-use intelligence.
Political factors
Stable GST regime
Consistency in GST slabs (5%, 12%, 18% as retained into 2025) directly shapes TCNS Clothing pricing, margins and demand elasticity across value and premium segments. Rate hikes on value tiers would likely dent Aurelia volumes, while rationalization supports premium W and Wishful pricing power. Smooth input tax credit flows are vital for working capital and vendor alignment and policy clarity lowers compliance friction for EBOs and online channels.
Import duties on textiles
Customs duties on fabrics, trims and machinery in India typically range from 5–20%, materially raising sourcing costs and shaping TCNS Clothing’s product mix. Higher tariffs incentivize local procurement, constraining quality choices and extending lead times, while duty drawback and RoDTEP export incentives (rates up to ~3.5%) can partially offset costs for limited overseas sales. Any abrupt tariff shifts can disrupt seasonal drops and festive collections that often drive 30–40% of peak-period sales.
State retail regulations
State Shop and Establishment laws, store operating hours and festival-permit norms differ across India’s 28 states and 8 union territories, creating variable compliance windows for TCNS Clothing. Election cycles (eg, 2024 Lok Sabha Model Code of Conduct) impose curb timings and ad restrictions that dent footfall. Post-GST (2017) many local levies fell but municipal signage rules and local body fees still shape rollout economics, raising compliance complexity for pan‑India EBO/MBO networks.
Government textile schemes
PLI for textiles (central allocation 10,683 crore INR) and the PM MITRA initiative (7 mega textile parks) plus skill development programs lower manufacturing costs and upgrade capabilities for players like TCNS Clothing; subsidies for modern looms and effluent treatment boost product quality and sustainability, though access relies on eligibility and timely execution.
- PLI: 10,683 crore INR
- PM MITRA: 7 mega parks
- Skills: capacity & upskilling support
- Risk: eligibility, delays
- Benefit: stabilized peak-season capacity via cluster partnerships
Geopolitics and logistics
Geopolitics and logistics raise costs and lead times for TCNS: Red Sea disruptions and Suez diversions pushed some container rates and transit times sharply in 2023–24, while insurance premiums for risky routes rose over 200% on affected voyages; fuel price volatility and trade restrictions also tighten access to specialty fabrics and trims.
- Inbound materials: route diversions increased transit time and cost
- Fuel/insurance: premiums spiked >200% on high-risk routes
- Sourcing: near-shoring/diversification reduces India-focused risk
GST 5/12/18% and customs 5–20% squeeze margins; freight > 200%
GST slabs (5/12/18% retained into 2025) anchor pricing and margins; customs duties 5–20% raise sourcing costs while RoDTEP ~3.5% offers limited offset. PLI 10,683 crore and PM MITRA 7 parks lower manufacturing costs but depend on eligibility; Red Sea disruptions pushed insurance/freight premiums >200% in 2023–24, forcing near‑shoring.
| Factor | Metric | Impact |
|---|---|---|
| GST | 5/12/18% | Pricing/margins |
| Customs | 5–20% | Sourcing cost |
| PLI/PM MITRA | 10,683 cr / 7 parks | Capex/capability |
| Geopolitics | +200% insurance | Transit cost/time |
What is included in the product
Detailed Word Document
Provides a concise PESTLE overview of how Political, Economic, Social, Technological, Environmental and Legal forces shape TCNS Clothing, with data-backed, region-specific insights and forward-looking implications to help executives, investors and strategists identify risks, opportunities and actionable scenarios.
Customizable Excel Spreadsheet
A concise, visually segmented PESTLE summary for TCNS Clothing that’s easily editable and shareable—ideal for quick alignment across teams, supporting external-risk discussions, and dropping straight into presentations or planning packs.
Economic factors
Disposable income trends
Rising disposable incomes alongside India’s 7.2% GDP growth in FY24 have expanded middle‑class demand, boosting organized ethnic wear penetration. Economic slowdowns compress discretionary spends, shifting buyers to value lines and promotions. Festival and wedding seasons heighten sensitivity to macro swings, while resilient Tier‑2/3 markets often cushion metro weakness.
Inflation and input costs
Cotton (+12% y/y), viscose (+8% y/y), dyes (+15% y/y) and energy (+10% y/y) inflation in 2024 have materially compressed TCNS Clothing gross margins, forcing margin pressure across the portfolio.
Price hikes risk volume loss in price-sensitive segments, with mid-market consumers most vulnerable and discretionary volumes likely to decline.
Efficient assortment planning and tougher vendor negotiations are critical to protect margins, while strict markdown discipline limits erosion during demand softness.
Currency and import exposure
Rupee weakness — INR traded near 82–83 per USD in 2024–25 — raises landed costs for imported fabric, trims and tech tools, squeezing margins. TCNS mitigates via FX hedging and increased local sourcing, lowering import volatility. Currency swings also alter cross-border online pricing and marketplace fees, while a stable INR enables predictable seasonal pricing.
Interest rates and credit
Higher policy rates — RBI repo at 6.5% as of June 2025 — elevate TCNS Clothing’s working-capital costs across lengthy design-to-delivery cycles, forcing tighter receivables and payables management. Store expansion and refurbishment capex become more selective while supplier financing terms and faster inventory turns gain strategic importance. Strong cash-conversion cycles are crucial to fund marketing and digital investments without high-cost borrowing.
- Working-capital squeeze
- Selective capex
- Supplier finance focus
- Prioritise cash conversion
E-commerce growth dynamics
Online demand widens TCNS Clothing’s reach but raises returns (apparel returns often 30–40%) and compresses take-rates as marketplaces charge 8–15% commissions. Omnichannel margins hinge on last-mile (≈8–12% of order value), payment fees and disciplined discounting. Marketplaces can dilute brand equity without assortment control, while owned D2C sites boost data capture and can lift customer LTV by ~20–40%.
- Returns: 30–40%
- Marketplace fees: 8–15%
- Last-mile cost: 8–12%
- D2C LTV gain: 20–40%
GST 5/12/18% and customs 5–20% squeeze margins; freight > 200%
India GDP 7.2% FY24 boosts middle‑class demand; slowdowns shift buyers to value tiers. Input inflation (cotton +12%, viscose +8%, dyes +15%, energy +10% in 2024) squeezed margins. INR 82–83/USD and RBI repo 6.5% (Jun 2025) raise landed costs and W‑cap rates; online returns 30–40% and marketplace fees 8–15% compress omnichannel profitability.
| Metric | Value |
|---|---|
| GDP FY24 | 7.2% |
| Cotton 2024 | +12% y/y |
| INR/USD 2024–25 | 82–83 |
| RBI repo Jun 2025 | 6.5% |
Preview the Actual Deliverable
TCNS Clothing PESTLE Analysis
This TCNS Clothing PESTLE Analysis preview is the exact document you’ll receive after purchase—fully formatted and ready to use. The layout, content, and structure visible here are exactly what you’ll be able to download immediately after buying. No placeholders or teasers—this is the final, professionally structured file you’ll own upon checkout.
Original: $10.00
-65%$10.00
$3.50Description
Your Shortcut to Market Insight Starts Here
Gain a competitive edge with our PESTLE Analysis of TCNS Clothing—concise, research-driven insight into political, economic, social, technological, legal, and environmental forces shaping its future. Ideal for investors and strategists; download the full report now for actionable, ready-to-use intelligence.
Political factors
Stable GST regime
Consistency in GST slabs (5%, 12%, 18% as retained into 2025) directly shapes TCNS Clothing pricing, margins and demand elasticity across value and premium segments. Rate hikes on value tiers would likely dent Aurelia volumes, while rationalization supports premium W and Wishful pricing power. Smooth input tax credit flows are vital for working capital and vendor alignment and policy clarity lowers compliance friction for EBOs and online channels.
Import duties on textiles
Customs duties on fabrics, trims and machinery in India typically range from 5–20%, materially raising sourcing costs and shaping TCNS Clothing’s product mix. Higher tariffs incentivize local procurement, constraining quality choices and extending lead times, while duty drawback and RoDTEP export incentives (rates up to ~3.5%) can partially offset costs for limited overseas sales. Any abrupt tariff shifts can disrupt seasonal drops and festive collections that often drive 30–40% of peak-period sales.
State retail regulations
State Shop and Establishment laws, store operating hours and festival-permit norms differ across India’s 28 states and 8 union territories, creating variable compliance windows for TCNS Clothing. Election cycles (eg, 2024 Lok Sabha Model Code of Conduct) impose curb timings and ad restrictions that dent footfall. Post-GST (2017) many local levies fell but municipal signage rules and local body fees still shape rollout economics, raising compliance complexity for pan‑India EBO/MBO networks.
Government textile schemes
PLI for textiles (central allocation 10,683 crore INR) and the PM MITRA initiative (7 mega textile parks) plus skill development programs lower manufacturing costs and upgrade capabilities for players like TCNS Clothing; subsidies for modern looms and effluent treatment boost product quality and sustainability, though access relies on eligibility and timely execution.
- PLI: 10,683 crore INR
- PM MITRA: 7 mega parks
- Skills: capacity & upskilling support
- Risk: eligibility, delays
- Benefit: stabilized peak-season capacity via cluster partnerships
Geopolitics and logistics
Geopolitics and logistics raise costs and lead times for TCNS: Red Sea disruptions and Suez diversions pushed some container rates and transit times sharply in 2023–24, while insurance premiums for risky routes rose over 200% on affected voyages; fuel price volatility and trade restrictions also tighten access to specialty fabrics and trims.
- Inbound materials: route diversions increased transit time and cost
- Fuel/insurance: premiums spiked >200% on high-risk routes
- Sourcing: near-shoring/diversification reduces India-focused risk
GST 5/12/18% and customs 5–20% squeeze margins; freight > 200%
GST slabs (5/12/18% retained into 2025) anchor pricing and margins; customs duties 5–20% raise sourcing costs while RoDTEP ~3.5% offers limited offset. PLI 10,683 crore and PM MITRA 7 parks lower manufacturing costs but depend on eligibility; Red Sea disruptions pushed insurance/freight premiums >200% in 2023–24, forcing near‑shoring.
| Factor | Metric | Impact |
|---|---|---|
| GST | 5/12/18% | Pricing/margins |
| Customs | 5–20% | Sourcing cost |
| PLI/PM MITRA | 10,683 cr / 7 parks | Capex/capability |
| Geopolitics | +200% insurance | Transit cost/time |
What is included in the product
Detailed Word Document
Provides a concise PESTLE overview of how Political, Economic, Social, Technological, Environmental and Legal forces shape TCNS Clothing, with data-backed, region-specific insights and forward-looking implications to help executives, investors and strategists identify risks, opportunities and actionable scenarios.
Customizable Excel Spreadsheet
A concise, visually segmented PESTLE summary for TCNS Clothing that’s easily editable and shareable—ideal for quick alignment across teams, supporting external-risk discussions, and dropping straight into presentations or planning packs.
Economic factors
Disposable income trends
Rising disposable incomes alongside India’s 7.2% GDP growth in FY24 have expanded middle‑class demand, boosting organized ethnic wear penetration. Economic slowdowns compress discretionary spends, shifting buyers to value lines and promotions. Festival and wedding seasons heighten sensitivity to macro swings, while resilient Tier‑2/3 markets often cushion metro weakness.
Inflation and input costs
Cotton (+12% y/y), viscose (+8% y/y), dyes (+15% y/y) and energy (+10% y/y) inflation in 2024 have materially compressed TCNS Clothing gross margins, forcing margin pressure across the portfolio.
Price hikes risk volume loss in price-sensitive segments, with mid-market consumers most vulnerable and discretionary volumes likely to decline.
Efficient assortment planning and tougher vendor negotiations are critical to protect margins, while strict markdown discipline limits erosion during demand softness.
Currency and import exposure
Rupee weakness — INR traded near 82–83 per USD in 2024–25 — raises landed costs for imported fabric, trims and tech tools, squeezing margins. TCNS mitigates via FX hedging and increased local sourcing, lowering import volatility. Currency swings also alter cross-border online pricing and marketplace fees, while a stable INR enables predictable seasonal pricing.
Interest rates and credit
Higher policy rates — RBI repo at 6.5% as of June 2025 — elevate TCNS Clothing’s working-capital costs across lengthy design-to-delivery cycles, forcing tighter receivables and payables management. Store expansion and refurbishment capex become more selective while supplier financing terms and faster inventory turns gain strategic importance. Strong cash-conversion cycles are crucial to fund marketing and digital investments without high-cost borrowing.
- Working-capital squeeze
- Selective capex
- Supplier finance focus
- Prioritise cash conversion
E-commerce growth dynamics
Online demand widens TCNS Clothing’s reach but raises returns (apparel returns often 30–40%) and compresses take-rates as marketplaces charge 8–15% commissions. Omnichannel margins hinge on last-mile (≈8–12% of order value), payment fees and disciplined discounting. Marketplaces can dilute brand equity without assortment control, while owned D2C sites boost data capture and can lift customer LTV by ~20–40%.
- Returns: 30–40%
- Marketplace fees: 8–15%
- Last-mile cost: 8–12%
- D2C LTV gain: 20–40%
GST 5/12/18% and customs 5–20% squeeze margins; freight > 200%
India GDP 7.2% FY24 boosts middle‑class demand; slowdowns shift buyers to value tiers. Input inflation (cotton +12%, viscose +8%, dyes +15%, energy +10% in 2024) squeezed margins. INR 82–83/USD and RBI repo 6.5% (Jun 2025) raise landed costs and W‑cap rates; online returns 30–40% and marketplace fees 8–15% compress omnichannel profitability.
| Metric | Value |
|---|---|
| GDP FY24 | 7.2% |
| Cotton 2024 | +12% y/y |
| INR/USD 2024–25 | 82–83 |
| RBI repo Jun 2025 | 6.5% |
Preview the Actual Deliverable
TCNS Clothing PESTLE Analysis
This TCNS Clothing PESTLE Analysis preview is the exact document you’ll receive after purchase—fully formatted and ready to use. The layout, content, and structure visible here are exactly what you’ll be able to download immediately after buying. No placeholders or teasers—this is the final, professionally structured file you’ll own upon checkout.











