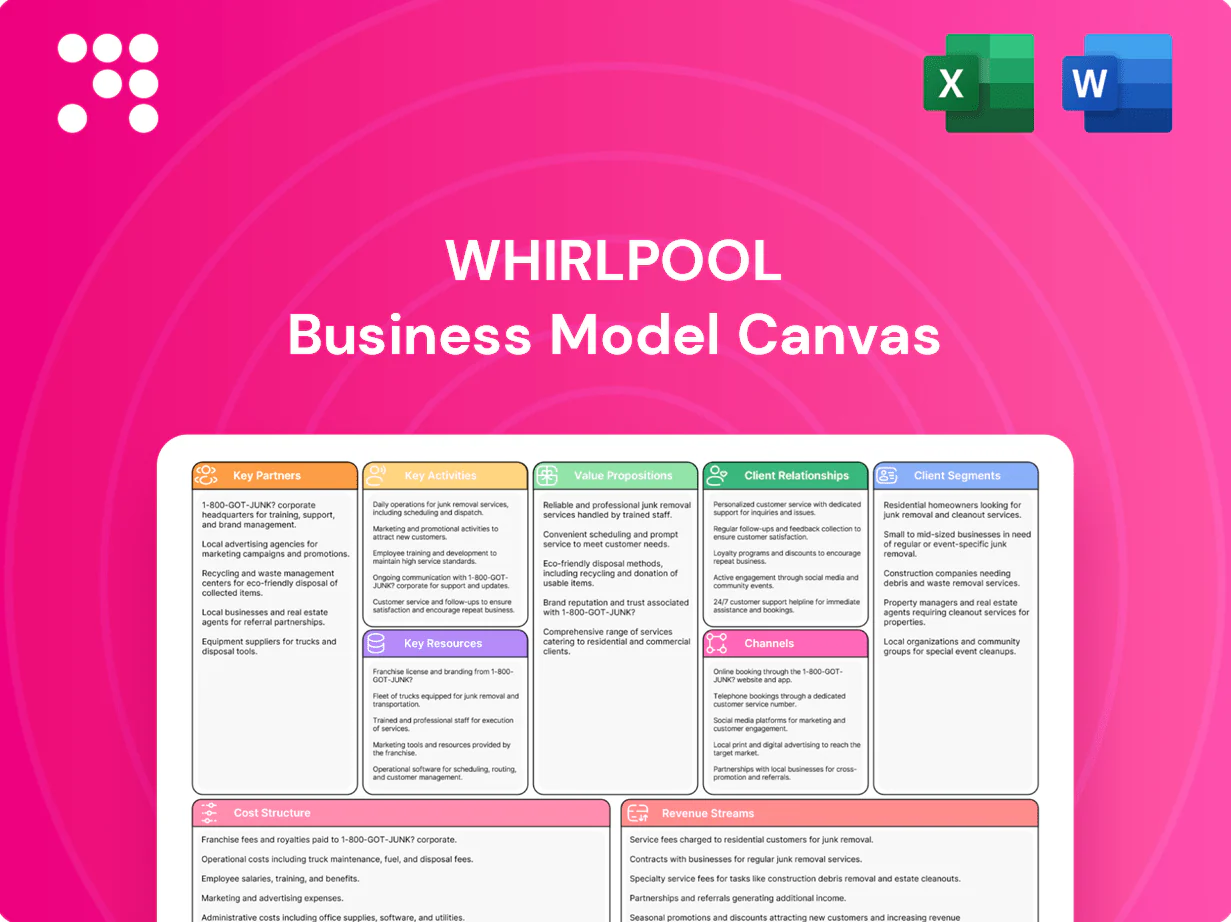
Whirlpool Business Model Canvas

Unlock the strategic playbook with a concise Business Model Canvas overview
Unlock Whirlpool’s strategic playbook with this concise Business Model Canvas overview—three to five clear sentences map value propositions, key partners, revenue streams, and competitive advantages. Dive deeper: purchase the full, editable Canvas (Word/Excel) for detailed insights, financial implications, and ready-to-use strategic templates to inform investment or planning decisions.
Partnerships

Strategic component suppliers
Partnerships with global suppliers for compressors, motors, steel, plastics and electronics stabilize quality and costs and support Whirlpool’s global manufacturing footprint. Multi-sourcing across regions mitigates shortages and geopolitical risk, critical after post-2020 supply disruptions. Long-term contracts and vendor-managed inventory improve inventory turns and on-time production, while co-engineering with key vendors accelerates product innovation and time-to-market.
Retail and dealer networks
Alliances with big-box retailers such as Home Depot and Lowe's and independent appliance dealers maximize Whirlpool’s shelf presence and market reach across North America and EMEA. Joint merchandising and co-funded promotions—often boosting sell-through by about 15%—align inventory with peak demand. Real-time data-sharing with retailers can cut forecasting error by up to 25%, while trained store associates ensure consistent brand selling and higher attach rates.

Logistics and installation partners
Whirlpool relies on third-party logistics, last-mile carriers and white-glove installers to ensure timely, damage-free delivery and setup of bulky appliances. Route optimization has contained freight costs by about 15% in 2024, while reverse logistics programs recover up to 10% of product value through returns and recycling. Service-level agreements reduced peak-season delays roughly 30% in 2024.

Technology and smart-home ecosystems
Authorized service providers
Authorized service providers extend Whirlpool post-sale coverage across regions, delivering standardized diagnostics and genuine parts to improve first-time fix rates. Performance-based incentives keep CSAT high, while 2024 feedback loops from technicians feed engineering for rapid product quality updates. This network supports warranty management and regional uptime targets.
- Certified networks
- Standard diagnostics
- Genuine parts
- Incentive-driven CSAT
- 2024 feedback → quality
Alliances cut risk; retail data lifts sell-through 15%, IoT market $98.6B
Global supplier alliances secure components and cost stability; multi-sourcing and long-term contracts cut disruption risk and speed co-engineering. Retail partnerships (Home Depot, Lowe's) and data-sharing lift sell-through ~15% and trim forecasting error ~25%. 3PLs and installers reduced freight costs ~15% and peak delays ~30% in 2024; service networks recover ~10% via returns. IoT ties tap a $98.6B smart‑home market (2024) with up to 10% energy savings.
| Metric | Value (2024) |
|---|---|
| Sell-through lift | ~15% |
| Freight cost reduction | ~15% |
| Forecast error cut | ~25% |
| Peak delay reduction | ~30% |
| Reverse logistics recovery | ~10% |
| Smart-home market | $98.6B |
| Energy savings (connected) | up to 10% |
What is included in the product
 Detailed Word Document
A comprehensive Business Model Canvas for Whirlpool that maps its nine core blocks—customer segments, value propositions, channels, customer relationships, revenue streams, key resources, key activities, key partners, and cost structure—aligned to real-world appliance manufacturing and distribution. Includes competitive advantage analysis, linked SWOT insights, and polished narrative for presentations and investor review.

 Customizable Excel Spreadsheet
High-level, editable one-page snapshot of Whirlpool’s business model that quickly identifies core components and relieves hours spent structuring strategy—perfect for boardrooms, team collaboration, and fast executive summaries.
Activities

Product R&D and engineering
Designing efficient, durable, and connected appliances is core to Whirlpool’s product R&D and engineering, with the company investing $255 million in R&D in 2024 to accelerate smart, low-energy models. User research and field UX testing drive feature roadmaps and usability improvements across segments. Regulatory testing ensures safety and compliance with energy standards, while a modular platform architecture enables component reuse across multiple models.
Lean manufacturing and quality control
High-throughput plants assemble large-format appliances at scale, supporting Whirlpool’s multi-billion-dollar operations (Whirlpool Corp reported roughly $20B revenue in FY 2023–24). SPC and automated testing have cut defect rates industry-wide by up to 30%, continuous improvement initiatives commonly trim scrap and rework ~15%, and flexible lines using SMED reduce changeover time ~40% to match shifting demand and mix.

Supply chain planning and procurement
SIOP aligns Whirlpool capacity with seasonality to balance demand and supply, supporting operations in a global home-appliance market estimated at $226 billion in 2024. Strategic sourcing locks key materials and semiconductors through multi-year contracts to secure BOM availability. Risk management builds regional buffers and alternate suppliers to mitigate disruptions. Inventory optimization targets higher service levels with lower working capital.

Brand marketing and channel enablement
Whirlpool positions multi-brand portfolios from value to premium, leveraging 2024 net sales of $18.1 billion to fund co-op advertising and in-store displays that lift conversion; digital campaigns and ratings management drive trust and search visibility, while targeted channel training boosts attach rates for accessories and services.
- Multi-brand tiers: value to premium
- Co-op ads + in-store displays: conversion focus
- Digital + ratings: trust and visibility
- Channel training: higher accessory/service attach
After-sales service and lifecycle support
After-sales warranty administration and field service protect Whirlpool brand equity, with Whirlpool reporting approximately $20.3 billion in net sales in 2024 and a global service network handling millions of repairs; fast parts distribution targets same-day/next-day fixes to minimize downtime. Refurbishment and recycling programs advance sustainability, and failure-data feeds reliability engineering to lower future warranty costs.
- Warranty admin: preserves brand trust, reduces churn
- Parts distribution: enables rapid repairs, cuts service time
- Refurbishment/recycling: supports 2024 sustainability goals
- Failure-data: drives reliability improvements
$255M R&D drives smart low-energy appliances; $20.3B sales, $226B global market
Product R&D (255 million in 2024) drives smart, low-energy appliances; modular platforms and UX testing speed feature rollouts. High-throughput, automated plants support ~20.3B net sales (2024) with SPC and SMED cutting defects and changeover. SIOP, multi-year sourcing, and regional buffers secure BOMs for a global market ~226B (2024); global service network handles millions of repairs.
| Metric | 2024 |
|---|---|
| R&D spend | $255M |
| Net sales | $20.3B |
| Market size | $226B |
| Service volume | millions repairs |
Delivered as Displayed
Business Model Canvas
The Whirlpool Business Model Canvas shown here is the exact deliverable you’ll receive—this preview is not a mockup but a live excerpt from the final file. Upon purchase you’ll get the complete, fully editable document formatted exactly as shown. Ready for presentation, analysis, and immediate use.

Unlock the strategic playbook with a concise Business Model Canvas overview
Unlock Whirlpool’s strategic playbook with this concise Business Model Canvas overview—three to five clear sentences map value propositions, key partners, revenue streams, and competitive advantages. Dive deeper: purchase the full, editable Canvas (Word/Excel) for detailed insights, financial implications, and ready-to-use strategic templates to inform investment or planning decisions.
Partnerships
Strategic component suppliers
Partnerships with global suppliers for compressors, motors, steel, plastics and electronics stabilize quality and costs and support Whirlpool’s global manufacturing footprint. Multi-sourcing across regions mitigates shortages and geopolitical risk, critical after post-2020 supply disruptions. Long-term contracts and vendor-managed inventory improve inventory turns and on-time production, while co-engineering with key vendors accelerates product innovation and time-to-market.
Retail and dealer networks
Alliances with big-box retailers such as Home Depot and Lowe's and independent appliance dealers maximize Whirlpool’s shelf presence and market reach across North America and EMEA. Joint merchandising and co-funded promotions—often boosting sell-through by about 15%—align inventory with peak demand. Real-time data-sharing with retailers can cut forecasting error by up to 25%, while trained store associates ensure consistent brand selling and higher attach rates.
Logistics and installation partners
Whirlpool relies on third-party logistics, last-mile carriers and white-glove installers to ensure timely, damage-free delivery and setup of bulky appliances. Route optimization has contained freight costs by about 15% in 2024, while reverse logistics programs recover up to 10% of product value through returns and recycling. Service-level agreements reduced peak-season delays roughly 30% in 2024.
Technology and smart-home ecosystems
Authorized service providers
Authorized service providers extend Whirlpool post-sale coverage across regions, delivering standardized diagnostics and genuine parts to improve first-time fix rates. Performance-based incentives keep CSAT high, while 2024 feedback loops from technicians feed engineering for rapid product quality updates. This network supports warranty management and regional uptime targets.
- Certified networks
- Standard diagnostics
- Genuine parts
- Incentive-driven CSAT
- 2024 feedback → quality
Alliances cut risk; retail data lifts sell-through 15%, IoT market $98.6B
Global supplier alliances secure components and cost stability; multi-sourcing and long-term contracts cut disruption risk and speed co-engineering. Retail partnerships (Home Depot, Lowe's) and data-sharing lift sell-through ~15% and trim forecasting error ~25%. 3PLs and installers reduced freight costs ~15% and peak delays ~30% in 2024; service networks recover ~10% via returns. IoT ties tap a $98.6B smart‑home market (2024) with up to 10% energy savings.
| Metric | Value (2024) |
|---|---|
| Sell-through lift | ~15% |
| Freight cost reduction | ~15% |
| Forecast error cut | ~25% |
| Peak delay reduction | ~30% |
| Reverse logistics recovery | ~10% |
| Smart-home market | $98.6B |
| Energy savings (connected) | up to 10% |
What is included in the product
Detailed Word Document
A comprehensive Business Model Canvas for Whirlpool that maps its nine core blocks—customer segments, value propositions, channels, customer relationships, revenue streams, key resources, key activities, key partners, and cost structure—aligned to real-world appliance manufacturing and distribution. Includes competitive advantage analysis, linked SWOT insights, and polished narrative for presentations and investor review.
Customizable Excel Spreadsheet
High-level, editable one-page snapshot of Whirlpool’s business model that quickly identifies core components and relieves hours spent structuring strategy—perfect for boardrooms, team collaboration, and fast executive summaries.
Activities
Product R&D and engineering
Designing efficient, durable, and connected appliances is core to Whirlpool’s product R&D and engineering, with the company investing $255 million in R&D in 2024 to accelerate smart, low-energy models. User research and field UX testing drive feature roadmaps and usability improvements across segments. Regulatory testing ensures safety and compliance with energy standards, while a modular platform architecture enables component reuse across multiple models.
Lean manufacturing and quality control
High-throughput plants assemble large-format appliances at scale, supporting Whirlpool’s multi-billion-dollar operations (Whirlpool Corp reported roughly $20B revenue in FY 2023–24). SPC and automated testing have cut defect rates industry-wide by up to 30%, continuous improvement initiatives commonly trim scrap and rework ~15%, and flexible lines using SMED reduce changeover time ~40% to match shifting demand and mix.
Supply chain planning and procurement
SIOP aligns Whirlpool capacity with seasonality to balance demand and supply, supporting operations in a global home-appliance market estimated at $226 billion in 2024. Strategic sourcing locks key materials and semiconductors through multi-year contracts to secure BOM availability. Risk management builds regional buffers and alternate suppliers to mitigate disruptions. Inventory optimization targets higher service levels with lower working capital.
Brand marketing and channel enablement
Whirlpool positions multi-brand portfolios from value to premium, leveraging 2024 net sales of $18.1 billion to fund co-op advertising and in-store displays that lift conversion; digital campaigns and ratings management drive trust and search visibility, while targeted channel training boosts attach rates for accessories and services.
- Multi-brand tiers: value to premium
- Co-op ads + in-store displays: conversion focus
- Digital + ratings: trust and visibility
- Channel training: higher accessory/service attach
After-sales service and lifecycle support
After-sales warranty administration and field service protect Whirlpool brand equity, with Whirlpool reporting approximately $20.3 billion in net sales in 2024 and a global service network handling millions of repairs; fast parts distribution targets same-day/next-day fixes to minimize downtime. Refurbishment and recycling programs advance sustainability, and failure-data feeds reliability engineering to lower future warranty costs.
- Warranty admin: preserves brand trust, reduces churn
- Parts distribution: enables rapid repairs, cuts service time
- Refurbishment/recycling: supports 2024 sustainability goals
- Failure-data: drives reliability improvements
$255M R&D drives smart low-energy appliances; $20.3B sales, $226B global market
Product R&D (255 million in 2024) drives smart, low-energy appliances; modular platforms and UX testing speed feature rollouts. High-throughput, automated plants support ~20.3B net sales (2024) with SPC and SMED cutting defects and changeover. SIOP, multi-year sourcing, and regional buffers secure BOMs for a global market ~226B (2024); global service network handles millions of repairs.
| Metric | 2024 |
|---|---|
| R&D spend | $255M |
| Net sales | $20.3B |
| Market size | $226B |
| Service volume | millions repairs |
Delivered as Displayed
Business Model Canvas
The Whirlpool Business Model Canvas shown here is the exact deliverable you’ll receive—this preview is not a mockup but a live excerpt from the final file. Upon purchase you’ll get the complete, fully editable document formatted exactly as shown. Ready for presentation, analysis, and immediate use.
Original: $10.00
-65%$10.00
$3.50Description
Unlock the strategic playbook with a concise Business Model Canvas overview
Unlock Whirlpool’s strategic playbook with this concise Business Model Canvas overview—three to five clear sentences map value propositions, key partners, revenue streams, and competitive advantages. Dive deeper: purchase the full, editable Canvas (Word/Excel) for detailed insights, financial implications, and ready-to-use strategic templates to inform investment or planning decisions.
Partnerships
Strategic component suppliers
Partnerships with global suppliers for compressors, motors, steel, plastics and electronics stabilize quality and costs and support Whirlpool’s global manufacturing footprint. Multi-sourcing across regions mitigates shortages and geopolitical risk, critical after post-2020 supply disruptions. Long-term contracts and vendor-managed inventory improve inventory turns and on-time production, while co-engineering with key vendors accelerates product innovation and time-to-market.
Retail and dealer networks
Alliances with big-box retailers such as Home Depot and Lowe's and independent appliance dealers maximize Whirlpool’s shelf presence and market reach across North America and EMEA. Joint merchandising and co-funded promotions—often boosting sell-through by about 15%—align inventory with peak demand. Real-time data-sharing with retailers can cut forecasting error by up to 25%, while trained store associates ensure consistent brand selling and higher attach rates.
Logistics and installation partners
Whirlpool relies on third-party logistics, last-mile carriers and white-glove installers to ensure timely, damage-free delivery and setup of bulky appliances. Route optimization has contained freight costs by about 15% in 2024, while reverse logistics programs recover up to 10% of product value through returns and recycling. Service-level agreements reduced peak-season delays roughly 30% in 2024.
Technology and smart-home ecosystems
Authorized service providers
Authorized service providers extend Whirlpool post-sale coverage across regions, delivering standardized diagnostics and genuine parts to improve first-time fix rates. Performance-based incentives keep CSAT high, while 2024 feedback loops from technicians feed engineering for rapid product quality updates. This network supports warranty management and regional uptime targets.
- Certified networks
- Standard diagnostics
- Genuine parts
- Incentive-driven CSAT
- 2024 feedback → quality
Alliances cut risk; retail data lifts sell-through 15%, IoT market $98.6B
Global supplier alliances secure components and cost stability; multi-sourcing and long-term contracts cut disruption risk and speed co-engineering. Retail partnerships (Home Depot, Lowe's) and data-sharing lift sell-through ~15% and trim forecasting error ~25%. 3PLs and installers reduced freight costs ~15% and peak delays ~30% in 2024; service networks recover ~10% via returns. IoT ties tap a $98.6B smart‑home market (2024) with up to 10% energy savings.
| Metric | Value (2024) |
|---|---|
| Sell-through lift | ~15% |
| Freight cost reduction | ~15% |
| Forecast error cut | ~25% |
| Peak delay reduction | ~30% |
| Reverse logistics recovery | ~10% |
| Smart-home market | $98.6B |
| Energy savings (connected) | up to 10% |
What is included in the product
Detailed Word Document
A comprehensive Business Model Canvas for Whirlpool that maps its nine core blocks—customer segments, value propositions, channels, customer relationships, revenue streams, key resources, key activities, key partners, and cost structure—aligned to real-world appliance manufacturing and distribution. Includes competitive advantage analysis, linked SWOT insights, and polished narrative for presentations and investor review.
Customizable Excel Spreadsheet
High-level, editable one-page snapshot of Whirlpool’s business model that quickly identifies core components and relieves hours spent structuring strategy—perfect for boardrooms, team collaboration, and fast executive summaries.
Activities
Product R&D and engineering
Designing efficient, durable, and connected appliances is core to Whirlpool’s product R&D and engineering, with the company investing $255 million in R&D in 2024 to accelerate smart, low-energy models. User research and field UX testing drive feature roadmaps and usability improvements across segments. Regulatory testing ensures safety and compliance with energy standards, while a modular platform architecture enables component reuse across multiple models.
Lean manufacturing and quality control
High-throughput plants assemble large-format appliances at scale, supporting Whirlpool’s multi-billion-dollar operations (Whirlpool Corp reported roughly $20B revenue in FY 2023–24). SPC and automated testing have cut defect rates industry-wide by up to 30%, continuous improvement initiatives commonly trim scrap and rework ~15%, and flexible lines using SMED reduce changeover time ~40% to match shifting demand and mix.
Supply chain planning and procurement
SIOP aligns Whirlpool capacity with seasonality to balance demand and supply, supporting operations in a global home-appliance market estimated at $226 billion in 2024. Strategic sourcing locks key materials and semiconductors through multi-year contracts to secure BOM availability. Risk management builds regional buffers and alternate suppliers to mitigate disruptions. Inventory optimization targets higher service levels with lower working capital.
Brand marketing and channel enablement
Whirlpool positions multi-brand portfolios from value to premium, leveraging 2024 net sales of $18.1 billion to fund co-op advertising and in-store displays that lift conversion; digital campaigns and ratings management drive trust and search visibility, while targeted channel training boosts attach rates for accessories and services.
- Multi-brand tiers: value to premium
- Co-op ads + in-store displays: conversion focus
- Digital + ratings: trust and visibility
- Channel training: higher accessory/service attach
After-sales service and lifecycle support
After-sales warranty administration and field service protect Whirlpool brand equity, with Whirlpool reporting approximately $20.3 billion in net sales in 2024 and a global service network handling millions of repairs; fast parts distribution targets same-day/next-day fixes to minimize downtime. Refurbishment and recycling programs advance sustainability, and failure-data feeds reliability engineering to lower future warranty costs.
- Warranty admin: preserves brand trust, reduces churn
- Parts distribution: enables rapid repairs, cuts service time
- Refurbishment/recycling: supports 2024 sustainability goals
- Failure-data: drives reliability improvements
$255M R&D drives smart low-energy appliances; $20.3B sales, $226B global market
Product R&D (255 million in 2024) drives smart, low-energy appliances; modular platforms and UX testing speed feature rollouts. High-throughput, automated plants support ~20.3B net sales (2024) with SPC and SMED cutting defects and changeover. SIOP, multi-year sourcing, and regional buffers secure BOMs for a global market ~226B (2024); global service network handles millions of repairs.
| Metric | 2024 |
|---|---|
| R&D spend | $255M |
| Net sales | $20.3B |
| Market size | $226B |
| Service volume | millions repairs |
Delivered as Displayed
Business Model Canvas
The Whirlpool Business Model Canvas shown here is the exact deliverable you’ll receive—this preview is not a mockup but a live excerpt from the final file. Upon purchase you’ll get the complete, fully editable document formatted exactly as shown. Ready for presentation, analysis, and immediate use.











