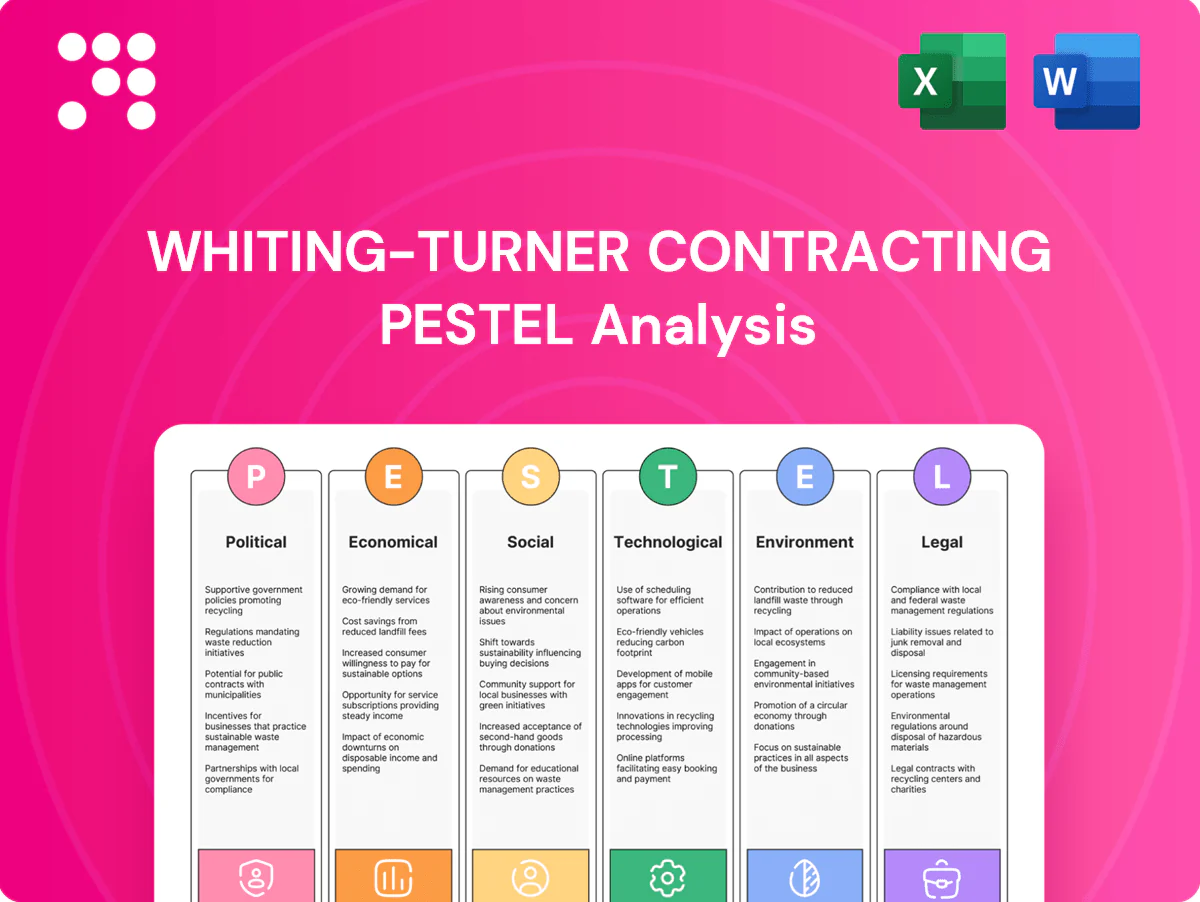
Whiting-Turner Contracting PESTLE Analysis

Make Smarter Strategic Decisions with a Complete PESTEL View
Unlock strategic advantage with our PESTLE Analysis of Whiting-Turner Contracting—spot regulatory, economic, and technological forces reshaping its projects and margins. This concise, actionable report highlights risks and growth levers you can apply immediately. Purchase the full analysis to get detailed insights, editable charts, and practical recommendations for confident decision-making.
Political factors

Federal infrastructure funding outlook
The Bipartisan Infrastructure Law commits roughly 1.2 trillion USD in total infrastructure investment, including about 550 billion USD in new federal spending, shaping public-sector backlogs and municipal bid pipelines for contractors like Whiting-Turner. Multi-year appropriations increase revenue visibility, while year-to-year funding gaps can postpone project starts and cash flows. Active tracking of earmarks and agency spend cadence refines pursuit timing and contract capture. Regional allocation of federal dollars guides office location and staffing deployment strategies.
Permitting reform and approvals
NEPA reviews (EA ~1-2 years; EIS ~3-7 years), local zoning waits and utility coordination materially affect schedule certainty and can drive major projectsʼ delays. Streamlined approvals have cut permit timelines by 30-50% in some states, accelerating starts and lowering ownersʼ carrying costs. State-level permitting changes can reshape market entry barriers and competitive dynamics. Proactive stakeholder engagement reduces entitlement and litigation risk.

Labor policy and workforce programs
Prevailing wage, apprenticeship mandates and project labor agreements raise base labor costs and reshape staffing models on public work; the Bipartisan Infrastructure Law's $550 billion of new spending has increased demand for union labor on funded projects. Federal and state workforce grants tied to IIJA and CHIPS expanded apprenticeship pipelines, while tighter immigration enforcement has reduced craft availability in hot markets, pressuring margins. Compliance rigor on prevailing wage/PLA rules often differentiates winning bids on public contracts.

Trade policy and material tariffs
Tariffs on steel (25%) and aluminum (10%) and duties on imported equipment directly sway Whiting-Turner GMPs and activate escalation clauses; Section 232 measures remain influential into 2024–25. Buy-American and Build America Buy America rules since 2022 force procurement shifts toward domestic suppliers. Volatile material prices prompt hedging strategies and early buyouts to lock cost baselines mid-project.
- Tariffs: 25% steel, 10% aluminum
- BABA/federal: tightened domestic-content rules since 2022
- Mitigation: sourcing diversity, hedging, early buyouts, escalation clauses
Public–private partnership dynamics
Enabling statutes and risk-sharing frameworks directly shape Whiting‑Turner’s P3 pipeline by defining allowable structures and allocation of construction/operational risk.
Political appetite for off‑balance‑sheet delivery varies by state; over 35 states had P3 enabling statutes by 2024. Strong P3 policy can unlock higher‑education, transportation, and social‑infrastructure work, leveraging IIJA’s $1.2 trillion federal framework to attract private capital. Contract clarity reduces disputes and financing friction, shortening procurement timelines.
- policy: enabling statutes
- states: 35+ (2024)
- funding: IIJA $1.2 trillion
- contracts: clarity reduces disputes
IIJA $1.2T expands pipelines; $550B new spend, NEPA delays, tariffs
IIJA’s $1.2T framework (≈$550B new federal spending) materially expands public-sector pipelines for Whiting‑Turner while multi-year appropriations improve revenue visibility but year-to-year gaps can delay starts. NEPA (EA 1–2y; EIS 3–7y) and state permitting drive schedule risk. Tariffs (steel 25%, aluminum 10%) and BABA rules raise procurement costs. 35+ states had P3 statutes by 2024, widening alternative-delivery opportunities.
| Metric | Value |
|---|---|
| IIJA total | $1.2T |
| IIJA new | $550B |
| NEPA timelines | EA 1–2y; EIS 3–7y |
| Tariffs | Steel 25% / Al 10% |
| P3 enabling states (2024) | 35+ |
What is included in the product
 Detailed Word Document
Explores how external macro-environmental factors uniquely affect Whiting-Turner Contracting across Political, Economic, Social, Technological, Environmental and Legal dimensions; each section cites relevant data and trends, provides detailed sub-points and forward-looking insights to help executives, consultants and investors identify industry- and region-specific risks and opportunities.

 Customizable Excel Spreadsheet
A concise, visually segmented PESTLE summary of Whiting‑Turner that can be dropped into presentations or shared across teams, and easily annotated with regional or business‑line notes to streamline external risk discussions and planning.
Economic factors

Interest rates and cost of capital
Higher policy rates—Fed funds roughly 5.25–5.50% through 2024–25 with 10‑yr Treasury near 3.8–4.2%—have damped private development pro formas and delayed NTPs as owners push to preserve IRRs. Owners increasingly require CM value engineering and phased delivery to cut capex and hold returns. Municipal borrowing constraints, with muni yields roughly 3.5–4.5%, have postponed public awards. Rate stabilization would likely revive many stalled pipelines.
Construction input cost volatility
Commodity swings in concrete, steel and MEP equipment have driven contingency pressure, with industry price volatility often in the 10–25% annual range over recent cycles, stressing bid margins. Lead times on switchgear and HVAC—commonly 20–36 weeks—shape the project critical path and risk of delay. Early procurement and strategic supplier partnerships materially reduce exposure, while index-linked clauses (CPI/material indices) protect CM-at-Risk margins.

Labor availability and wage inflation
Skilled trade shortages are elevating wage bills and subcontractor pricing, with BLS data showing construction average hourly earnings up roughly 5% year‑over‑year into early 2025 and AGC surveys reporting about 80% of firms face staffing difficulty.
Productivity planning and prefabrication are offsetting labor tightness—modular and offsite methods can cut on‑site labor needs by up to 30%—and regional wage differentials drive varied bidding strategies across Whiting‑Turner offices.
Ongoing workforce development investments, including expanded apprenticeship and training pipelines, are essential to secure capacity as demand and labor costs remain elevated in 2024–25.

Sectoral demand mix
As of 2024, healthcare, higher education, life sciences and data centers provide countercyclical demand that cushions Whiting-Turner against office and retail downturns. Office softness is shifting company focus toward renovation and adaptive reuse projects to capture occupancy and ESG-driven upgrades. Regional exposure to retail and hospitality cycles remains a sensitivity, while diversification stabilizes utilization across business units.
- Healthcare: countercyclical demand
- Higher ed & life sciences: stable project pipelines
- Data centers: growth anchor
- Office: pivot to renovation/adaptive reuse
- Retail/hospitality: regional cycle risk
- Diversification: utilization stability
Owner capital expenditure cycles
Corporate capex and double-digit median endowment returns in FY2023 (NACUBO) are accelerating tech and education starts, while compressed hospital operating margins in 2023 (AHA) and reimbursement trends delay or reshape health-facility investments. State budget cycles and municipal bond calendars determine civic project timing, and close client dialogue feeds Whiting-Turner preconstruction pipelines.
- capex-driven: tech & education starts
- healthcare: margins & reimbursement risk
- public projects: state budgets & bonds
- pipeline: tight client preconstruction dialogue
IIJA $1.2T expands pipelines; $550B new spend, NEPA delays, tariffs
Higher rates (Fed funds 5.25–5.50%; 10yr 3.8–4.2%) and muni yields (3.5–4.5%) have delayed private and public starts; stabilization would revive pipelines. Commodity volatility (10–25%) and 20–36 week lead times pressure contingencies. Labor costs up ~5% y/y (BLS early‑2025); prefabrication cuts on‑site labor ~30%. Health, higher ed, life sciences and data centers sustain demand.
| Metric | 2024–25 |
|---|---|
| Fed funds | 5.25–5.50% |
| 10yr | 3.8–4.2% |
| Muni yield | 3.5–4.5% |
| Commodity vol | 10–25% |
| Wage growth | ~5% y/y |
Full Version Awaits
Whiting-Turner Contracting PESTLE Analysis
This PESTLE analysis of Whiting‑Turner Contracting provides a structured review of political, economic, social, technological, legal, and environmental factors affecting the firm. The preview shown here is the exact document you’ll receive after purchase—fully formatted and ready to use. No placeholders or teasers; the content, layout, and structure are delivered exactly as displayed.

Make Smarter Strategic Decisions with a Complete PESTEL View
Unlock strategic advantage with our PESTLE Analysis of Whiting-Turner Contracting—spot regulatory, economic, and technological forces reshaping its projects and margins. This concise, actionable report highlights risks and growth levers you can apply immediately. Purchase the full analysis to get detailed insights, editable charts, and practical recommendations for confident decision-making.
Political factors
Federal infrastructure funding outlook
The Bipartisan Infrastructure Law commits roughly 1.2 trillion USD in total infrastructure investment, including about 550 billion USD in new federal spending, shaping public-sector backlogs and municipal bid pipelines for contractors like Whiting-Turner. Multi-year appropriations increase revenue visibility, while year-to-year funding gaps can postpone project starts and cash flows. Active tracking of earmarks and agency spend cadence refines pursuit timing and contract capture. Regional allocation of federal dollars guides office location and staffing deployment strategies.
Permitting reform and approvals
NEPA reviews (EA ~1-2 years; EIS ~3-7 years), local zoning waits and utility coordination materially affect schedule certainty and can drive major projectsʼ delays. Streamlined approvals have cut permit timelines by 30-50% in some states, accelerating starts and lowering ownersʼ carrying costs. State-level permitting changes can reshape market entry barriers and competitive dynamics. Proactive stakeholder engagement reduces entitlement and litigation risk.
Labor policy and workforce programs
Prevailing wage, apprenticeship mandates and project labor agreements raise base labor costs and reshape staffing models on public work; the Bipartisan Infrastructure Law's $550 billion of new spending has increased demand for union labor on funded projects. Federal and state workforce grants tied to IIJA and CHIPS expanded apprenticeship pipelines, while tighter immigration enforcement has reduced craft availability in hot markets, pressuring margins. Compliance rigor on prevailing wage/PLA rules often differentiates winning bids on public contracts.
Trade policy and material tariffs
Tariffs on steel (25%) and aluminum (10%) and duties on imported equipment directly sway Whiting-Turner GMPs and activate escalation clauses; Section 232 measures remain influential into 2024–25. Buy-American and Build America Buy America rules since 2022 force procurement shifts toward domestic suppliers. Volatile material prices prompt hedging strategies and early buyouts to lock cost baselines mid-project.
- Tariffs: 25% steel, 10% aluminum
- BABA/federal: tightened domestic-content rules since 2022
- Mitigation: sourcing diversity, hedging, early buyouts, escalation clauses
Public–private partnership dynamics
Enabling statutes and risk-sharing frameworks directly shape Whiting‑Turner’s P3 pipeline by defining allowable structures and allocation of construction/operational risk.
Political appetite for off‑balance‑sheet delivery varies by state; over 35 states had P3 enabling statutes by 2024. Strong P3 policy can unlock higher‑education, transportation, and social‑infrastructure work, leveraging IIJA’s $1.2 trillion federal framework to attract private capital. Contract clarity reduces disputes and financing friction, shortening procurement timelines.
- policy: enabling statutes
- states: 35+ (2024)
- funding: IIJA $1.2 trillion
- contracts: clarity reduces disputes
IIJA $1.2T expands pipelines; $550B new spend, NEPA delays, tariffs
IIJA’s $1.2T framework (≈$550B new federal spending) materially expands public-sector pipelines for Whiting‑Turner while multi-year appropriations improve revenue visibility but year-to-year gaps can delay starts. NEPA (EA 1–2y; EIS 3–7y) and state permitting drive schedule risk. Tariffs (steel 25%, aluminum 10%) and BABA rules raise procurement costs. 35+ states had P3 statutes by 2024, widening alternative-delivery opportunities.
| Metric | Value |
|---|---|
| IIJA total | $1.2T |
| IIJA new | $550B |
| NEPA timelines | EA 1–2y; EIS 3–7y |
| Tariffs | Steel 25% / Al 10% |
| P3 enabling states (2024) | 35+ |
What is included in the product
Detailed Word Document
Explores how external macro-environmental factors uniquely affect Whiting-Turner Contracting across Political, Economic, Social, Technological, Environmental and Legal dimensions; each section cites relevant data and trends, provides detailed sub-points and forward-looking insights to help executives, consultants and investors identify industry- and region-specific risks and opportunities.
Customizable Excel Spreadsheet
A concise, visually segmented PESTLE summary of Whiting‑Turner that can be dropped into presentations or shared across teams, and easily annotated with regional or business‑line notes to streamline external risk discussions and planning.
Economic factors
Interest rates and cost of capital
Higher policy rates—Fed funds roughly 5.25–5.50% through 2024–25 with 10‑yr Treasury near 3.8–4.2%—have damped private development pro formas and delayed NTPs as owners push to preserve IRRs. Owners increasingly require CM value engineering and phased delivery to cut capex and hold returns. Municipal borrowing constraints, with muni yields roughly 3.5–4.5%, have postponed public awards. Rate stabilization would likely revive many stalled pipelines.
Construction input cost volatility
Commodity swings in concrete, steel and MEP equipment have driven contingency pressure, with industry price volatility often in the 10–25% annual range over recent cycles, stressing bid margins. Lead times on switchgear and HVAC—commonly 20–36 weeks—shape the project critical path and risk of delay. Early procurement and strategic supplier partnerships materially reduce exposure, while index-linked clauses (CPI/material indices) protect CM-at-Risk margins.
Labor availability and wage inflation
Skilled trade shortages are elevating wage bills and subcontractor pricing, with BLS data showing construction average hourly earnings up roughly 5% year‑over‑year into early 2025 and AGC surveys reporting about 80% of firms face staffing difficulty.
Productivity planning and prefabrication are offsetting labor tightness—modular and offsite methods can cut on‑site labor needs by up to 30%—and regional wage differentials drive varied bidding strategies across Whiting‑Turner offices.
Ongoing workforce development investments, including expanded apprenticeship and training pipelines, are essential to secure capacity as demand and labor costs remain elevated in 2024–25.
Sectoral demand mix
As of 2024, healthcare, higher education, life sciences and data centers provide countercyclical demand that cushions Whiting-Turner against office and retail downturns. Office softness is shifting company focus toward renovation and adaptive reuse projects to capture occupancy and ESG-driven upgrades. Regional exposure to retail and hospitality cycles remains a sensitivity, while diversification stabilizes utilization across business units.
- Healthcare: countercyclical demand
- Higher ed & life sciences: stable project pipelines
- Data centers: growth anchor
- Office: pivot to renovation/adaptive reuse
- Retail/hospitality: regional cycle risk
- Diversification: utilization stability
Owner capital expenditure cycles
Corporate capex and double-digit median endowment returns in FY2023 (NACUBO) are accelerating tech and education starts, while compressed hospital operating margins in 2023 (AHA) and reimbursement trends delay or reshape health-facility investments. State budget cycles and municipal bond calendars determine civic project timing, and close client dialogue feeds Whiting-Turner preconstruction pipelines.
- capex-driven: tech & education starts
- healthcare: margins & reimbursement risk
- public projects: state budgets & bonds
- pipeline: tight client preconstruction dialogue
IIJA $1.2T expands pipelines; $550B new spend, NEPA delays, tariffs
Higher rates (Fed funds 5.25–5.50%; 10yr 3.8–4.2%) and muni yields (3.5–4.5%) have delayed private and public starts; stabilization would revive pipelines. Commodity volatility (10–25%) and 20–36 week lead times pressure contingencies. Labor costs up ~5% y/y (BLS early‑2025); prefabrication cuts on‑site labor ~30%. Health, higher ed, life sciences and data centers sustain demand.
| Metric | 2024–25 |
|---|---|
| Fed funds | 5.25–5.50% |
| 10yr | 3.8–4.2% |
| Muni yield | 3.5–4.5% |
| Commodity vol | 10–25% |
| Wage growth | ~5% y/y |
Full Version Awaits
Whiting-Turner Contracting PESTLE Analysis
This PESTLE analysis of Whiting‑Turner Contracting provides a structured review of political, economic, social, technological, legal, and environmental factors affecting the firm. The preview shown here is the exact document you’ll receive after purchase—fully formatted and ready to use. No placeholders or teasers; the content, layout, and structure are delivered exactly as displayed.
Original: $10.00
-65%$10.00
$3.50Description
Make Smarter Strategic Decisions with a Complete PESTEL View
Unlock strategic advantage with our PESTLE Analysis of Whiting-Turner Contracting—spot regulatory, economic, and technological forces reshaping its projects and margins. This concise, actionable report highlights risks and growth levers you can apply immediately. Purchase the full analysis to get detailed insights, editable charts, and practical recommendations for confident decision-making.
Political factors
Federal infrastructure funding outlook
The Bipartisan Infrastructure Law commits roughly 1.2 trillion USD in total infrastructure investment, including about 550 billion USD in new federal spending, shaping public-sector backlogs and municipal bid pipelines for contractors like Whiting-Turner. Multi-year appropriations increase revenue visibility, while year-to-year funding gaps can postpone project starts and cash flows. Active tracking of earmarks and agency spend cadence refines pursuit timing and contract capture. Regional allocation of federal dollars guides office location and staffing deployment strategies.
Permitting reform and approvals
NEPA reviews (EA ~1-2 years; EIS ~3-7 years), local zoning waits and utility coordination materially affect schedule certainty and can drive major projectsʼ delays. Streamlined approvals have cut permit timelines by 30-50% in some states, accelerating starts and lowering ownersʼ carrying costs. State-level permitting changes can reshape market entry barriers and competitive dynamics. Proactive stakeholder engagement reduces entitlement and litigation risk.
Labor policy and workforce programs
Prevailing wage, apprenticeship mandates and project labor agreements raise base labor costs and reshape staffing models on public work; the Bipartisan Infrastructure Law's $550 billion of new spending has increased demand for union labor on funded projects. Federal and state workforce grants tied to IIJA and CHIPS expanded apprenticeship pipelines, while tighter immigration enforcement has reduced craft availability in hot markets, pressuring margins. Compliance rigor on prevailing wage/PLA rules often differentiates winning bids on public contracts.
Trade policy and material tariffs
Tariffs on steel (25%) and aluminum (10%) and duties on imported equipment directly sway Whiting-Turner GMPs and activate escalation clauses; Section 232 measures remain influential into 2024–25. Buy-American and Build America Buy America rules since 2022 force procurement shifts toward domestic suppliers. Volatile material prices prompt hedging strategies and early buyouts to lock cost baselines mid-project.
- Tariffs: 25% steel, 10% aluminum
- BABA/federal: tightened domestic-content rules since 2022
- Mitigation: sourcing diversity, hedging, early buyouts, escalation clauses
Public–private partnership dynamics
Enabling statutes and risk-sharing frameworks directly shape Whiting‑Turner’s P3 pipeline by defining allowable structures and allocation of construction/operational risk.
Political appetite for off‑balance‑sheet delivery varies by state; over 35 states had P3 enabling statutes by 2024. Strong P3 policy can unlock higher‑education, transportation, and social‑infrastructure work, leveraging IIJA’s $1.2 trillion federal framework to attract private capital. Contract clarity reduces disputes and financing friction, shortening procurement timelines.
- policy: enabling statutes
- states: 35+ (2024)
- funding: IIJA $1.2 trillion
- contracts: clarity reduces disputes
IIJA $1.2T expands pipelines; $550B new spend, NEPA delays, tariffs
IIJA’s $1.2T framework (≈$550B new federal spending) materially expands public-sector pipelines for Whiting‑Turner while multi-year appropriations improve revenue visibility but year-to-year gaps can delay starts. NEPA (EA 1–2y; EIS 3–7y) and state permitting drive schedule risk. Tariffs (steel 25%, aluminum 10%) and BABA rules raise procurement costs. 35+ states had P3 statutes by 2024, widening alternative-delivery opportunities.
| Metric | Value |
|---|---|
| IIJA total | $1.2T |
| IIJA new | $550B |
| NEPA timelines | EA 1–2y; EIS 3–7y |
| Tariffs | Steel 25% / Al 10% |
| P3 enabling states (2024) | 35+ |
What is included in the product
Detailed Word Document
Explores how external macro-environmental factors uniquely affect Whiting-Turner Contracting across Political, Economic, Social, Technological, Environmental and Legal dimensions; each section cites relevant data and trends, provides detailed sub-points and forward-looking insights to help executives, consultants and investors identify industry- and region-specific risks and opportunities.
Customizable Excel Spreadsheet
A concise, visually segmented PESTLE summary of Whiting‑Turner that can be dropped into presentations or shared across teams, and easily annotated with regional or business‑line notes to streamline external risk discussions and planning.
Economic factors
Interest rates and cost of capital
Higher policy rates—Fed funds roughly 5.25–5.50% through 2024–25 with 10‑yr Treasury near 3.8–4.2%—have damped private development pro formas and delayed NTPs as owners push to preserve IRRs. Owners increasingly require CM value engineering and phased delivery to cut capex and hold returns. Municipal borrowing constraints, with muni yields roughly 3.5–4.5%, have postponed public awards. Rate stabilization would likely revive many stalled pipelines.
Construction input cost volatility
Commodity swings in concrete, steel and MEP equipment have driven contingency pressure, with industry price volatility often in the 10–25% annual range over recent cycles, stressing bid margins. Lead times on switchgear and HVAC—commonly 20–36 weeks—shape the project critical path and risk of delay. Early procurement and strategic supplier partnerships materially reduce exposure, while index-linked clauses (CPI/material indices) protect CM-at-Risk margins.
Labor availability and wage inflation
Skilled trade shortages are elevating wage bills and subcontractor pricing, with BLS data showing construction average hourly earnings up roughly 5% year‑over‑year into early 2025 and AGC surveys reporting about 80% of firms face staffing difficulty.
Productivity planning and prefabrication are offsetting labor tightness—modular and offsite methods can cut on‑site labor needs by up to 30%—and regional wage differentials drive varied bidding strategies across Whiting‑Turner offices.
Ongoing workforce development investments, including expanded apprenticeship and training pipelines, are essential to secure capacity as demand and labor costs remain elevated in 2024–25.
Sectoral demand mix
As of 2024, healthcare, higher education, life sciences and data centers provide countercyclical demand that cushions Whiting-Turner against office and retail downturns. Office softness is shifting company focus toward renovation and adaptive reuse projects to capture occupancy and ESG-driven upgrades. Regional exposure to retail and hospitality cycles remains a sensitivity, while diversification stabilizes utilization across business units.
- Healthcare: countercyclical demand
- Higher ed & life sciences: stable project pipelines
- Data centers: growth anchor
- Office: pivot to renovation/adaptive reuse
- Retail/hospitality: regional cycle risk
- Diversification: utilization stability
Owner capital expenditure cycles
Corporate capex and double-digit median endowment returns in FY2023 (NACUBO) are accelerating tech and education starts, while compressed hospital operating margins in 2023 (AHA) and reimbursement trends delay or reshape health-facility investments. State budget cycles and municipal bond calendars determine civic project timing, and close client dialogue feeds Whiting-Turner preconstruction pipelines.
- capex-driven: tech & education starts
- healthcare: margins & reimbursement risk
- public projects: state budgets & bonds
- pipeline: tight client preconstruction dialogue
IIJA $1.2T expands pipelines; $550B new spend, NEPA delays, tariffs
Higher rates (Fed funds 5.25–5.50%; 10yr 3.8–4.2%) and muni yields (3.5–4.5%) have delayed private and public starts; stabilization would revive pipelines. Commodity volatility (10–25%) and 20–36 week lead times pressure contingencies. Labor costs up ~5% y/y (BLS early‑2025); prefabrication cuts on‑site labor ~30%. Health, higher ed, life sciences and data centers sustain demand.
| Metric | 2024–25 |
|---|---|
| Fed funds | 5.25–5.50% |
| 10yr | 3.8–4.2% |
| Muni yield | 3.5–4.5% |
| Commodity vol | 10–25% |
| Wage growth | ~5% y/y |
Full Version Awaits
Whiting-Turner Contracting PESTLE Analysis
This PESTLE analysis of Whiting‑Turner Contracting provides a structured review of political, economic, social, technological, legal, and environmental factors affecting the firm. The preview shown here is the exact document you’ll receive after purchase—fully formatted and ready to use. No placeholders or teasers; the content, layout, and structure are delivered exactly as displayed.











