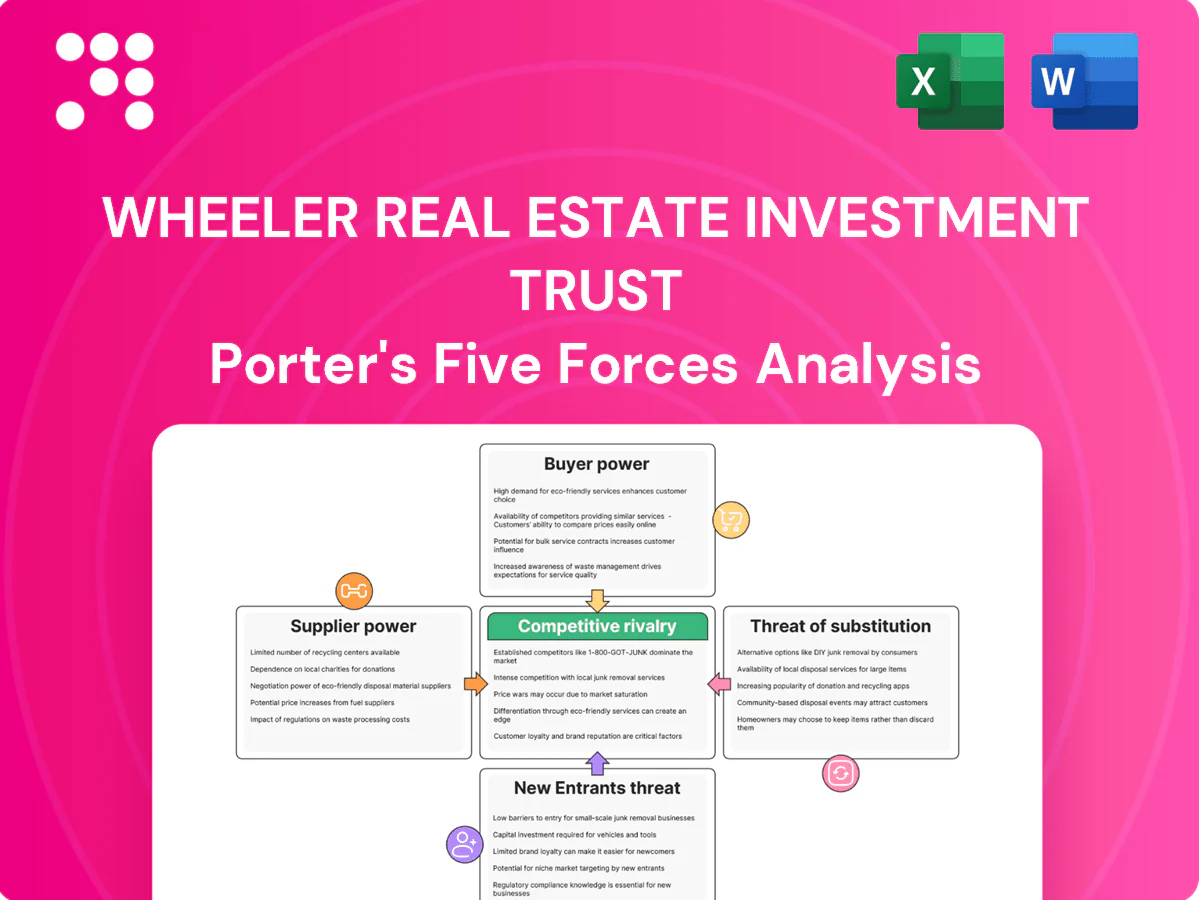
Wheeler Real Estate Investment Trust Porter's Five Forces Analysis

Don't Miss the Bigger Picture
Wheeler Real Estate Investment Trust faces moderate tenant bargaining power, rising market competition, and selective supplier influence, while threats from new entrants and substitutes hinge on capital intensity and portfolio specialization. This snapshot highlights key pressures shaping margin and growth potential. Unlock the full Porter's Five Forces Analysis to explore force-by-force ratings, strategic implications, and actionable recommendations.
Suppliers Bargaining Power

Constrained quality site pipeline
Scarcity of high-traffic, grocery-anchored centers in infill submarkets gives select landowners outsized leverage on price and deal terms; limited replacement supply drove bidding intensity in 2024, compressing cap rates and lowering yield-on-cost across transactions, while longer sourcing timelines in 2024 heightened execution and hold-period risk.
Capital providers set terms
Capital providers set terms for Wheeler REIT: debt markets tightened in 2024 as the federal funds rate sat near 5.25–5.50% and the 10‑year Treasury averaged about 4.5%, letting lenders raise rates, tighten covenants and shrink proceeds. Higher rates amplify refinancing risk and spread volatility, boosting supplier leverage. Equity raises often require discounts that dilute holders, constraining growth and redevelopment optionality.

Construction and maintenance vendors
Specialized contractors, materials, and facility services can push costs when labor or materials tighten, a dynamic that remained visible through 2024 as supply-chain constraints and skilled-labor scarcity affected construction markets. Local vendor concentration in Wheeler's secondary and tertiary markets limits alternatives, raising switching costs. Cost pass-throughs to tenants are often neither contractual nor immediate, so rising vendor prices can compress NOI if not actively managed through procurement strategies and lease terms.

Municipal approvals and utilities
Zoning, permits and utility hookups act as quasi-suppliers for Wheeler REIT, controlling timelines (often adding 6–12 months) and fees (commonly 1–3% of project cost), so regulatory delays directly compress leasing velocity and redevelopment IRR. Impact fees and midstream code changes can raise costs—sometimes up to 5%—shifting project economics after underwriting. Deep local relationships and permitting experience partially mitigate these risks.
- Zoning delay: 6–12 months
- Permit/ hookup fees: 1–3% of cost
- Impact fees/code changes: up to 5%
- Mitigation: local relationships, permitting expertise
Technology and data platforms
Technology and data platforms such as Yardi, MRI, VTS and RealPage drive sticky leasing, foot-traffic analytics and proptech services that can raise fees and compress operating margins through vendor lock-in and integration costs; many REITs report integration and switching costs as a material operational barrier in 2024. Negotiating enterprise agreements and multi-year SLAs reduces dependence and preserves margins.
- Vendor lock-in raises switching costs
- Integration costs impact margins
- Enterprise agreements mitigate dependence
High supplier leverage, cap-rate compression and tighter debt raise refinancing and execution risk
Supplier leverage is high: scarce grocery‑anchored infill sites drove 2024 bidding and ~75–150 bps cap‑rate compression, raising acquisition costs and execution risk. Debt tightening (fed funds ~5.25–5.50%, 10y ~4.5%) increased refinancing pressure and lender covenants. Local contractors, permits and proptech vendors raise switching costs and can compress NOI if not contractually mitigated.
| Metric | 2024 |
|---|---|
| Cap‑rate move | ‑75 to ‑150 bps |
| Fed funds | 5.25–5.50% |
| 10‑yr | ~4.5% |
What is included in the product
 Detailed Word Document
Concise Porter's Five Forces overview tailored to Wheeler Real Estate Investment Trust, uncovering competitive dynamics, buyer/supplier leverage, entry barriers, substitute threats, and strategic pressures shaping its profitability.

 Customizable Excel Spreadsheet
A concise one-sheet Porter's Five Forces for Wheeler Real Estate Investment Trust—visualizes competitive pressures and relief strategies with customizable ratings and an instant radar chart for boardroom-ready, decision-focused insight.
Customers Bargaining Power

Anchor grocers negotiate hard
Grocery anchors drive traffic and occupancy—2024 data show grocery-anchored centers maintaining about 95% occupancy—giving anchors strong rent and tenant-improvement leverage. They routinely demand co-tenancy clauses and category exclusives, shifting relocation and vacancy risk to landlords. High credit quality of chains lowers default risk but concentrates bargaining power, and renewal terms often cap rent growth, compressing upside for Wheeler REIT.
Inline tenant fragmentation
Inline tenant fragmentation leaves Wheeler with many small, individually weak tenants, with inline spaces making up roughly 60% of street‑level units across its centers; 2024 US neighborhood center vacancy hovered near 7.2% (CoStar), raising TI and downtime costs. Vacancy and higher TI needs lift effective occupancy costs, while aggregated tenant cohorts still shape merchandising and center vitality. Proactive leasing and shorter concessions in 2024 reduced rent abatements and TI allowances across comparable portfolios.

Alternative locations nearby
When trade areas host competing centers tenants can leverage options to shop for better lease terms; national retail vacancy averaged about 6.0% in 2024, increasing tenant bargaining in crowded submarkets. Visibility, access and co-tenancy drive willingness to pay, with premium sites commanding roughly 15% higher rents. Strong anchors and stable sales reduce tenant leverage, while weak centers face higher concessions and longer downtime.

Credit and omni-channel demands
National retailers demand flexible space, shorter terms, and tenant improvements tied to omni-channel needs, pressuring landlords for data sharing and cooperative marketing; 2024 U.S. e-commerce penetration stood near 16.2% (U.S. Census), increasing leverage for digitally aligned tenants. Landlords offering traffic analytics and POS integration gain negotiating strength, while others accept lower rents or higher TI to secure anchor brands.
- Flexible leases: shorter terms, pop-up-friendly
- TI focus: omni-channel buildouts, curbside/POS
- Data leverage: traffic analytics = bargaining power
- Concessions: rent/economic tradeoffs to secure tenants
Co-tenancy and kick-out clauses
Leases tied to anchor performance shift occupancy and sales risk to Wheeler by allowing rent resets or tenant termination if anchors underperform; in 2024 co-tenancy and kick-out activity remained a prominent pressure point for shopping-center REITs. Anchor closures can trigger rent reductions or termination rights, amplifying tenant bargaining leverage during downturns. Preserving anchor health is therefore critical to protect Wheeler’s rent roll and same-store income.
- Co-tenancy clauses increase landlord exposure to anchor failure
- Kick-out rights raise effective customer power in downturns
- Maintaining anchor performance is essential to stabilize rent roll
Grocery anchors 95% cap rent upside; inline vacancies and 16.2% e‑commerce aid tenants
Grocery anchors (95% occupancy, 2024) hold strong leverage via co-tenancy and exclusives, limiting Wheeler’s rent upside. Inline tenants (~60% of street units) and 7.2% neighborhood vacancy raise TI/downtime costs and concessions. National retail vacancy 6.0% and 16.2% e‑commerce penetration boost negotiating power of digitally aligned tenants.
| Metric | 2024 |
|---|---|
| Grocery occupancy | 95% |
| Inline share | 60% |
| Neighborhood vacancy | 7.2% |
| E-commerce penetration | 16.2% |
Preview the Actual Deliverable
Wheeler Real Estate Investment Trust Porter's Five Forces Analysis
This Porter’s Five Forces analysis for Wheeler Real Estate Investment Trust examines competitive rivalry across its property portfolio, buyer and supplier bargaining power, threats from new entrants and substitutes, and regulatory and macroeconomic pressures shaping returns. The document shown is the same professionally written analysis you'll receive—fully formatted and ready to use.

Don't Miss the Bigger Picture
Wheeler Real Estate Investment Trust faces moderate tenant bargaining power, rising market competition, and selective supplier influence, while threats from new entrants and substitutes hinge on capital intensity and portfolio specialization. This snapshot highlights key pressures shaping margin and growth potential. Unlock the full Porter's Five Forces Analysis to explore force-by-force ratings, strategic implications, and actionable recommendations.
Suppliers Bargaining Power
Constrained quality site pipeline
Scarcity of high-traffic, grocery-anchored centers in infill submarkets gives select landowners outsized leverage on price and deal terms; limited replacement supply drove bidding intensity in 2024, compressing cap rates and lowering yield-on-cost across transactions, while longer sourcing timelines in 2024 heightened execution and hold-period risk.
Capital providers set terms
Capital providers set terms for Wheeler REIT: debt markets tightened in 2024 as the federal funds rate sat near 5.25–5.50% and the 10‑year Treasury averaged about 4.5%, letting lenders raise rates, tighten covenants and shrink proceeds. Higher rates amplify refinancing risk and spread volatility, boosting supplier leverage. Equity raises often require discounts that dilute holders, constraining growth and redevelopment optionality.
Construction and maintenance vendors
Specialized contractors, materials, and facility services can push costs when labor or materials tighten, a dynamic that remained visible through 2024 as supply-chain constraints and skilled-labor scarcity affected construction markets. Local vendor concentration in Wheeler's secondary and tertiary markets limits alternatives, raising switching costs. Cost pass-throughs to tenants are often neither contractual nor immediate, so rising vendor prices can compress NOI if not actively managed through procurement strategies and lease terms.
Municipal approvals and utilities
Zoning, permits and utility hookups act as quasi-suppliers for Wheeler REIT, controlling timelines (often adding 6–12 months) and fees (commonly 1–3% of project cost), so regulatory delays directly compress leasing velocity and redevelopment IRR. Impact fees and midstream code changes can raise costs—sometimes up to 5%—shifting project economics after underwriting. Deep local relationships and permitting experience partially mitigate these risks.
- Zoning delay: 6–12 months
- Permit/ hookup fees: 1–3% of cost
- Impact fees/code changes: up to 5%
- Mitigation: local relationships, permitting expertise
Technology and data platforms
Technology and data platforms such as Yardi, MRI, VTS and RealPage drive sticky leasing, foot-traffic analytics and proptech services that can raise fees and compress operating margins through vendor lock-in and integration costs; many REITs report integration and switching costs as a material operational barrier in 2024. Negotiating enterprise agreements and multi-year SLAs reduces dependence and preserves margins.
- Vendor lock-in raises switching costs
- Integration costs impact margins
- Enterprise agreements mitigate dependence
High supplier leverage, cap-rate compression and tighter debt raise refinancing and execution risk
Supplier leverage is high: scarce grocery‑anchored infill sites drove 2024 bidding and ~75–150 bps cap‑rate compression, raising acquisition costs and execution risk. Debt tightening (fed funds ~5.25–5.50%, 10y ~4.5%) increased refinancing pressure and lender covenants. Local contractors, permits and proptech vendors raise switching costs and can compress NOI if not contractually mitigated.
| Metric | 2024 |
|---|---|
| Cap‑rate move | ‑75 to ‑150 bps |
| Fed funds | 5.25–5.50% |
| 10‑yr | ~4.5% |
What is included in the product
Detailed Word Document
Concise Porter's Five Forces overview tailored to Wheeler Real Estate Investment Trust, uncovering competitive dynamics, buyer/supplier leverage, entry barriers, substitute threats, and strategic pressures shaping its profitability.
Customizable Excel Spreadsheet
A concise one-sheet Porter's Five Forces for Wheeler Real Estate Investment Trust—visualizes competitive pressures and relief strategies with customizable ratings and an instant radar chart for boardroom-ready, decision-focused insight.
Customers Bargaining Power
Anchor grocers negotiate hard
Grocery anchors drive traffic and occupancy—2024 data show grocery-anchored centers maintaining about 95% occupancy—giving anchors strong rent and tenant-improvement leverage. They routinely demand co-tenancy clauses and category exclusives, shifting relocation and vacancy risk to landlords. High credit quality of chains lowers default risk but concentrates bargaining power, and renewal terms often cap rent growth, compressing upside for Wheeler REIT.
Inline tenant fragmentation
Inline tenant fragmentation leaves Wheeler with many small, individually weak tenants, with inline spaces making up roughly 60% of street‑level units across its centers; 2024 US neighborhood center vacancy hovered near 7.2% (CoStar), raising TI and downtime costs. Vacancy and higher TI needs lift effective occupancy costs, while aggregated tenant cohorts still shape merchandising and center vitality. Proactive leasing and shorter concessions in 2024 reduced rent abatements and TI allowances across comparable portfolios.
Alternative locations nearby
When trade areas host competing centers tenants can leverage options to shop for better lease terms; national retail vacancy averaged about 6.0% in 2024, increasing tenant bargaining in crowded submarkets. Visibility, access and co-tenancy drive willingness to pay, with premium sites commanding roughly 15% higher rents. Strong anchors and stable sales reduce tenant leverage, while weak centers face higher concessions and longer downtime.
Credit and omni-channel demands
National retailers demand flexible space, shorter terms, and tenant improvements tied to omni-channel needs, pressuring landlords for data sharing and cooperative marketing; 2024 U.S. e-commerce penetration stood near 16.2% (U.S. Census), increasing leverage for digitally aligned tenants. Landlords offering traffic analytics and POS integration gain negotiating strength, while others accept lower rents or higher TI to secure anchor brands.
- Flexible leases: shorter terms, pop-up-friendly
- TI focus: omni-channel buildouts, curbside/POS
- Data leverage: traffic analytics = bargaining power
- Concessions: rent/economic tradeoffs to secure tenants
Co-tenancy and kick-out clauses
Leases tied to anchor performance shift occupancy and sales risk to Wheeler by allowing rent resets or tenant termination if anchors underperform; in 2024 co-tenancy and kick-out activity remained a prominent pressure point for shopping-center REITs. Anchor closures can trigger rent reductions or termination rights, amplifying tenant bargaining leverage during downturns. Preserving anchor health is therefore critical to protect Wheeler’s rent roll and same-store income.
- Co-tenancy clauses increase landlord exposure to anchor failure
- Kick-out rights raise effective customer power in downturns
- Maintaining anchor performance is essential to stabilize rent roll
Grocery anchors 95% cap rent upside; inline vacancies and 16.2% e‑commerce aid tenants
Grocery anchors (95% occupancy, 2024) hold strong leverage via co-tenancy and exclusives, limiting Wheeler’s rent upside. Inline tenants (~60% of street units) and 7.2% neighborhood vacancy raise TI/downtime costs and concessions. National retail vacancy 6.0% and 16.2% e‑commerce penetration boost negotiating power of digitally aligned tenants.
| Metric | 2024 |
|---|---|
| Grocery occupancy | 95% |
| Inline share | 60% |
| Neighborhood vacancy | 7.2% |
| E-commerce penetration | 16.2% |
Preview the Actual Deliverable
Wheeler Real Estate Investment Trust Porter's Five Forces Analysis
This Porter’s Five Forces analysis for Wheeler Real Estate Investment Trust examines competitive rivalry across its property portfolio, buyer and supplier bargaining power, threats from new entrants and substitutes, and regulatory and macroeconomic pressures shaping returns. The document shown is the same professionally written analysis you'll receive—fully formatted and ready to use.
Description
Don't Miss the Bigger Picture
Wheeler Real Estate Investment Trust faces moderate tenant bargaining power, rising market competition, and selective supplier influence, while threats from new entrants and substitutes hinge on capital intensity and portfolio specialization. This snapshot highlights key pressures shaping margin and growth potential. Unlock the full Porter's Five Forces Analysis to explore force-by-force ratings, strategic implications, and actionable recommendations.
Suppliers Bargaining Power
Constrained quality site pipeline
Scarcity of high-traffic, grocery-anchored centers in infill submarkets gives select landowners outsized leverage on price and deal terms; limited replacement supply drove bidding intensity in 2024, compressing cap rates and lowering yield-on-cost across transactions, while longer sourcing timelines in 2024 heightened execution and hold-period risk.
Capital providers set terms
Capital providers set terms for Wheeler REIT: debt markets tightened in 2024 as the federal funds rate sat near 5.25–5.50% and the 10‑year Treasury averaged about 4.5%, letting lenders raise rates, tighten covenants and shrink proceeds. Higher rates amplify refinancing risk and spread volatility, boosting supplier leverage. Equity raises often require discounts that dilute holders, constraining growth and redevelopment optionality.
Construction and maintenance vendors
Specialized contractors, materials, and facility services can push costs when labor or materials tighten, a dynamic that remained visible through 2024 as supply-chain constraints and skilled-labor scarcity affected construction markets. Local vendor concentration in Wheeler's secondary and tertiary markets limits alternatives, raising switching costs. Cost pass-throughs to tenants are often neither contractual nor immediate, so rising vendor prices can compress NOI if not actively managed through procurement strategies and lease terms.
Municipal approvals and utilities
Zoning, permits and utility hookups act as quasi-suppliers for Wheeler REIT, controlling timelines (often adding 6–12 months) and fees (commonly 1–3% of project cost), so regulatory delays directly compress leasing velocity and redevelopment IRR. Impact fees and midstream code changes can raise costs—sometimes up to 5%—shifting project economics after underwriting. Deep local relationships and permitting experience partially mitigate these risks.
- Zoning delay: 6–12 months
- Permit/ hookup fees: 1–3% of cost
- Impact fees/code changes: up to 5%
- Mitigation: local relationships, permitting expertise
Technology and data platforms
Technology and data platforms such as Yardi, MRI, VTS and RealPage drive sticky leasing, foot-traffic analytics and proptech services that can raise fees and compress operating margins through vendor lock-in and integration costs; many REITs report integration and switching costs as a material operational barrier in 2024. Negotiating enterprise agreements and multi-year SLAs reduces dependence and preserves margins.
- Vendor lock-in raises switching costs
- Integration costs impact margins
- Enterprise agreements mitigate dependence
High supplier leverage, cap-rate compression and tighter debt raise refinancing and execution risk
Supplier leverage is high: scarce grocery‑anchored infill sites drove 2024 bidding and ~75–150 bps cap‑rate compression, raising acquisition costs and execution risk. Debt tightening (fed funds ~5.25–5.50%, 10y ~4.5%) increased refinancing pressure and lender covenants. Local contractors, permits and proptech vendors raise switching costs and can compress NOI if not contractually mitigated.
| Metric | 2024 |
|---|---|
| Cap‑rate move | ‑75 to ‑150 bps |
| Fed funds | 5.25–5.50% |
| 10‑yr | ~4.5% |
What is included in the product
Detailed Word Document
Concise Porter's Five Forces overview tailored to Wheeler Real Estate Investment Trust, uncovering competitive dynamics, buyer/supplier leverage, entry barriers, substitute threats, and strategic pressures shaping its profitability.
Customizable Excel Spreadsheet
A concise one-sheet Porter's Five Forces for Wheeler Real Estate Investment Trust—visualizes competitive pressures and relief strategies with customizable ratings and an instant radar chart for boardroom-ready, decision-focused insight.
Customers Bargaining Power
Anchor grocers negotiate hard
Grocery anchors drive traffic and occupancy—2024 data show grocery-anchored centers maintaining about 95% occupancy—giving anchors strong rent and tenant-improvement leverage. They routinely demand co-tenancy clauses and category exclusives, shifting relocation and vacancy risk to landlords. High credit quality of chains lowers default risk but concentrates bargaining power, and renewal terms often cap rent growth, compressing upside for Wheeler REIT.
Inline tenant fragmentation
Inline tenant fragmentation leaves Wheeler with many small, individually weak tenants, with inline spaces making up roughly 60% of street‑level units across its centers; 2024 US neighborhood center vacancy hovered near 7.2% (CoStar), raising TI and downtime costs. Vacancy and higher TI needs lift effective occupancy costs, while aggregated tenant cohorts still shape merchandising and center vitality. Proactive leasing and shorter concessions in 2024 reduced rent abatements and TI allowances across comparable portfolios.
Alternative locations nearby
When trade areas host competing centers tenants can leverage options to shop for better lease terms; national retail vacancy averaged about 6.0% in 2024, increasing tenant bargaining in crowded submarkets. Visibility, access and co-tenancy drive willingness to pay, with premium sites commanding roughly 15% higher rents. Strong anchors and stable sales reduce tenant leverage, while weak centers face higher concessions and longer downtime.
Credit and omni-channel demands
National retailers demand flexible space, shorter terms, and tenant improvements tied to omni-channel needs, pressuring landlords for data sharing and cooperative marketing; 2024 U.S. e-commerce penetration stood near 16.2% (U.S. Census), increasing leverage for digitally aligned tenants. Landlords offering traffic analytics and POS integration gain negotiating strength, while others accept lower rents or higher TI to secure anchor brands.
- Flexible leases: shorter terms, pop-up-friendly
- TI focus: omni-channel buildouts, curbside/POS
- Data leverage: traffic analytics = bargaining power
- Concessions: rent/economic tradeoffs to secure tenants
Co-tenancy and kick-out clauses
Leases tied to anchor performance shift occupancy and sales risk to Wheeler by allowing rent resets or tenant termination if anchors underperform; in 2024 co-tenancy and kick-out activity remained a prominent pressure point for shopping-center REITs. Anchor closures can trigger rent reductions or termination rights, amplifying tenant bargaining leverage during downturns. Preserving anchor health is therefore critical to protect Wheeler’s rent roll and same-store income.
- Co-tenancy clauses increase landlord exposure to anchor failure
- Kick-out rights raise effective customer power in downturns
- Maintaining anchor performance is essential to stabilize rent roll
Grocery anchors 95% cap rent upside; inline vacancies and 16.2% e‑commerce aid tenants
Grocery anchors (95% occupancy, 2024) hold strong leverage via co-tenancy and exclusives, limiting Wheeler’s rent upside. Inline tenants (~60% of street units) and 7.2% neighborhood vacancy raise TI/downtime costs and concessions. National retail vacancy 6.0% and 16.2% e‑commerce penetration boost negotiating power of digitally aligned tenants.
| Metric | 2024 |
|---|---|
| Grocery occupancy | 95% |
| Inline share | 60% |
| Neighborhood vacancy | 7.2% |
| E-commerce penetration | 16.2% |
Preview the Actual Deliverable
Wheeler Real Estate Investment Trust Porter's Five Forces Analysis
This Porter’s Five Forces analysis for Wheeler Real Estate Investment Trust examines competitive rivalry across its property portfolio, buyer and supplier bargaining power, threats from new entrants and substitutes, and regulatory and macroeconomic pressures shaping returns. The document shown is the same professionally written analysis you'll receive—fully formatted and ready to use.











