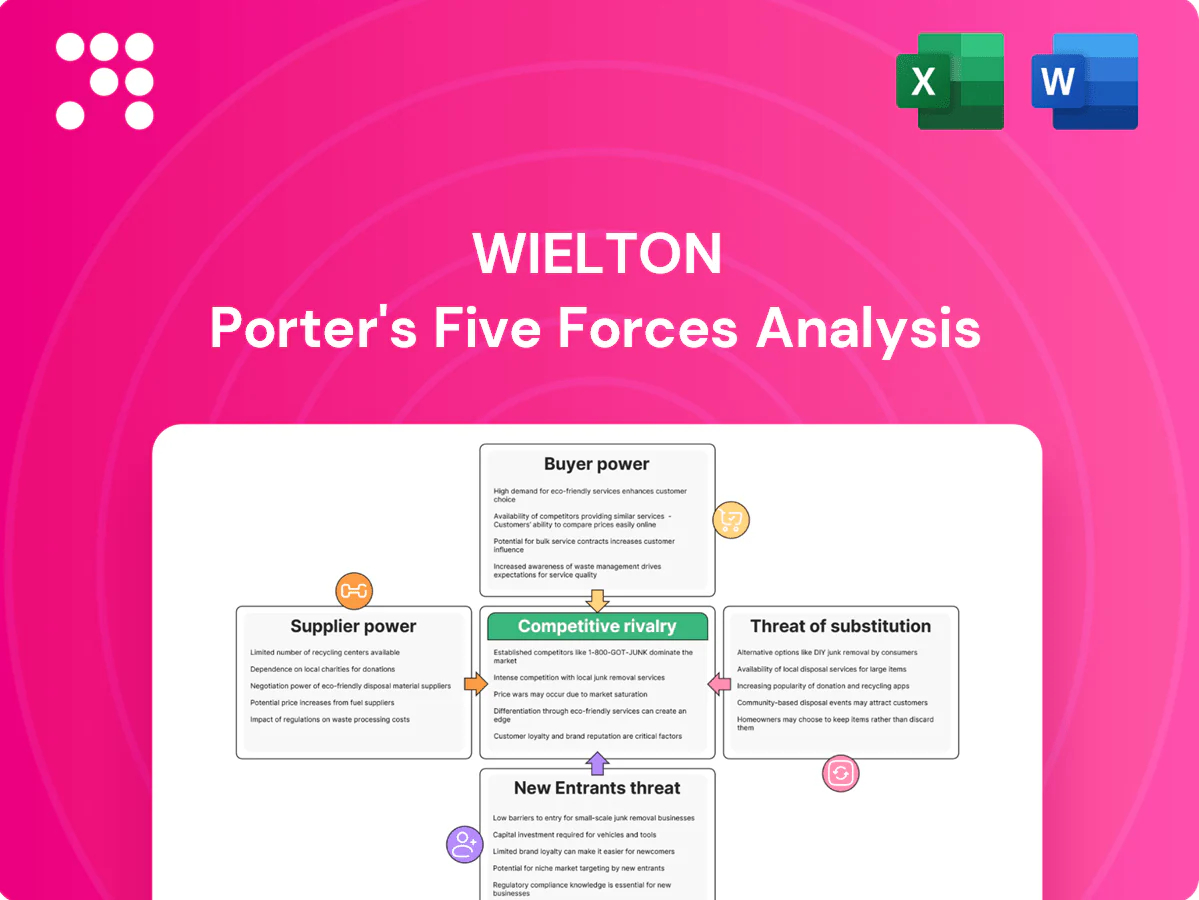
Wielton Porter's Five Forces Analysis

A Must-Have Tool for Decision-Makers
Wielton’s Porter's Five Forces highlights intense competitive rivalry within commercial trailer manufacturing, moderate supplier power tied to specialized components, shifting buyer bargaining from fleet consolidation, and tangible threats from new entrants and substitutes driven by alternative logistics solutions. This brief snapshot only scratches the surface. Unlock the full Porter's Five Forces Analysis to explore Wielton’s competitive dynamics, market pressures, and strategic advantages in detail.
Suppliers Bargaining Power

Concentrated key component vendors
Axles, braking systems and electrics in Europe are concentrated among BPW, SAF-Holland and Knorr-Bremse, giving suppliers estimated combined share above 50% and raising switching costs and leverage. Dependence on these vendors can tighten pricing and lead times in upcycles; buyers report lead-time spikes of 20–40% during 2021–24 upturns. Dual-sourcing is viable but certification and integration often take 6–18 months; 3–5 year volume contracts commonly moderate supplier power.
Steel and aluminum price volatility
Steel and aluminium represent a large share of Wielton’s bill-of-materials, tying margins to commodity swings; LME aluminium averaged about 2,400 USD/tonne in 2024 while US hot-rolled coil traded near 900 USD/tonne, compressing OEM margins as suppliers pass costs faster than order repricing allows. Hedging and index-linked contracts lower volatility but do not eliminate basis risk; regionalising sourcing cuts freight and tariff exposure.

Specialized components and homologation
As of 2024, Regulation (EU) 2018/858 means components must meet EU type-approval and OEM specs, narrowing alternative sources; supplier content often exceeds 60% of trailer BOM, intensifying supplier leverage. Engineering validation cycles of 6–12 months create switching friction, while suppliers can shape design-to-cost in early stages; close collaboration lowers total cost but raises dependency and concentration risk.

Logistics and lead-time constraints
Just-in-time delivery for Wielton's large structures is highly sensitive to transport bottlenecks; 2024 Red Sea and Suez rerouting episodes showed disruptions raise expediting costs and boost supplier negotiation power. Nearshoring and buffer stocks offset delays, while digital supply-visibility cuts surprises but adds IT and monitoring overhead.
- Higher expediting = more supplier leverage
- Nearshoring + buffers = lower delay risk
- Visibility tools = fewer shocks, higher Opex
Energy and labor cost pass-through
Energy-intensive upstream processing lifts supplier break-even—EU industrial electricity averaged about €0.17/kWh in 2024, pushing input cost bases higher. Wage inflation in EU manufacturing corridors ran near 5% in 2024, feeding into supplier pricing while contractual surcharges limit OEM bargaining flexibility. OEM productivity gains of roughly 3%–4% help partially offset passed-through costs.
- Energy: €0.17/kWh (EU 2024)
- Wage inflation: ~5% (EU manufacturing corridors, 2024)
- Surcharges: often contractual, reduce OEM leverage
- OEM productivity: ~3%–4% offset
High supplier concentration (>50%) and 20–40% lead-time spikes raise pricing power
Supplier concentration in axles/brakes/electrics (>50% share), commodity exposure (Al 2,400 USD/t; HRC ~900 USD/t in 2024) and EU type-approval friction (6–18 months) create strong supplier leverage; lead-time spikes of 20–40% (2021–24) amplify pricing power; hedging, 3–5y contracts and nearshoring mitigate but raise costs.
| Metric | 2024/Range |
|---|---|
| Concentration (key components) | >50% |
| Aluminium (LME) | ~2,400 USD/t |
| Hot‑rolled coil | ~900 USD/t |
| EU electricity | €0.17/kWh |
| Lead‑time spikes | 20–40% |
| Certification/switching | 6–18 months |
What is included in the product
 Detailed Word Document
Uncovers key drivers of competition, supplier and buyer power, substitutes, new-entry risks and rival intensity tailored to Wielton, identifying disruptive threats and strategic levers; delivered in editable Word format for use in business plans, investor materials and internal strategy decks.

 Customizable Excel Spreadsheet
One-sheet Porter’s Five Forces for Wielton—clear radar visuals and editable pressure levels to instantly pinpoint competitive pain points, customize scenarios, and drop directly into decks or dashboards for faster strategic decisions.
Customers Bargaining Power

Large fleet and tender dominance
Logistics, construction and agricultural fleets buy in volumes via tenders, pressuring price and payment terms as bulk contracts commonly seek 5–20% discounts and extended payment windows (60–120 days). Multi-year framework agreements (typically 2–5 years) demand bundled services, maintenance and lifecycle cost guarantees. Certification (ISO, ADR) and demonstrable TCO analyses are prerequisites to win, while referenceability and past awards drive repeat procurement.
Price sensitivity and cyclical demand
Customers in the trailer market are highly price and total-cost-of-ownership driven and routinely defer capex in downturns, shifting bargaining power to buyers when orders are canceled or delayed. Flexible financing, lease-to-own and buy-back programs have proven effective at retaining volume. Wielton's focus on production agility and modular platforms reduces the need for blanket discounting and preserves margins.

Customization and switching costs
Specification fit, body options and telematics integration create moderate switching costs for Wielton customers, as custom builds and integrated fleet data raise re-specification effort and average order lead times by months. Telematics penetration in European trailers reached about 50% of new units in 2024, enabling data-enabled maintenance plans that deepen stickiness. Strong aftersales and service networks lower churn, locking customers in post-sale.

Service coverage and uptime expectations
Buyers prioritize pan-European service points, spare parts availability and fast repairs; weak coverage increases downtime risk and strengthens buyer leverage on warranties. Robust service-level agreements support pricing power, while predictive maintenance programs—increasingly adopted in 2024—cut warranty disputes and shorten repair cycles.
- coverage: pan-European network reduces downtime
- parts: spare availability lowers replacement lead time
- SLA: defends pricing, limits warranty claims
- predictive: reduces disputes and repair time
Information transparency
- Benchmarking: 68% online configurator use (2024)
- Residual impact: trailer residuals swung 5–8% YoY (2024)
- Comparability: instant quotes raise price transparency
- Strategy: differentiate via lifecycle economics/TCO
Buyers demand 5-20% discounts and long terms - TCO, uptime and service decide deals
Buyers exert strong price pressure via tenders—bulk contracts commonly demand 5–20% discounts and 60–120 day payment terms. Telematics and custom specs raise switching costs (telematics in ~50% of new trailers in 2024) but aftersales and SLAs are decisive. Digital benchmarking (68% use online tools in 2024) and ±5–8% YoY residual swings shift purchase focus to TCO, service and uptime.
| Metric | 2024 Value |
|---|---|
| Typical discount | 5–20% |
| Payment terms | 60–120 days |
| Telematics penetration | ~50% |
| Online benchmarking | 68% |
| Residual YoY swing | ±5–8% |
Same Document Delivered
Wielton Porter's Five Forces Analysis
This preview shows the exact Wielton Porter’s Five Forces analysis you’ll receive—no mockups or placeholders. The file is professionally written, fully formatted, and ready for immediate download once you complete your purchase. It contains supplier power, buyer power, competitive rivalry, threat of substitution, and barriers to entry insights specific to Wielton. What you see is what you get.

A Must-Have Tool for Decision-Makers
Wielton’s Porter's Five Forces highlights intense competitive rivalry within commercial trailer manufacturing, moderate supplier power tied to specialized components, shifting buyer bargaining from fleet consolidation, and tangible threats from new entrants and substitutes driven by alternative logistics solutions. This brief snapshot only scratches the surface. Unlock the full Porter's Five Forces Analysis to explore Wielton’s competitive dynamics, market pressures, and strategic advantages in detail.
Suppliers Bargaining Power
Concentrated key component vendors
Axles, braking systems and electrics in Europe are concentrated among BPW, SAF-Holland and Knorr-Bremse, giving suppliers estimated combined share above 50% and raising switching costs and leverage. Dependence on these vendors can tighten pricing and lead times in upcycles; buyers report lead-time spikes of 20–40% during 2021–24 upturns. Dual-sourcing is viable but certification and integration often take 6–18 months; 3–5 year volume contracts commonly moderate supplier power.
Steel and aluminum price volatility
Steel and aluminium represent a large share of Wielton’s bill-of-materials, tying margins to commodity swings; LME aluminium averaged about 2,400 USD/tonne in 2024 while US hot-rolled coil traded near 900 USD/tonne, compressing OEM margins as suppliers pass costs faster than order repricing allows. Hedging and index-linked contracts lower volatility but do not eliminate basis risk; regionalising sourcing cuts freight and tariff exposure.
Specialized components and homologation
As of 2024, Regulation (EU) 2018/858 means components must meet EU type-approval and OEM specs, narrowing alternative sources; supplier content often exceeds 60% of trailer BOM, intensifying supplier leverage. Engineering validation cycles of 6–12 months create switching friction, while suppliers can shape design-to-cost in early stages; close collaboration lowers total cost but raises dependency and concentration risk.
Logistics and lead-time constraints
Just-in-time delivery for Wielton's large structures is highly sensitive to transport bottlenecks; 2024 Red Sea and Suez rerouting episodes showed disruptions raise expediting costs and boost supplier negotiation power. Nearshoring and buffer stocks offset delays, while digital supply-visibility cuts surprises but adds IT and monitoring overhead.
- Higher expediting = more supplier leverage
- Nearshoring + buffers = lower delay risk
- Visibility tools = fewer shocks, higher Opex
Energy and labor cost pass-through
Energy-intensive upstream processing lifts supplier break-even—EU industrial electricity averaged about €0.17/kWh in 2024, pushing input cost bases higher. Wage inflation in EU manufacturing corridors ran near 5% in 2024, feeding into supplier pricing while contractual surcharges limit OEM bargaining flexibility. OEM productivity gains of roughly 3%–4% help partially offset passed-through costs.
- Energy: €0.17/kWh (EU 2024)
- Wage inflation: ~5% (EU manufacturing corridors, 2024)
- Surcharges: often contractual, reduce OEM leverage
- OEM productivity: ~3%–4% offset
High supplier concentration (>50%) and 20–40% lead-time spikes raise pricing power
Supplier concentration in axles/brakes/electrics (>50% share), commodity exposure (Al 2,400 USD/t; HRC ~900 USD/t in 2024) and EU type-approval friction (6–18 months) create strong supplier leverage; lead-time spikes of 20–40% (2021–24) amplify pricing power; hedging, 3–5y contracts and nearshoring mitigate but raise costs.
| Metric | 2024/Range |
|---|---|
| Concentration (key components) | >50% |
| Aluminium (LME) | ~2,400 USD/t |
| Hot‑rolled coil | ~900 USD/t |
| EU electricity | €0.17/kWh |
| Lead‑time spikes | 20–40% |
| Certification/switching | 6–18 months |
What is included in the product
Detailed Word Document
Uncovers key drivers of competition, supplier and buyer power, substitutes, new-entry risks and rival intensity tailored to Wielton, identifying disruptive threats and strategic levers; delivered in editable Word format for use in business plans, investor materials and internal strategy decks.
Customizable Excel Spreadsheet
One-sheet Porter’s Five Forces for Wielton—clear radar visuals and editable pressure levels to instantly pinpoint competitive pain points, customize scenarios, and drop directly into decks or dashboards for faster strategic decisions.
Customers Bargaining Power
Large fleet and tender dominance
Logistics, construction and agricultural fleets buy in volumes via tenders, pressuring price and payment terms as bulk contracts commonly seek 5–20% discounts and extended payment windows (60–120 days). Multi-year framework agreements (typically 2–5 years) demand bundled services, maintenance and lifecycle cost guarantees. Certification (ISO, ADR) and demonstrable TCO analyses are prerequisites to win, while referenceability and past awards drive repeat procurement.
Price sensitivity and cyclical demand
Customers in the trailer market are highly price and total-cost-of-ownership driven and routinely defer capex in downturns, shifting bargaining power to buyers when orders are canceled or delayed. Flexible financing, lease-to-own and buy-back programs have proven effective at retaining volume. Wielton's focus on production agility and modular platforms reduces the need for blanket discounting and preserves margins.
Customization and switching costs
Specification fit, body options and telematics integration create moderate switching costs for Wielton customers, as custom builds and integrated fleet data raise re-specification effort and average order lead times by months. Telematics penetration in European trailers reached about 50% of new units in 2024, enabling data-enabled maintenance plans that deepen stickiness. Strong aftersales and service networks lower churn, locking customers in post-sale.
Service coverage and uptime expectations
Buyers prioritize pan-European service points, spare parts availability and fast repairs; weak coverage increases downtime risk and strengthens buyer leverage on warranties. Robust service-level agreements support pricing power, while predictive maintenance programs—increasingly adopted in 2024—cut warranty disputes and shorten repair cycles.
- coverage: pan-European network reduces downtime
- parts: spare availability lowers replacement lead time
- SLA: defends pricing, limits warranty claims
- predictive: reduces disputes and repair time
Information transparency
- Benchmarking: 68% online configurator use (2024)
- Residual impact: trailer residuals swung 5–8% YoY (2024)
- Comparability: instant quotes raise price transparency
- Strategy: differentiate via lifecycle economics/TCO
Buyers demand 5-20% discounts and long terms - TCO, uptime and service decide deals
Buyers exert strong price pressure via tenders—bulk contracts commonly demand 5–20% discounts and 60–120 day payment terms. Telematics and custom specs raise switching costs (telematics in ~50% of new trailers in 2024) but aftersales and SLAs are decisive. Digital benchmarking (68% use online tools in 2024) and ±5–8% YoY residual swings shift purchase focus to TCO, service and uptime.
| Metric | 2024 Value |
|---|---|
| Typical discount | 5–20% |
| Payment terms | 60–120 days |
| Telematics penetration | ~50% |
| Online benchmarking | 68% |
| Residual YoY swing | ±5–8% |
Same Document Delivered
Wielton Porter's Five Forces Analysis
This preview shows the exact Wielton Porter’s Five Forces analysis you’ll receive—no mockups or placeholders. The file is professionally written, fully formatted, and ready for immediate download once you complete your purchase. It contains supplier power, buyer power, competitive rivalry, threat of substitution, and barriers to entry insights specific to Wielton. What you see is what you get.
Description
A Must-Have Tool for Decision-Makers
Wielton’s Porter's Five Forces highlights intense competitive rivalry within commercial trailer manufacturing, moderate supplier power tied to specialized components, shifting buyer bargaining from fleet consolidation, and tangible threats from new entrants and substitutes driven by alternative logistics solutions. This brief snapshot only scratches the surface. Unlock the full Porter's Five Forces Analysis to explore Wielton’s competitive dynamics, market pressures, and strategic advantages in detail.
Suppliers Bargaining Power
Concentrated key component vendors
Axles, braking systems and electrics in Europe are concentrated among BPW, SAF-Holland and Knorr-Bremse, giving suppliers estimated combined share above 50% and raising switching costs and leverage. Dependence on these vendors can tighten pricing and lead times in upcycles; buyers report lead-time spikes of 20–40% during 2021–24 upturns. Dual-sourcing is viable but certification and integration often take 6–18 months; 3–5 year volume contracts commonly moderate supplier power.
Steel and aluminum price volatility
Steel and aluminium represent a large share of Wielton’s bill-of-materials, tying margins to commodity swings; LME aluminium averaged about 2,400 USD/tonne in 2024 while US hot-rolled coil traded near 900 USD/tonne, compressing OEM margins as suppliers pass costs faster than order repricing allows. Hedging and index-linked contracts lower volatility but do not eliminate basis risk; regionalising sourcing cuts freight and tariff exposure.
Specialized components and homologation
As of 2024, Regulation (EU) 2018/858 means components must meet EU type-approval and OEM specs, narrowing alternative sources; supplier content often exceeds 60% of trailer BOM, intensifying supplier leverage. Engineering validation cycles of 6–12 months create switching friction, while suppliers can shape design-to-cost in early stages; close collaboration lowers total cost but raises dependency and concentration risk.
Logistics and lead-time constraints
Just-in-time delivery for Wielton's large structures is highly sensitive to transport bottlenecks; 2024 Red Sea and Suez rerouting episodes showed disruptions raise expediting costs and boost supplier negotiation power. Nearshoring and buffer stocks offset delays, while digital supply-visibility cuts surprises but adds IT and monitoring overhead.
- Higher expediting = more supplier leverage
- Nearshoring + buffers = lower delay risk
- Visibility tools = fewer shocks, higher Opex
Energy and labor cost pass-through
Energy-intensive upstream processing lifts supplier break-even—EU industrial electricity averaged about €0.17/kWh in 2024, pushing input cost bases higher. Wage inflation in EU manufacturing corridors ran near 5% in 2024, feeding into supplier pricing while contractual surcharges limit OEM bargaining flexibility. OEM productivity gains of roughly 3%–4% help partially offset passed-through costs.
- Energy: €0.17/kWh (EU 2024)
- Wage inflation: ~5% (EU manufacturing corridors, 2024)
- Surcharges: often contractual, reduce OEM leverage
- OEM productivity: ~3%–4% offset
High supplier concentration (>50%) and 20–40% lead-time spikes raise pricing power
Supplier concentration in axles/brakes/electrics (>50% share), commodity exposure (Al 2,400 USD/t; HRC ~900 USD/t in 2024) and EU type-approval friction (6–18 months) create strong supplier leverage; lead-time spikes of 20–40% (2021–24) amplify pricing power; hedging, 3–5y contracts and nearshoring mitigate but raise costs.
| Metric | 2024/Range |
|---|---|
| Concentration (key components) | >50% |
| Aluminium (LME) | ~2,400 USD/t |
| Hot‑rolled coil | ~900 USD/t |
| EU electricity | €0.17/kWh |
| Lead‑time spikes | 20–40% |
| Certification/switching | 6–18 months |
What is included in the product
Detailed Word Document
Uncovers key drivers of competition, supplier and buyer power, substitutes, new-entry risks and rival intensity tailored to Wielton, identifying disruptive threats and strategic levers; delivered in editable Word format for use in business plans, investor materials and internal strategy decks.
Customizable Excel Spreadsheet
One-sheet Porter’s Five Forces for Wielton—clear radar visuals and editable pressure levels to instantly pinpoint competitive pain points, customize scenarios, and drop directly into decks or dashboards for faster strategic decisions.
Customers Bargaining Power
Large fleet and tender dominance
Logistics, construction and agricultural fleets buy in volumes via tenders, pressuring price and payment terms as bulk contracts commonly seek 5–20% discounts and extended payment windows (60–120 days). Multi-year framework agreements (typically 2–5 years) demand bundled services, maintenance and lifecycle cost guarantees. Certification (ISO, ADR) and demonstrable TCO analyses are prerequisites to win, while referenceability and past awards drive repeat procurement.
Price sensitivity and cyclical demand
Customers in the trailer market are highly price and total-cost-of-ownership driven and routinely defer capex in downturns, shifting bargaining power to buyers when orders are canceled or delayed. Flexible financing, lease-to-own and buy-back programs have proven effective at retaining volume. Wielton's focus on production agility and modular platforms reduces the need for blanket discounting and preserves margins.
Customization and switching costs
Specification fit, body options and telematics integration create moderate switching costs for Wielton customers, as custom builds and integrated fleet data raise re-specification effort and average order lead times by months. Telematics penetration in European trailers reached about 50% of new units in 2024, enabling data-enabled maintenance plans that deepen stickiness. Strong aftersales and service networks lower churn, locking customers in post-sale.
Service coverage and uptime expectations
Buyers prioritize pan-European service points, spare parts availability and fast repairs; weak coverage increases downtime risk and strengthens buyer leverage on warranties. Robust service-level agreements support pricing power, while predictive maintenance programs—increasingly adopted in 2024—cut warranty disputes and shorten repair cycles.
- coverage: pan-European network reduces downtime
- parts: spare availability lowers replacement lead time
- SLA: defends pricing, limits warranty claims
- predictive: reduces disputes and repair time
Information transparency
- Benchmarking: 68% online configurator use (2024)
- Residual impact: trailer residuals swung 5–8% YoY (2024)
- Comparability: instant quotes raise price transparency
- Strategy: differentiate via lifecycle economics/TCO
Buyers demand 5-20% discounts and long terms - TCO, uptime and service decide deals
Buyers exert strong price pressure via tenders—bulk contracts commonly demand 5–20% discounts and 60–120 day payment terms. Telematics and custom specs raise switching costs (telematics in ~50% of new trailers in 2024) but aftersales and SLAs are decisive. Digital benchmarking (68% use online tools in 2024) and ±5–8% YoY residual swings shift purchase focus to TCO, service and uptime.
| Metric | 2024 Value |
|---|---|
| Typical discount | 5–20% |
| Payment terms | 60–120 days |
| Telematics penetration | ~50% |
| Online benchmarking | 68% |
| Residual YoY swing | ±5–8% |
Same Document Delivered
Wielton Porter's Five Forces Analysis
This preview shows the exact Wielton Porter’s Five Forces analysis you’ll receive—no mockups or placeholders. The file is professionally written, fully formatted, and ready for immediate download once you complete your purchase. It contains supplier power, buyer power, competitive rivalry, threat of substitution, and barriers to entry insights specific to Wielton. What you see is what you get.











