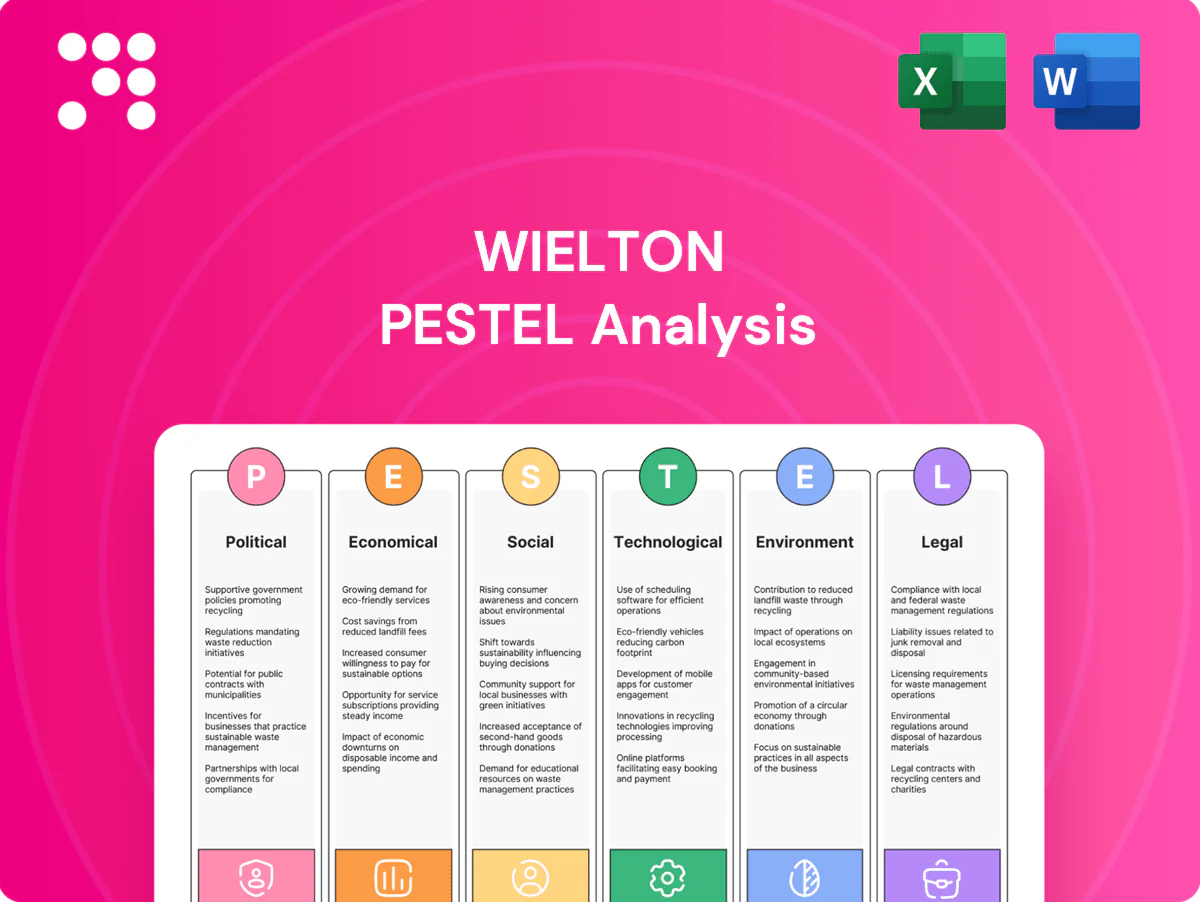
Wielton PESTLE Analysis

Your Competitive Advantage Starts with This Report
Unlock how political shifts, economic cycles, and environmental trends are reshaping Wielton’s market position in our concise PESTLE snapshot; it highlights risk drivers and strategic opportunities for investors and managers. This ready-to-use analysis saves hours of research and supports smarter decisions. Purchase the full PESTLE for the complete, actionable breakdown.
Political factors

EU transport and industry policy
EU transport and industry policy channels the MFF 2021–27 €1.074 trillion plus NextGenerationEU €750bn into infrastructure and cohesion projects, directly boosting demand for trailers, tippers and construction transport.
State-aid and industrial policy permit targeted subsidies and co-financing for local manufacturing and innovation, with member states routing billions into transport-related projects.
Post-election reprioritisations can reallocate regional funds; Wielton should align bids and production capacity with active EU programmes to capture tenders.
Trade relations and tariffs
Customs rules, sanctions and antidumping measures have tightened steel input costs and access to third markets, with EU anti-dumping duties on certain flat steels reaching double-digit percentages in recent years, hitting margins on trailers. Stable EU–UK trade terms remain critical for cross-Channel fleets that handle the majority of Polish-UK goods flows. Geopolitical tensions in CEE have intermittently closed corridors and pushed logistics costs up by double digits, so diversified sourcing and market mix hedge policy shocks.

Public procurement dynamics
Government-backed infrastructure and municipal projects, supported by EU cohesion funds to Poland of about 76.8 billion EUR for 2021–27, boost demand for tippers and specialized trailers. Public procurement represents roughly 14% of EU GDP, so local content preferences can sway supplier selection. Transparent tendering favors compliant, certified producers like Wielton. Public-sector partnerships help stabilize otherwise cyclical revenue.

Energy and fuel security policy
State energy strategies like the EU Fit for 55 and national fuel security plans affect transport costs for Wielton clients, shifting fleet renewal toward 8–12 year cycles; diesel retail prices averaged about €1.70/L in 2024 while EU industrial electricity averaged ~€0.16/kWh, altering TCO and payback for electric or hybrid tractors.
- Incentives push lightweight, aerodynamic trailer specs
- Policy-driven diesel/electric volatility changes TCO
- Efficiency-focused models match regulatory trends
Labor mobility and migration
EU labor mobility rules shape Wielton’s access to skilled production workers and drivers; Poland unemployment at 2.8% (2024) supports recruitment while an EU truck driver shortage of roughly 400,000 (IRU estimate) pushes up driver wages. Political shifts on migration in 2024–25 can tighten or ease labor pools, altering site economics and incentive use. HR must track policy to forecast wage costs, hiring timelines and plant staffing.
- EU mobility: impacts skilled labor supply
- Poland unemployment 2.8% (2024)
- Driver shortage ≈400,000 (IRU)
- Wage/incentive variance shifts plant footprints
EU funds €1.824tn drive trailer demand; Poland benefits €76.8bn
EU MFF 2021–27 €1.074tn plus NextGenerationEU €750bn drive infrastructure demand for trailers and tippers.
Poland cohesion funds €76.8bn (2021–27), public procurement ~14% EU GDP — local content and compliant suppliers like Wielton gain advantage.
Input costs hit by EU anti‑dumping on steels; diesel €1.70/L (2024), electricity €0.16/kWh (2024) shift TCO toward efficiency.
Poland unemployment 2.8% (2024); EU truck driver shortage ≈400,000 raises wages and affects fleet demand.
| Indicator | Value |
|---|---|
| MFF + NGEU | €1.824tn |
| Poland cohesion | €76.8bn |
| Diesel (2024) | €1.70/L |
| Electricity (EU, 2024) | €0.16/kWh |
| Unemployment PL (2024) | 2.8% |
| Driver shortage (IRU) | ≈400,000 |
What is included in the product
 Detailed Word Document
Explores how macro-environmental forces uniquely impact Wielton across Political, Economic, Social, Technological, Environmental, and Legal dimensions, with data-driven examples tied to its European commercial vehicle and trailer market. Each section offers forward-looking insights and actionable implications to help executives, investors, and strategists identify risks, opportunities, and strategic responses.

 Customizable Excel Spreadsheet
Concise, visually segmented Wielton PESTLE that’s drop‑in ready for presentations, easily shared and annotated to align teams quickly on external risks, market positioning and strategic priorities.
Economic factors

Freight and construction cycles
Logistics, construction and agriculture capex drive trailer replacement rates (typically 7–12 years), so Wielton is sensitive to fleet renewal cycles. Macro slowdowns defer purchases while rebounds create pent-up demand that spikes orders. Monitoring manufacturing PMI (50 threshold), housing starts and harvest outlooks directly informs production planning. A modular backlog smooths output against these swings.
Input cost volatility
Steel (HRC ~€600–800/t in 2024), aluminum (~$2,100–2,400/t in 2024), tires and outsourced components drive Wielton’s COGS volatility, while volatile energy and diesel prices raise both factory and client operating costs. Active hedging and multi‑year supplier contracts have trimmed margin swings. Design‑to‑cost and lightweighting programs typically cut material exposure by ~5–10% per unit.

Interest rates and financing
High rates (NBP 6.75% end-2024; ECB deposit ~4.00% and US Fed 5.25–5.50% in 2024) raise leasing costs and stretch client payback periods, slowing orders for Wielton trailers. Easing rates in 2025 can unlock deferred orders and refresh fleets. OEM-backed financing and lessor partnerships—which can cover ~20–30% of commercial vehicle deals in Europe—smooth demand, while flexible payment terms support dealer networks.

FX exposure (PLN, EUR, GBP)
Wielton earns the majority of sales in EUR and GBP while cost bases remain largely PLN/EUR, creating translation and transaction risk as EUR/PLN averaged about 4.60 and GBP/PLN about 5.30 in 2024; sterling swings have materially compressed UK margins in recent quarters.
Group management reports using natural hedges and FX derivatives to protect margins, and contractual pricing clauses allow passing selected FX moves to buyers.
- FX exposure: EUR, GBP vs PLN
- 2024 avg rates: EUR/PLN ~4.60, GBP/PLN ~5.30
- Sterling volatility: impacts UK profitability
- Mitigants: natural hedges, derivatives, pricing clauses
Capacity and supply chain resilience
- Lead times: ~14 weeks (2024)
- Regional sourcing share: +25% since 2023
- Target inventory: 60–75 days
- Forecast accuracy gain: ~20%
EU funds €1.824tn drive trailer demand; Poland benefits €76.8bn
Fleet renewal (7–12y) and capex cycles drive Wielton demand; macro slowdowns delay orders, rebounds spike backlog. Input-costs remain key: HRC €600–800/t (2024), aluminum $2,100–2,400/t (2024); NBP 6.75% / ECB deposit ~4.00% (end‑2024) raise leasing costs. FX: EUR/PLN ~4.60, GBP/PLN ~5.30; lead times ~14 weeks, target inventory 60–75 days.
| Metric | 2024/2025 |
|---|---|
| HRC € | 600–800/t |
| Aluminum $ | 2,100–2,400/t |
| ECB dep. | ~4.00% |
| EUR/PLN | ~4.60 |
| Lead time | ~14 wks |
What You See Is What You Get
Wielton PESTLE Analysis
The preview shown is the exact Wielton PESTLE Analysis document you’ll receive after purchase—fully formatted and ready to use. The layout, content, and structure visible here match the downloadable file with no placeholders or edits. After payment you’ll instantly get this same professional, ready-to-use report.

Your Competitive Advantage Starts with This Report
Unlock how political shifts, economic cycles, and environmental trends are reshaping Wielton’s market position in our concise PESTLE snapshot; it highlights risk drivers and strategic opportunities for investors and managers. This ready-to-use analysis saves hours of research and supports smarter decisions. Purchase the full PESTLE for the complete, actionable breakdown.
Political factors
EU transport and industry policy
EU transport and industry policy channels the MFF 2021–27 €1.074 trillion plus NextGenerationEU €750bn into infrastructure and cohesion projects, directly boosting demand for trailers, tippers and construction transport.
State-aid and industrial policy permit targeted subsidies and co-financing for local manufacturing and innovation, with member states routing billions into transport-related projects.
Post-election reprioritisations can reallocate regional funds; Wielton should align bids and production capacity with active EU programmes to capture tenders.
Trade relations and tariffs
Customs rules, sanctions and antidumping measures have tightened steel input costs and access to third markets, with EU anti-dumping duties on certain flat steels reaching double-digit percentages in recent years, hitting margins on trailers. Stable EU–UK trade terms remain critical for cross-Channel fleets that handle the majority of Polish-UK goods flows. Geopolitical tensions in CEE have intermittently closed corridors and pushed logistics costs up by double digits, so diversified sourcing and market mix hedge policy shocks.
Public procurement dynamics
Government-backed infrastructure and municipal projects, supported by EU cohesion funds to Poland of about 76.8 billion EUR for 2021–27, boost demand for tippers and specialized trailers. Public procurement represents roughly 14% of EU GDP, so local content preferences can sway supplier selection. Transparent tendering favors compliant, certified producers like Wielton. Public-sector partnerships help stabilize otherwise cyclical revenue.
Energy and fuel security policy
State energy strategies like the EU Fit for 55 and national fuel security plans affect transport costs for Wielton clients, shifting fleet renewal toward 8–12 year cycles; diesel retail prices averaged about €1.70/L in 2024 while EU industrial electricity averaged ~€0.16/kWh, altering TCO and payback for electric or hybrid tractors.
- Incentives push lightweight, aerodynamic trailer specs
- Policy-driven diesel/electric volatility changes TCO
- Efficiency-focused models match regulatory trends
Labor mobility and migration
EU labor mobility rules shape Wielton’s access to skilled production workers and drivers; Poland unemployment at 2.8% (2024) supports recruitment while an EU truck driver shortage of roughly 400,000 (IRU estimate) pushes up driver wages. Political shifts on migration in 2024–25 can tighten or ease labor pools, altering site economics and incentive use. HR must track policy to forecast wage costs, hiring timelines and plant staffing.
- EU mobility: impacts skilled labor supply
- Poland unemployment 2.8% (2024)
- Driver shortage ≈400,000 (IRU)
- Wage/incentive variance shifts plant footprints
EU funds €1.824tn drive trailer demand; Poland benefits €76.8bn
EU MFF 2021–27 €1.074tn plus NextGenerationEU €750bn drive infrastructure demand for trailers and tippers.
Poland cohesion funds €76.8bn (2021–27), public procurement ~14% EU GDP — local content and compliant suppliers like Wielton gain advantage.
Input costs hit by EU anti‑dumping on steels; diesel €1.70/L (2024), electricity €0.16/kWh (2024) shift TCO toward efficiency.
Poland unemployment 2.8% (2024); EU truck driver shortage ≈400,000 raises wages and affects fleet demand.
| Indicator | Value |
|---|---|
| MFF + NGEU | €1.824tn |
| Poland cohesion | €76.8bn |
| Diesel (2024) | €1.70/L |
| Electricity (EU, 2024) | €0.16/kWh |
| Unemployment PL (2024) | 2.8% |
| Driver shortage (IRU) | ≈400,000 |
What is included in the product
Detailed Word Document
Explores how macro-environmental forces uniquely impact Wielton across Political, Economic, Social, Technological, Environmental, and Legal dimensions, with data-driven examples tied to its European commercial vehicle and trailer market. Each section offers forward-looking insights and actionable implications to help executives, investors, and strategists identify risks, opportunities, and strategic responses.
Customizable Excel Spreadsheet
Concise, visually segmented Wielton PESTLE that’s drop‑in ready for presentations, easily shared and annotated to align teams quickly on external risks, market positioning and strategic priorities.
Economic factors
Freight and construction cycles
Logistics, construction and agriculture capex drive trailer replacement rates (typically 7–12 years), so Wielton is sensitive to fleet renewal cycles. Macro slowdowns defer purchases while rebounds create pent-up demand that spikes orders. Monitoring manufacturing PMI (50 threshold), housing starts and harvest outlooks directly informs production planning. A modular backlog smooths output against these swings.
Input cost volatility
Steel (HRC ~€600–800/t in 2024), aluminum (~$2,100–2,400/t in 2024), tires and outsourced components drive Wielton’s COGS volatility, while volatile energy and diesel prices raise both factory and client operating costs. Active hedging and multi‑year supplier contracts have trimmed margin swings. Design‑to‑cost and lightweighting programs typically cut material exposure by ~5–10% per unit.
Interest rates and financing
High rates (NBP 6.75% end-2024; ECB deposit ~4.00% and US Fed 5.25–5.50% in 2024) raise leasing costs and stretch client payback periods, slowing orders for Wielton trailers. Easing rates in 2025 can unlock deferred orders and refresh fleets. OEM-backed financing and lessor partnerships—which can cover ~20–30% of commercial vehicle deals in Europe—smooth demand, while flexible payment terms support dealer networks.
FX exposure (PLN, EUR, GBP)
Wielton earns the majority of sales in EUR and GBP while cost bases remain largely PLN/EUR, creating translation and transaction risk as EUR/PLN averaged about 4.60 and GBP/PLN about 5.30 in 2024; sterling swings have materially compressed UK margins in recent quarters.
Group management reports using natural hedges and FX derivatives to protect margins, and contractual pricing clauses allow passing selected FX moves to buyers.
- FX exposure: EUR, GBP vs PLN
- 2024 avg rates: EUR/PLN ~4.60, GBP/PLN ~5.30
- Sterling volatility: impacts UK profitability
- Mitigants: natural hedges, derivatives, pricing clauses
Capacity and supply chain resilience
- Lead times: ~14 weeks (2024)
- Regional sourcing share: +25% since 2023
- Target inventory: 60–75 days
- Forecast accuracy gain: ~20%
EU funds €1.824tn drive trailer demand; Poland benefits €76.8bn
Fleet renewal (7–12y) and capex cycles drive Wielton demand; macro slowdowns delay orders, rebounds spike backlog. Input-costs remain key: HRC €600–800/t (2024), aluminum $2,100–2,400/t (2024); NBP 6.75% / ECB deposit ~4.00% (end‑2024) raise leasing costs. FX: EUR/PLN ~4.60, GBP/PLN ~5.30; lead times ~14 weeks, target inventory 60–75 days.
| Metric | 2024/2025 |
|---|---|
| HRC € | 600–800/t |
| Aluminum $ | 2,100–2,400/t |
| ECB dep. | ~4.00% |
| EUR/PLN | ~4.60 |
| Lead time | ~14 wks |
What You See Is What You Get
Wielton PESTLE Analysis
The preview shown is the exact Wielton PESTLE Analysis document you’ll receive after purchase—fully formatted and ready to use. The layout, content, and structure visible here match the downloadable file with no placeholders or edits. After payment you’ll instantly get this same professional, ready-to-use report.
Original: $10.00
-65%$10.00
$3.50Description
Your Competitive Advantage Starts with This Report
Unlock how political shifts, economic cycles, and environmental trends are reshaping Wielton’s market position in our concise PESTLE snapshot; it highlights risk drivers and strategic opportunities for investors and managers. This ready-to-use analysis saves hours of research and supports smarter decisions. Purchase the full PESTLE for the complete, actionable breakdown.
Political factors
EU transport and industry policy
EU transport and industry policy channels the MFF 2021–27 €1.074 trillion plus NextGenerationEU €750bn into infrastructure and cohesion projects, directly boosting demand for trailers, tippers and construction transport.
State-aid and industrial policy permit targeted subsidies and co-financing for local manufacturing and innovation, with member states routing billions into transport-related projects.
Post-election reprioritisations can reallocate regional funds; Wielton should align bids and production capacity with active EU programmes to capture tenders.
Trade relations and tariffs
Customs rules, sanctions and antidumping measures have tightened steel input costs and access to third markets, with EU anti-dumping duties on certain flat steels reaching double-digit percentages in recent years, hitting margins on trailers. Stable EU–UK trade terms remain critical for cross-Channel fleets that handle the majority of Polish-UK goods flows. Geopolitical tensions in CEE have intermittently closed corridors and pushed logistics costs up by double digits, so diversified sourcing and market mix hedge policy shocks.
Public procurement dynamics
Government-backed infrastructure and municipal projects, supported by EU cohesion funds to Poland of about 76.8 billion EUR for 2021–27, boost demand for tippers and specialized trailers. Public procurement represents roughly 14% of EU GDP, so local content preferences can sway supplier selection. Transparent tendering favors compliant, certified producers like Wielton. Public-sector partnerships help stabilize otherwise cyclical revenue.
Energy and fuel security policy
State energy strategies like the EU Fit for 55 and national fuel security plans affect transport costs for Wielton clients, shifting fleet renewal toward 8–12 year cycles; diesel retail prices averaged about €1.70/L in 2024 while EU industrial electricity averaged ~€0.16/kWh, altering TCO and payback for electric or hybrid tractors.
- Incentives push lightweight, aerodynamic trailer specs
- Policy-driven diesel/electric volatility changes TCO
- Efficiency-focused models match regulatory trends
Labor mobility and migration
EU labor mobility rules shape Wielton’s access to skilled production workers and drivers; Poland unemployment at 2.8% (2024) supports recruitment while an EU truck driver shortage of roughly 400,000 (IRU estimate) pushes up driver wages. Political shifts on migration in 2024–25 can tighten or ease labor pools, altering site economics and incentive use. HR must track policy to forecast wage costs, hiring timelines and plant staffing.
- EU mobility: impacts skilled labor supply
- Poland unemployment 2.8% (2024)
- Driver shortage ≈400,000 (IRU)
- Wage/incentive variance shifts plant footprints
EU funds €1.824tn drive trailer demand; Poland benefits €76.8bn
EU MFF 2021–27 €1.074tn plus NextGenerationEU €750bn drive infrastructure demand for trailers and tippers.
Poland cohesion funds €76.8bn (2021–27), public procurement ~14% EU GDP — local content and compliant suppliers like Wielton gain advantage.
Input costs hit by EU anti‑dumping on steels; diesel €1.70/L (2024), electricity €0.16/kWh (2024) shift TCO toward efficiency.
Poland unemployment 2.8% (2024); EU truck driver shortage ≈400,000 raises wages and affects fleet demand.
| Indicator | Value |
|---|---|
| MFF + NGEU | €1.824tn |
| Poland cohesion | €76.8bn |
| Diesel (2024) | €1.70/L |
| Electricity (EU, 2024) | €0.16/kWh |
| Unemployment PL (2024) | 2.8% |
| Driver shortage (IRU) | ≈400,000 |
What is included in the product
Detailed Word Document
Explores how macro-environmental forces uniquely impact Wielton across Political, Economic, Social, Technological, Environmental, and Legal dimensions, with data-driven examples tied to its European commercial vehicle and trailer market. Each section offers forward-looking insights and actionable implications to help executives, investors, and strategists identify risks, opportunities, and strategic responses.
Customizable Excel Spreadsheet
Concise, visually segmented Wielton PESTLE that’s drop‑in ready for presentations, easily shared and annotated to align teams quickly on external risks, market positioning and strategic priorities.
Economic factors
Freight and construction cycles
Logistics, construction and agriculture capex drive trailer replacement rates (typically 7–12 years), so Wielton is sensitive to fleet renewal cycles. Macro slowdowns defer purchases while rebounds create pent-up demand that spikes orders. Monitoring manufacturing PMI (50 threshold), housing starts and harvest outlooks directly informs production planning. A modular backlog smooths output against these swings.
Input cost volatility
Steel (HRC ~€600–800/t in 2024), aluminum (~$2,100–2,400/t in 2024), tires and outsourced components drive Wielton’s COGS volatility, while volatile energy and diesel prices raise both factory and client operating costs. Active hedging and multi‑year supplier contracts have trimmed margin swings. Design‑to‑cost and lightweighting programs typically cut material exposure by ~5–10% per unit.
Interest rates and financing
High rates (NBP 6.75% end-2024; ECB deposit ~4.00% and US Fed 5.25–5.50% in 2024) raise leasing costs and stretch client payback periods, slowing orders for Wielton trailers. Easing rates in 2025 can unlock deferred orders and refresh fleets. OEM-backed financing and lessor partnerships—which can cover ~20–30% of commercial vehicle deals in Europe—smooth demand, while flexible payment terms support dealer networks.
FX exposure (PLN, EUR, GBP)
Wielton earns the majority of sales in EUR and GBP while cost bases remain largely PLN/EUR, creating translation and transaction risk as EUR/PLN averaged about 4.60 and GBP/PLN about 5.30 in 2024; sterling swings have materially compressed UK margins in recent quarters.
Group management reports using natural hedges and FX derivatives to protect margins, and contractual pricing clauses allow passing selected FX moves to buyers.
- FX exposure: EUR, GBP vs PLN
- 2024 avg rates: EUR/PLN ~4.60, GBP/PLN ~5.30
- Sterling volatility: impacts UK profitability
- Mitigants: natural hedges, derivatives, pricing clauses
Capacity and supply chain resilience
- Lead times: ~14 weeks (2024)
- Regional sourcing share: +25% since 2023
- Target inventory: 60–75 days
- Forecast accuracy gain: ~20%
EU funds €1.824tn drive trailer demand; Poland benefits €76.8bn
Fleet renewal (7–12y) and capex cycles drive Wielton demand; macro slowdowns delay orders, rebounds spike backlog. Input-costs remain key: HRC €600–800/t (2024), aluminum $2,100–2,400/t (2024); NBP 6.75% / ECB deposit ~4.00% (end‑2024) raise leasing costs. FX: EUR/PLN ~4.60, GBP/PLN ~5.30; lead times ~14 weeks, target inventory 60–75 days.
| Metric | 2024/2025 |
|---|---|
| HRC € | 600–800/t |
| Aluminum $ | 2,100–2,400/t |
| ECB dep. | ~4.00% |
| EUR/PLN | ~4.60 |
| Lead time | ~14 wks |
What You See Is What You Get
Wielton PESTLE Analysis
The preview shown is the exact Wielton PESTLE Analysis document you’ll receive after purchase—fully formatted and ready to use. The layout, content, and structure visible here match the downloadable file with no placeholders or edits. After payment you’ll instantly get this same professional, ready-to-use report.











