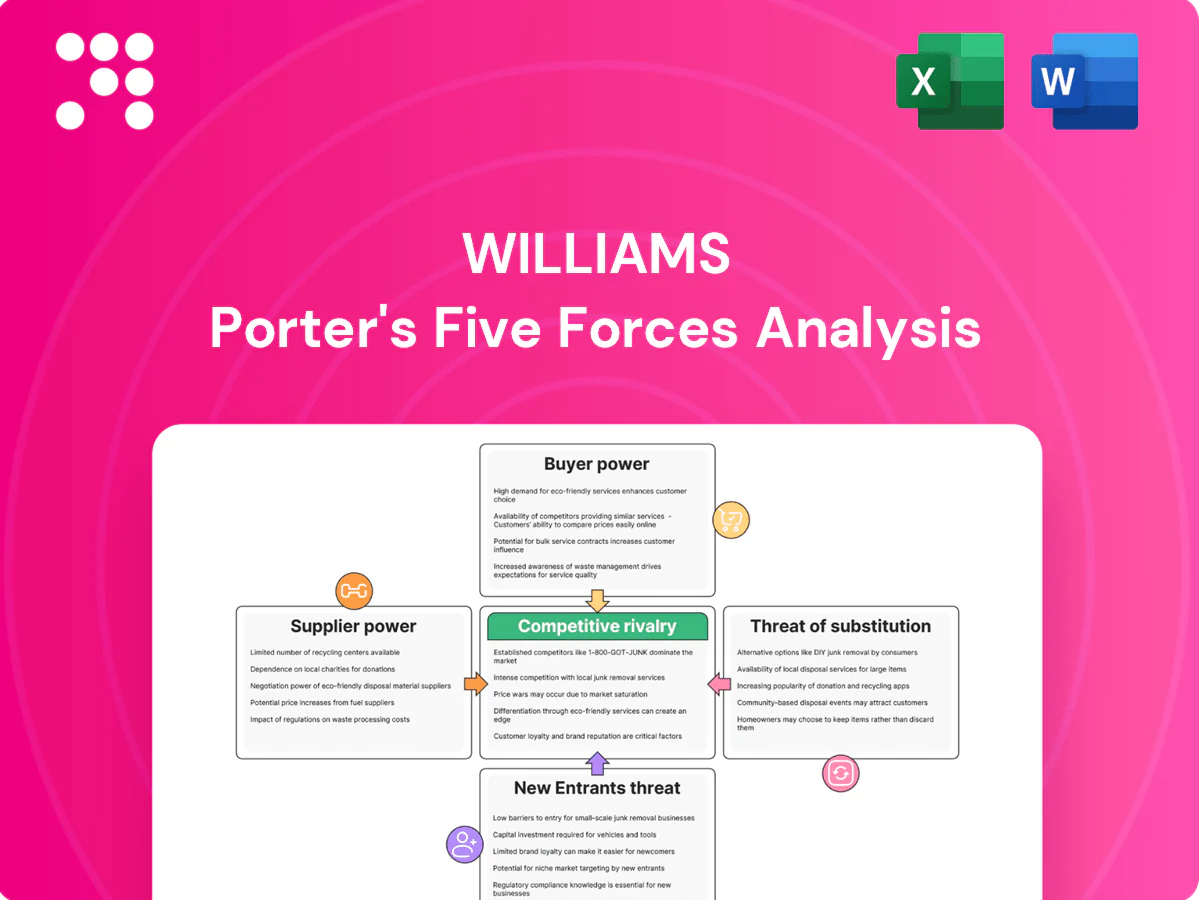
Williams Porter's Five Forces Analysis

From Overview to Strategy Blueprint
Williams faces shifting supplier leverage, moderate buyer power, and evolving substitute and entrant threats that shape its strategic choices; this snapshot highlights key pressure points and competitive intensity. Unlock the full Porter's Five Forces Analysis for force-by-force ratings, visuals, and actionable insights to guide investment or strategy.
Suppliers Bargaining Power

Upstream producer concentration
Williams sources volumes from numerous E&P producers across major basins—Appalachia, Gulf Coast, Permian and Anadarko in 2024—limiting single-supplier dependency. In core plays where a few dominant operators control acreage, producers can negotiate firmer terms or favorable connection agreements. Take-or-pay and acreage-dedication contracts used by Williams mitigate this supplier leverage, while basin diversification dampens localized swings.
Commodity price cyclicality
Commodity cyclicality drives supplier leverage: low 2024 Henry Hub prices near $2.80/MMBtu reduced producer drilling and risked throughput declines, raising supplier influence on capacity utilization, while price spikes in 2024 boosted volumes and eased supplier bargaining as midstream capacity tightened. Williams’ predominantly fee-based contracts preserve margins but not volumes; hedging and long-term take-or-pay arrangements partially dampen volatility.

Switching and interconnect options
Producers with alternative midstream connections can credibly reroute volumes, and Permian crude takeaway capacity surpassed 5 million b/d by 2024, increasing supplier leverage where alternatives exist. In constrained basins (e.g., parts of Bakken), limited takeaway pushed differentials above $10/bbl in 2024, reducing switching and supplier power. Interconnects and hub access to major transmission lines materially shape negotiations, while strategic gathering footprints near wellheads increase stickiness and lock-in economics.

Service bundling dependencies
Integrated gathering, processing and NGL services create operational dependencies that limit producer leverage by consolidating scheduling and reducing interface risk; US NGL production was about 4.2 million b/d in 2024 (EIA), underscoring scale advantages for integrated midstream players.
Service bundles raise Williams’ value proposition through simplified logistics and stronger uptime, but large producers can unbundle if alternative processors deliver superior netbacks; contract design and SLAs are therefore critical to retain volumes.
- Operational dependency: bundled services reduce producer bargaining power
- Scale: ~4.2 million b/d US NGL supply in 2024 (EIA)
- Risk: unbundling if netbacks improve elsewhere
- Mitigation: robust contracts and performance SLAs
Regulatory and ESG pressures on supply
Regulatory methane rules, tighter flaring limits and permitting delays can constrain producer output and elevate suppliers' influence on flow patterns; methane is ~84 times CO2 over 20 years and roughly 140 billion cubic meters were flared globally in recent years. Producers with strong ESG can secure preferred terms or capacity; Williams’ emissions-management services can align incentives and reduce friction, while rapid policy shifts can quickly rebalance bargaining dynamics.
- Methane potency: ~84x CO2 (20yr)
- Global flaring: ~140 bcm/yr
- ESG premium: preferred capacity/terms
- Williams: emissions-alignment reduces friction
$2.80/MMBtu dents midstream leverage amid Permian takeaway surplus
Williams faces moderate supplier power: diversified basin sourcing limits single-supplier risk, but concentrated operators in core plays can demand firmer terms. 2024 stressors — Henry Hub ~$2.80/MMBtu, US NGL ~4.2m b/d, Permian takeaway >5m b/d — shifted leverage regionally. Take-or-pay contracts, bundled services and emissions offerings (methane ~84x CO2; flaring ~140 bcm/yr) mitigate producer pressure.
| Metric | 2024 value | Implication |
|---|---|---|
| Henry Hub | $2.80/MMBtu | reduced drilling, higher supplier influence |
| US NGL supply | 4.2m b/d | scale advantage for Williams |
| Permian takeaway | >5m b/d | increased routing options |
What is included in the product
 Detailed Word Document
Uncovers competitive drivers—supplier and buyer power, threat of substitutes, new entrants, and rivalry—tailored to Williams to reveal disruptive threats, pricing pressures, and strategic levers to defend or grow market share; provided in editable Word format for investor decks, business plans, or academic projects.

 Customizable Excel Spreadsheet
A concise one-sheet Williams Porter’s Five Forces summary that turns complex competitive pressure into actionable insights for swift decision-making; customize force intensities, swap in your own data, and visualize strategic pressure instantly with a spider/radar chart ready for decks or dashboards.
Customers Bargaining Power

Utility and LDC concentration
Major utilities and LDCs aggregate demand and negotiating sophistication—top 10 U.S. utilities serve roughly 60% of customers—so they secure long‑tenor, capacity‑focused contracts with pricing influence. With U.S. gas demand near 31 Tcf in 2024, their scale and credit quality enable firm capacity deals. Reliability needs keep firm transport indispensable, though winter/summer seasonal peaks give buyers timing leverage.
Access to alternative routes
Where multiple pipelines serve a market, buyers can arbitrage capacity and basis differentials, reducing negotiating leverage. In constrained corridors Williams’ Transco system (≈10.6 Bcf/d capacity) can exert localized pricing power during peak demand. Inter-basin competition and liquid hubs like Henry Hub moderate buyer clout by offering alternative outlets. New expansion projects can materially reset route economics and basis spreads.

Contract structure and term
Contract structure and term weaken customer bargaining power because take-or-pay, firm transport and reservation charges lock in revenues once contracts commence, reducing buyers ability to renegotiate capacity economics.
Renewal windows and step-down options periodically restore leverage, allowing buyers to seek lower rates or alternative capacity at contract resets.
Indexed fuel and tariff mechanisms shift commodity and inflation risk back toward customers, while highly creditworthy shippers can negotiate favorable escalators and limited exposure.

Quality and reliability requirements
Buyers prioritize uptime, pressure, and gas quality, rewarding operators with consistent deliveries and penalizing failures; in 2024 US working gas storage capacity was about 4,000 Bcf, making integrated storage a key reliability asset. High service reliability raises switching costs and lowers effective buyer power, while penalties for non-performance create contractual balance and trust.
- Uptime focus: reduces buyer leverage
- Penalties: align incentives
- Storage integration: strengthens Williams’ position
Energy transition preferences
Scale and credit of top utilities plus Transco capacity drive localized gas pricing power
Major utilities (top 10 ≈60% of U.S. customers) and large LDCs wield scale and credit to secure long‑tenor firm contracts; U.S. gas demand ~31 Tcf (2024) and Transco capacity ≈10.6 Bcf/d create localized pricing power. Take‑or‑pay and reservation charges limit renegotiation, while 4,000 Bcf storage and 60% corporate demand for low‑carbon gas (2024) raise switching costs.
| Metric | 2024 Value |
|---|---|
| Top 10 utility customer share | ≈60% |
| U.S. gas demand | ≈31 Tcf |
| Transco capacity | ≈10.6 Bcf/d |
| Working gas storage | ≈4,000 Bcf |
| Corporate low‑carbon preference | ≈60% |
What You See Is What You Get
Williams Porter's Five Forces Analysis
This preview shows the exact Williams Porter’s Five Forces Analysis you’ll receive immediately after purchase—no placeholders or sample pages. It is the full, professionally formatted document ready for download and use the moment you buy. Expect a complete, actionable competitive assessment you can apply right away.

From Overview to Strategy Blueprint
Williams faces shifting supplier leverage, moderate buyer power, and evolving substitute and entrant threats that shape its strategic choices; this snapshot highlights key pressure points and competitive intensity. Unlock the full Porter's Five Forces Analysis for force-by-force ratings, visuals, and actionable insights to guide investment or strategy.
Suppliers Bargaining Power
Upstream producer concentration
Williams sources volumes from numerous E&P producers across major basins—Appalachia, Gulf Coast, Permian and Anadarko in 2024—limiting single-supplier dependency. In core plays where a few dominant operators control acreage, producers can negotiate firmer terms or favorable connection agreements. Take-or-pay and acreage-dedication contracts used by Williams mitigate this supplier leverage, while basin diversification dampens localized swings.
Commodity price cyclicality
Commodity cyclicality drives supplier leverage: low 2024 Henry Hub prices near $2.80/MMBtu reduced producer drilling and risked throughput declines, raising supplier influence on capacity utilization, while price spikes in 2024 boosted volumes and eased supplier bargaining as midstream capacity tightened. Williams’ predominantly fee-based contracts preserve margins but not volumes; hedging and long-term take-or-pay arrangements partially dampen volatility.
Switching and interconnect options
Producers with alternative midstream connections can credibly reroute volumes, and Permian crude takeaway capacity surpassed 5 million b/d by 2024, increasing supplier leverage where alternatives exist. In constrained basins (e.g., parts of Bakken), limited takeaway pushed differentials above $10/bbl in 2024, reducing switching and supplier power. Interconnects and hub access to major transmission lines materially shape negotiations, while strategic gathering footprints near wellheads increase stickiness and lock-in economics.
Service bundling dependencies
Integrated gathering, processing and NGL services create operational dependencies that limit producer leverage by consolidating scheduling and reducing interface risk; US NGL production was about 4.2 million b/d in 2024 (EIA), underscoring scale advantages for integrated midstream players.
Service bundles raise Williams’ value proposition through simplified logistics and stronger uptime, but large producers can unbundle if alternative processors deliver superior netbacks; contract design and SLAs are therefore critical to retain volumes.
- Operational dependency: bundled services reduce producer bargaining power
- Scale: ~4.2 million b/d US NGL supply in 2024 (EIA)
- Risk: unbundling if netbacks improve elsewhere
- Mitigation: robust contracts and performance SLAs
Regulatory and ESG pressures on supply
Regulatory methane rules, tighter flaring limits and permitting delays can constrain producer output and elevate suppliers' influence on flow patterns; methane is ~84 times CO2 over 20 years and roughly 140 billion cubic meters were flared globally in recent years. Producers with strong ESG can secure preferred terms or capacity; Williams’ emissions-management services can align incentives and reduce friction, while rapid policy shifts can quickly rebalance bargaining dynamics.
- Methane potency: ~84x CO2 (20yr)
- Global flaring: ~140 bcm/yr
- ESG premium: preferred capacity/terms
- Williams: emissions-alignment reduces friction
$2.80/MMBtu dents midstream leverage amid Permian takeaway surplus
Williams faces moderate supplier power: diversified basin sourcing limits single-supplier risk, but concentrated operators in core plays can demand firmer terms. 2024 stressors — Henry Hub ~$2.80/MMBtu, US NGL ~4.2m b/d, Permian takeaway >5m b/d — shifted leverage regionally. Take-or-pay contracts, bundled services and emissions offerings (methane ~84x CO2; flaring ~140 bcm/yr) mitigate producer pressure.
| Metric | 2024 value | Implication |
|---|---|---|
| Henry Hub | $2.80/MMBtu | reduced drilling, higher supplier influence |
| US NGL supply | 4.2m b/d | scale advantage for Williams |
| Permian takeaway | >5m b/d | increased routing options |
What is included in the product
Detailed Word Document
Uncovers competitive drivers—supplier and buyer power, threat of substitutes, new entrants, and rivalry—tailored to Williams to reveal disruptive threats, pricing pressures, and strategic levers to defend or grow market share; provided in editable Word format for investor decks, business plans, or academic projects.
Customizable Excel Spreadsheet
A concise one-sheet Williams Porter’s Five Forces summary that turns complex competitive pressure into actionable insights for swift decision-making; customize force intensities, swap in your own data, and visualize strategic pressure instantly with a spider/radar chart ready for decks or dashboards.
Customers Bargaining Power
Utility and LDC concentration
Major utilities and LDCs aggregate demand and negotiating sophistication—top 10 U.S. utilities serve roughly 60% of customers—so they secure long‑tenor, capacity‑focused contracts with pricing influence. With U.S. gas demand near 31 Tcf in 2024, their scale and credit quality enable firm capacity deals. Reliability needs keep firm transport indispensable, though winter/summer seasonal peaks give buyers timing leverage.
Access to alternative routes
Where multiple pipelines serve a market, buyers can arbitrage capacity and basis differentials, reducing negotiating leverage. In constrained corridors Williams’ Transco system (≈10.6 Bcf/d capacity) can exert localized pricing power during peak demand. Inter-basin competition and liquid hubs like Henry Hub moderate buyer clout by offering alternative outlets. New expansion projects can materially reset route economics and basis spreads.
Contract structure and term
Contract structure and term weaken customer bargaining power because take-or-pay, firm transport and reservation charges lock in revenues once contracts commence, reducing buyers ability to renegotiate capacity economics.
Renewal windows and step-down options periodically restore leverage, allowing buyers to seek lower rates or alternative capacity at contract resets.
Indexed fuel and tariff mechanisms shift commodity and inflation risk back toward customers, while highly creditworthy shippers can negotiate favorable escalators and limited exposure.
Quality and reliability requirements
Buyers prioritize uptime, pressure, and gas quality, rewarding operators with consistent deliveries and penalizing failures; in 2024 US working gas storage capacity was about 4,000 Bcf, making integrated storage a key reliability asset. High service reliability raises switching costs and lowers effective buyer power, while penalties for non-performance create contractual balance and trust.
- Uptime focus: reduces buyer leverage
- Penalties: align incentives
- Storage integration: strengthens Williams’ position
Energy transition preferences
Scale and credit of top utilities plus Transco capacity drive localized gas pricing power
Major utilities (top 10 ≈60% of U.S. customers) and large LDCs wield scale and credit to secure long‑tenor firm contracts; U.S. gas demand ~31 Tcf (2024) and Transco capacity ≈10.6 Bcf/d create localized pricing power. Take‑or‑pay and reservation charges limit renegotiation, while 4,000 Bcf storage and 60% corporate demand for low‑carbon gas (2024) raise switching costs.
| Metric | 2024 Value |
|---|---|
| Top 10 utility customer share | ≈60% |
| U.S. gas demand | ≈31 Tcf |
| Transco capacity | ≈10.6 Bcf/d |
| Working gas storage | ≈4,000 Bcf |
| Corporate low‑carbon preference | ≈60% |
What You See Is What You Get
Williams Porter's Five Forces Analysis
This preview shows the exact Williams Porter’s Five Forces Analysis you’ll receive immediately after purchase—no placeholders or sample pages. It is the full, professionally formatted document ready for download and use the moment you buy. Expect a complete, actionable competitive assessment you can apply right away.
Description
From Overview to Strategy Blueprint
Williams faces shifting supplier leverage, moderate buyer power, and evolving substitute and entrant threats that shape its strategic choices; this snapshot highlights key pressure points and competitive intensity. Unlock the full Porter's Five Forces Analysis for force-by-force ratings, visuals, and actionable insights to guide investment or strategy.
Suppliers Bargaining Power
Upstream producer concentration
Williams sources volumes from numerous E&P producers across major basins—Appalachia, Gulf Coast, Permian and Anadarko in 2024—limiting single-supplier dependency. In core plays where a few dominant operators control acreage, producers can negotiate firmer terms or favorable connection agreements. Take-or-pay and acreage-dedication contracts used by Williams mitigate this supplier leverage, while basin diversification dampens localized swings.
Commodity price cyclicality
Commodity cyclicality drives supplier leverage: low 2024 Henry Hub prices near $2.80/MMBtu reduced producer drilling and risked throughput declines, raising supplier influence on capacity utilization, while price spikes in 2024 boosted volumes and eased supplier bargaining as midstream capacity tightened. Williams’ predominantly fee-based contracts preserve margins but not volumes; hedging and long-term take-or-pay arrangements partially dampen volatility.
Switching and interconnect options
Producers with alternative midstream connections can credibly reroute volumes, and Permian crude takeaway capacity surpassed 5 million b/d by 2024, increasing supplier leverage where alternatives exist. In constrained basins (e.g., parts of Bakken), limited takeaway pushed differentials above $10/bbl in 2024, reducing switching and supplier power. Interconnects and hub access to major transmission lines materially shape negotiations, while strategic gathering footprints near wellheads increase stickiness and lock-in economics.
Service bundling dependencies
Integrated gathering, processing and NGL services create operational dependencies that limit producer leverage by consolidating scheduling and reducing interface risk; US NGL production was about 4.2 million b/d in 2024 (EIA), underscoring scale advantages for integrated midstream players.
Service bundles raise Williams’ value proposition through simplified logistics and stronger uptime, but large producers can unbundle if alternative processors deliver superior netbacks; contract design and SLAs are therefore critical to retain volumes.
- Operational dependency: bundled services reduce producer bargaining power
- Scale: ~4.2 million b/d US NGL supply in 2024 (EIA)
- Risk: unbundling if netbacks improve elsewhere
- Mitigation: robust contracts and performance SLAs
Regulatory and ESG pressures on supply
Regulatory methane rules, tighter flaring limits and permitting delays can constrain producer output and elevate suppliers' influence on flow patterns; methane is ~84 times CO2 over 20 years and roughly 140 billion cubic meters were flared globally in recent years. Producers with strong ESG can secure preferred terms or capacity; Williams’ emissions-management services can align incentives and reduce friction, while rapid policy shifts can quickly rebalance bargaining dynamics.
- Methane potency: ~84x CO2 (20yr)
- Global flaring: ~140 bcm/yr
- ESG premium: preferred capacity/terms
- Williams: emissions-alignment reduces friction
$2.80/MMBtu dents midstream leverage amid Permian takeaway surplus
Williams faces moderate supplier power: diversified basin sourcing limits single-supplier risk, but concentrated operators in core plays can demand firmer terms. 2024 stressors — Henry Hub ~$2.80/MMBtu, US NGL ~4.2m b/d, Permian takeaway >5m b/d — shifted leverage regionally. Take-or-pay contracts, bundled services and emissions offerings (methane ~84x CO2; flaring ~140 bcm/yr) mitigate producer pressure.
| Metric | 2024 value | Implication |
|---|---|---|
| Henry Hub | $2.80/MMBtu | reduced drilling, higher supplier influence |
| US NGL supply | 4.2m b/d | scale advantage for Williams |
| Permian takeaway | >5m b/d | increased routing options |
What is included in the product
Detailed Word Document
Uncovers competitive drivers—supplier and buyer power, threat of substitutes, new entrants, and rivalry—tailored to Williams to reveal disruptive threats, pricing pressures, and strategic levers to defend or grow market share; provided in editable Word format for investor decks, business plans, or academic projects.
Customizable Excel Spreadsheet
A concise one-sheet Williams Porter’s Five Forces summary that turns complex competitive pressure into actionable insights for swift decision-making; customize force intensities, swap in your own data, and visualize strategic pressure instantly with a spider/radar chart ready for decks or dashboards.
Customers Bargaining Power
Utility and LDC concentration
Major utilities and LDCs aggregate demand and negotiating sophistication—top 10 U.S. utilities serve roughly 60% of customers—so they secure long‑tenor, capacity‑focused contracts with pricing influence. With U.S. gas demand near 31 Tcf in 2024, their scale and credit quality enable firm capacity deals. Reliability needs keep firm transport indispensable, though winter/summer seasonal peaks give buyers timing leverage.
Access to alternative routes
Where multiple pipelines serve a market, buyers can arbitrage capacity and basis differentials, reducing negotiating leverage. In constrained corridors Williams’ Transco system (≈10.6 Bcf/d capacity) can exert localized pricing power during peak demand. Inter-basin competition and liquid hubs like Henry Hub moderate buyer clout by offering alternative outlets. New expansion projects can materially reset route economics and basis spreads.
Contract structure and term
Contract structure and term weaken customer bargaining power because take-or-pay, firm transport and reservation charges lock in revenues once contracts commence, reducing buyers ability to renegotiate capacity economics.
Renewal windows and step-down options periodically restore leverage, allowing buyers to seek lower rates or alternative capacity at contract resets.
Indexed fuel and tariff mechanisms shift commodity and inflation risk back toward customers, while highly creditworthy shippers can negotiate favorable escalators and limited exposure.
Quality and reliability requirements
Buyers prioritize uptime, pressure, and gas quality, rewarding operators with consistent deliveries and penalizing failures; in 2024 US working gas storage capacity was about 4,000 Bcf, making integrated storage a key reliability asset. High service reliability raises switching costs and lowers effective buyer power, while penalties for non-performance create contractual balance and trust.
- Uptime focus: reduces buyer leverage
- Penalties: align incentives
- Storage integration: strengthens Williams’ position
Energy transition preferences
Scale and credit of top utilities plus Transco capacity drive localized gas pricing power
Major utilities (top 10 ≈60% of U.S. customers) and large LDCs wield scale and credit to secure long‑tenor firm contracts; U.S. gas demand ~31 Tcf (2024) and Transco capacity ≈10.6 Bcf/d create localized pricing power. Take‑or‑pay and reservation charges limit renegotiation, while 4,000 Bcf storage and 60% corporate demand for low‑carbon gas (2024) raise switching costs.
| Metric | 2024 Value |
|---|---|
| Top 10 utility customer share | ≈60% |
| U.S. gas demand | ≈31 Tcf |
| Transco capacity | ≈10.6 Bcf/d |
| Working gas storage | ≈4,000 Bcf |
| Corporate low‑carbon preference | ≈60% |
What You See Is What You Get
Williams Porter's Five Forces Analysis
This preview shows the exact Williams Porter’s Five Forces Analysis you’ll receive immediately after purchase—no placeholders or sample pages. It is the full, professionally formatted document ready for download and use the moment you buy. Expect a complete, actionable competitive assessment you can apply right away.











