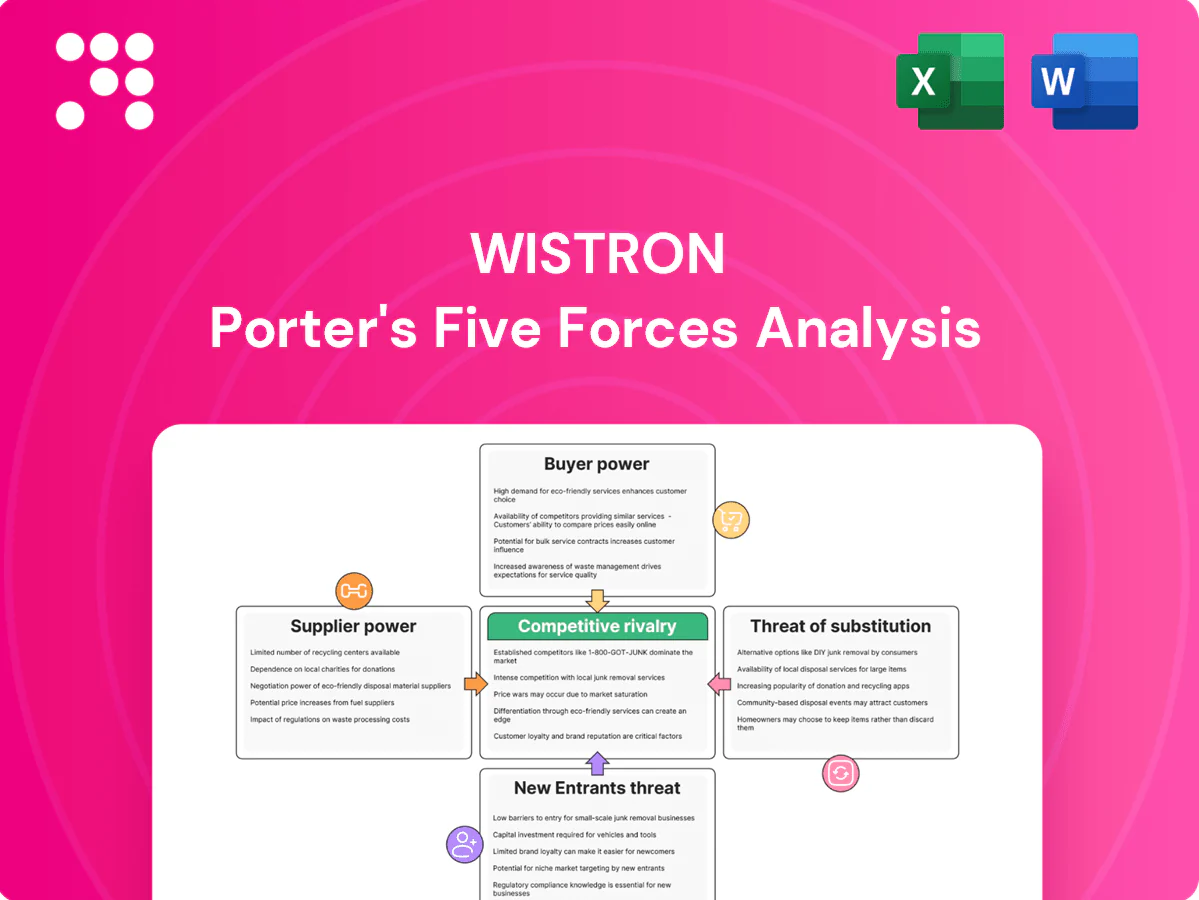
Wistron Porter's Five Forces Analysis

From Overview to Strategy Blueprint
Wistron faces mixed competitive pressures: strong buyer negotiation on volume contracts, concentrated suppliers for critical components, and moderate threat from substitutes driven by device commoditization. Scale and long-term OEM relationships give Wistron defensive advantages, but margin sensitivity and tech shifts raise strategic risk. This brief snapshot only scratches the surface. Unlock the full Porter's Five Forces Analysis to explore Wistron’s competitive dynamics, market pressures, and strategic advantages in detail.
Suppliers Bargaining Power

Concentrated key component sources
Advanced components (CPUs/GPUs/memory/panels) are concentrated among a few firms—TSMC held ~54% foundry revenue share in 2024, DRAM leaders Samsung/SK Hynix/Micron accounted for ~43%/31%/26%, and NVIDIA dominates ~80% of discrete GPUs—giving suppliers strong leverage. Shortages or allocations can spike prices and extend lead times; Wistron uses multi-sourcing where possible, long-term contracts and demand forecasting to stabilize supply but remains exposed to supplier concentration.
Commodity and materials volatility
Copper, lithium, rare earths and petrochemical derivatives drive BOM swings; lithium prices fell over 70% from 2022 peaks by 2024 while metal cycles kept copper and rare‑earths volatile, amplifying supplier leverage. Price escalation clauses and hedging blunt but do not eliminate pass‑through risk. Design‑to‑cost and requalification can offset input cost rises but add time and validation overhead. Margin pressure mounts when customers resist pass‑through pricing.

Process IP and tooling lock-in
Custom tooling, test fixtures and proprietary process know-how create switching frictions that favor incumbent suppliers, with ICT requalification cycles typically taking 3–12 months and materially raising time-to-change. Wistron leverages DFM/DFX standards to keep alternative vendors technically viable and limit lock-in. Despite this, in critical nodes and optics the supplier base is highly concentrated and true alternates can be scarce, preserving supplier leverage.

Geopolitical and logistics concentration
Supplier clusters in China/Taiwan and Asian hubs concentrate Wistron’s supply chain, raising exposure to trade, tariff, and disruption risks; freight capacity shortages, port congestion, and export controls (notably since 2022–24) can amplify supplier leverage.
Geographic diversification to Vietnam, Mexico, and India has reduced but not eliminated concentration; dual-sourcing across regions remains a stated strategic priority to lower single‑point risks.
- Concentration: regional supplier clusters raise disruption risk
- Logistics: port congestion and freight tightness increase supplier leverage
- Diversification: Vietnam/Mexico/India reduce but don’t remove concentration
- Mitigation: dual‑sourcing prioritized
ESG and compliance constraints
ESG constraints in 2024 — responsible minerals, mandatory labor audits and firm carbon targets — shrink Wistron’s eligible supplier pool, raising reliance on approved, audited vendors and elevating supplier bargaining power.
Wistron’s recycling and circular services reduce downstream impact, but upstream compliance still dictates sourcing; non-compliant suppliers are routinely disqualified, tightening options and increasing costs.
- Responsible minerals: audited supply chains required in 2024
- Labor audits: approved vendor lists raise dependency on compliant suppliers
- Carbon targets: scope 3 emphasis shifts sourcing decisions upstream
- Non-compliance: disqualification reduces supplier alternatives
2024 supplier concentration and export controls drive multi-sourcing and regional diversification
Advanced component concentration gives suppliers strong leverage: TSMC ~54% foundry share 2024, NVIDIA ~80% discrete GPU share, DRAM leaders Samsung/SK Hynix/Micron ~43%/31%/26%. ESG audits and export controls in 2024 narrowed eligible vendors; Wistron uses multi‑sourcing, long‑term contracts and regional diversification to Vietnam/Mexico/India to mitigate risk.
| Factor | 2024 metric |
|---|---|
| Foundry | TSMC ~54% |
| Discrete GPU | NVIDIA ~80% |
| DRAM leaders | Samsung/SK Hynix/Micron ~43%/31%/26% |
What is included in the product
 Detailed Word Document
Concise Porter's Five Forces analysis of Wistron highlighting competitive rivalry, supplier and buyer power, threats from new entrants and substitutes, and disruptive technologies—identifying strategic risks and opportunities to inform investor decks, internal strategy, or academic reports.

 Customizable Excel Spreadsheet
A one-sheet Wistron Porter’s Five Forces summary that instantly highlights strategic pressures and relieves decision-making pain—customizable scores, ready-to-use radar chart, and clean layout for decks or dashboards.
Customers Bargaining Power

Large OEMs with scale and options
Large OEMs—top five PC vendors holding roughly 75% of global shipments in 2024 (IDC)—run high-volume, competitive bids across EMS/ODM peers, forcing aggressive pricing and extended payment terms. Rigorous vendor scorecards prioritize cost, quality, and on-time delivery, increasing margin pressure. High customer concentration amplifies this bargaining power over Wistron.
Design co-development lock-in
Design co-development lock-in via joint engineering, NPI and custom fixtures raises switching costs and tempers pure price bargaining, and as of 2024 many OEMs still dual-source key programs to mitigate risk. Wistron leverages early engagement to embed value beyond unit cost through design ownership and tooling. Post-launch sustaining and after-sales services deepen ties and reduce churn.

Demand cyclicality and forecasting
Demand cyclicality in PC, server and enterprise capex forces lead buyers to push Wistron for flexible capacity and short lead times; in downturns buyers extract price concessions while upcycles shift negotiations toward allocation priority. VMI, consignment and forecast accuracy are used as bargaining levers to manage inventory risk. Wistron’s global footprint helps buffer regional variability and smooths capacity reallocation.

Stringent quality and ESG requirements
Buyers impose tight DPPM (<50 for tier-1 OEMs), reliability, security (ISO/IEC 27001) and sustainability metrics; missing targets risks penalties and rebids, boosting buyer leverage. Wistron invests in certifications, traceability and RBA-aligned processes to meet thresholds. Superior compliance can modestly offset pricing pressure, protecting margins.
- Buyers: DPPM <50, ISO/IEC 27001
- Risk: penalties, rebids
- Wistron: certifications, traceability, RBA alignment
- Benefit: modest price resilience
Total cost and lifecycle expectations
Customers benchmark not only BOM and conversion costs but yield, scrap, RMA and warranty; typical RMA benchmarks in contract manufacturing run 1–3% and scrap can add 5–10% to per-unit cost (2024 industry data). After-sales repair and recycling can add 10–25% to TCO and sway awards. Wistron’s end-to-end services allow competing on lifecycle value, though buyers often monetize gains into tougher commercial terms.
- RMA benchmark: 1–3% (2024)
- Scrap/TCO impact: +5–25% (2024)
- Buyers convert lifecycle gains into stricter commercial terms
Top5 OEMs ≈75%; DPPM <50, RMA 1–3%
Large OEM concentration (top5≈75% global PC shipments, IDC 2024) gives buyers strong price and terms leverage; scorecards and DPPM <50 drive penalties. Wistron offsets via co‑development, tooling lock‑in, ISO/IEC 27001 and RBA compliance and global footprint for capacity flexibility. RMA 1–3%; scrap +5–10%; lifecycle value +10–25% TCO.
| Metric | 2024 |
|---|---|
| Top5 share | ≈75% |
| DPPM target | <50 |
| RMA | 1–3% |
| Scrap/TCO | +5–25% |
Full Version Awaits
Wistron Porter's Five Forces Analysis
This preview displays the full Wistron Porter's Five Forces Analysis — the exact document you'll receive after purchase, with no placeholders or samples. It is professionally formatted, comprehensive, and ready for immediate download and use the moment you buy. What you see here is the final deliverable, complete and identical to the file provided upon payment.

From Overview to Strategy Blueprint
Wistron faces mixed competitive pressures: strong buyer negotiation on volume contracts, concentrated suppliers for critical components, and moderate threat from substitutes driven by device commoditization. Scale and long-term OEM relationships give Wistron defensive advantages, but margin sensitivity and tech shifts raise strategic risk. This brief snapshot only scratches the surface. Unlock the full Porter's Five Forces Analysis to explore Wistron’s competitive dynamics, market pressures, and strategic advantages in detail.
Suppliers Bargaining Power
Concentrated key component sources
Advanced components (CPUs/GPUs/memory/panels) are concentrated among a few firms—TSMC held ~54% foundry revenue share in 2024, DRAM leaders Samsung/SK Hynix/Micron accounted for ~43%/31%/26%, and NVIDIA dominates ~80% of discrete GPUs—giving suppliers strong leverage. Shortages or allocations can spike prices and extend lead times; Wistron uses multi-sourcing where possible, long-term contracts and demand forecasting to stabilize supply but remains exposed to supplier concentration.
Commodity and materials volatility
Copper, lithium, rare earths and petrochemical derivatives drive BOM swings; lithium prices fell over 70% from 2022 peaks by 2024 while metal cycles kept copper and rare‑earths volatile, amplifying supplier leverage. Price escalation clauses and hedging blunt but do not eliminate pass‑through risk. Design‑to‑cost and requalification can offset input cost rises but add time and validation overhead. Margin pressure mounts when customers resist pass‑through pricing.
Process IP and tooling lock-in
Custom tooling, test fixtures and proprietary process know-how create switching frictions that favor incumbent suppliers, with ICT requalification cycles typically taking 3–12 months and materially raising time-to-change. Wistron leverages DFM/DFX standards to keep alternative vendors technically viable and limit lock-in. Despite this, in critical nodes and optics the supplier base is highly concentrated and true alternates can be scarce, preserving supplier leverage.
Geopolitical and logistics concentration
Supplier clusters in China/Taiwan and Asian hubs concentrate Wistron’s supply chain, raising exposure to trade, tariff, and disruption risks; freight capacity shortages, port congestion, and export controls (notably since 2022–24) can amplify supplier leverage.
Geographic diversification to Vietnam, Mexico, and India has reduced but not eliminated concentration; dual-sourcing across regions remains a stated strategic priority to lower single‑point risks.
- Concentration: regional supplier clusters raise disruption risk
- Logistics: port congestion and freight tightness increase supplier leverage
- Diversification: Vietnam/Mexico/India reduce but don’t remove concentration
- Mitigation: dual‑sourcing prioritized
ESG and compliance constraints
ESG constraints in 2024 — responsible minerals, mandatory labor audits and firm carbon targets — shrink Wistron’s eligible supplier pool, raising reliance on approved, audited vendors and elevating supplier bargaining power.
Wistron’s recycling and circular services reduce downstream impact, but upstream compliance still dictates sourcing; non-compliant suppliers are routinely disqualified, tightening options and increasing costs.
- Responsible minerals: audited supply chains required in 2024
- Labor audits: approved vendor lists raise dependency on compliant suppliers
- Carbon targets: scope 3 emphasis shifts sourcing decisions upstream
- Non-compliance: disqualification reduces supplier alternatives
2024 supplier concentration and export controls drive multi-sourcing and regional diversification
Advanced component concentration gives suppliers strong leverage: TSMC ~54% foundry share 2024, NVIDIA ~80% discrete GPU share, DRAM leaders Samsung/SK Hynix/Micron ~43%/31%/26%. ESG audits and export controls in 2024 narrowed eligible vendors; Wistron uses multi‑sourcing, long‑term contracts and regional diversification to Vietnam/Mexico/India to mitigate risk.
| Factor | 2024 metric |
|---|---|
| Foundry | TSMC ~54% |
| Discrete GPU | NVIDIA ~80% |
| DRAM leaders | Samsung/SK Hynix/Micron ~43%/31%/26% |
What is included in the product
Detailed Word Document
Concise Porter's Five Forces analysis of Wistron highlighting competitive rivalry, supplier and buyer power, threats from new entrants and substitutes, and disruptive technologies—identifying strategic risks and opportunities to inform investor decks, internal strategy, or academic reports.
Customizable Excel Spreadsheet
A one-sheet Wistron Porter’s Five Forces summary that instantly highlights strategic pressures and relieves decision-making pain—customizable scores, ready-to-use radar chart, and clean layout for decks or dashboards.
Customers Bargaining Power
Large OEMs with scale and options
Large OEMs—top five PC vendors holding roughly 75% of global shipments in 2024 (IDC)—run high-volume, competitive bids across EMS/ODM peers, forcing aggressive pricing and extended payment terms. Rigorous vendor scorecards prioritize cost, quality, and on-time delivery, increasing margin pressure. High customer concentration amplifies this bargaining power over Wistron.
Design co-development lock-in
Design co-development lock-in via joint engineering, NPI and custom fixtures raises switching costs and tempers pure price bargaining, and as of 2024 many OEMs still dual-source key programs to mitigate risk. Wistron leverages early engagement to embed value beyond unit cost through design ownership and tooling. Post-launch sustaining and after-sales services deepen ties and reduce churn.
Demand cyclicality and forecasting
Demand cyclicality in PC, server and enterprise capex forces lead buyers to push Wistron for flexible capacity and short lead times; in downturns buyers extract price concessions while upcycles shift negotiations toward allocation priority. VMI, consignment and forecast accuracy are used as bargaining levers to manage inventory risk. Wistron’s global footprint helps buffer regional variability and smooths capacity reallocation.
Stringent quality and ESG requirements
Buyers impose tight DPPM (<50 for tier-1 OEMs), reliability, security (ISO/IEC 27001) and sustainability metrics; missing targets risks penalties and rebids, boosting buyer leverage. Wistron invests in certifications, traceability and RBA-aligned processes to meet thresholds. Superior compliance can modestly offset pricing pressure, protecting margins.
- Buyers: DPPM <50, ISO/IEC 27001
- Risk: penalties, rebids
- Wistron: certifications, traceability, RBA alignment
- Benefit: modest price resilience
Total cost and lifecycle expectations
Customers benchmark not only BOM and conversion costs but yield, scrap, RMA and warranty; typical RMA benchmarks in contract manufacturing run 1–3% and scrap can add 5–10% to per-unit cost (2024 industry data). After-sales repair and recycling can add 10–25% to TCO and sway awards. Wistron’s end-to-end services allow competing on lifecycle value, though buyers often monetize gains into tougher commercial terms.
- RMA benchmark: 1–3% (2024)
- Scrap/TCO impact: +5–25% (2024)
- Buyers convert lifecycle gains into stricter commercial terms
Top5 OEMs ≈75%; DPPM <50, RMA 1–3%
Large OEM concentration (top5≈75% global PC shipments, IDC 2024) gives buyers strong price and terms leverage; scorecards and DPPM <50 drive penalties. Wistron offsets via co‑development, tooling lock‑in, ISO/IEC 27001 and RBA compliance and global footprint for capacity flexibility. RMA 1–3%; scrap +5–10%; lifecycle value +10–25% TCO.
| Metric | 2024 |
|---|---|
| Top5 share | ≈75% |
| DPPM target | <50 |
| RMA | 1–3% |
| Scrap/TCO | +5–25% |
Full Version Awaits
Wistron Porter's Five Forces Analysis
This preview displays the full Wistron Porter's Five Forces Analysis — the exact document you'll receive after purchase, with no placeholders or samples. It is professionally formatted, comprehensive, and ready for immediate download and use the moment you buy. What you see here is the final deliverable, complete and identical to the file provided upon payment.
Original: $10.00
-65%$10.00
$3.50Description
From Overview to Strategy Blueprint
Wistron faces mixed competitive pressures: strong buyer negotiation on volume contracts, concentrated suppliers for critical components, and moderate threat from substitutes driven by device commoditization. Scale and long-term OEM relationships give Wistron defensive advantages, but margin sensitivity and tech shifts raise strategic risk. This brief snapshot only scratches the surface. Unlock the full Porter's Five Forces Analysis to explore Wistron’s competitive dynamics, market pressures, and strategic advantages in detail.
Suppliers Bargaining Power
Concentrated key component sources
Advanced components (CPUs/GPUs/memory/panels) are concentrated among a few firms—TSMC held ~54% foundry revenue share in 2024, DRAM leaders Samsung/SK Hynix/Micron accounted for ~43%/31%/26%, and NVIDIA dominates ~80% of discrete GPUs—giving suppliers strong leverage. Shortages or allocations can spike prices and extend lead times; Wistron uses multi-sourcing where possible, long-term contracts and demand forecasting to stabilize supply but remains exposed to supplier concentration.
Commodity and materials volatility
Copper, lithium, rare earths and petrochemical derivatives drive BOM swings; lithium prices fell over 70% from 2022 peaks by 2024 while metal cycles kept copper and rare‑earths volatile, amplifying supplier leverage. Price escalation clauses and hedging blunt but do not eliminate pass‑through risk. Design‑to‑cost and requalification can offset input cost rises but add time and validation overhead. Margin pressure mounts when customers resist pass‑through pricing.
Process IP and tooling lock-in
Custom tooling, test fixtures and proprietary process know-how create switching frictions that favor incumbent suppliers, with ICT requalification cycles typically taking 3–12 months and materially raising time-to-change. Wistron leverages DFM/DFX standards to keep alternative vendors technically viable and limit lock-in. Despite this, in critical nodes and optics the supplier base is highly concentrated and true alternates can be scarce, preserving supplier leverage.
Geopolitical and logistics concentration
Supplier clusters in China/Taiwan and Asian hubs concentrate Wistron’s supply chain, raising exposure to trade, tariff, and disruption risks; freight capacity shortages, port congestion, and export controls (notably since 2022–24) can amplify supplier leverage.
Geographic diversification to Vietnam, Mexico, and India has reduced but not eliminated concentration; dual-sourcing across regions remains a stated strategic priority to lower single‑point risks.
- Concentration: regional supplier clusters raise disruption risk
- Logistics: port congestion and freight tightness increase supplier leverage
- Diversification: Vietnam/Mexico/India reduce but don’t remove concentration
- Mitigation: dual‑sourcing prioritized
ESG and compliance constraints
ESG constraints in 2024 — responsible minerals, mandatory labor audits and firm carbon targets — shrink Wistron’s eligible supplier pool, raising reliance on approved, audited vendors and elevating supplier bargaining power.
Wistron’s recycling and circular services reduce downstream impact, but upstream compliance still dictates sourcing; non-compliant suppliers are routinely disqualified, tightening options and increasing costs.
- Responsible minerals: audited supply chains required in 2024
- Labor audits: approved vendor lists raise dependency on compliant suppliers
- Carbon targets: scope 3 emphasis shifts sourcing decisions upstream
- Non-compliance: disqualification reduces supplier alternatives
2024 supplier concentration and export controls drive multi-sourcing and regional diversification
Advanced component concentration gives suppliers strong leverage: TSMC ~54% foundry share 2024, NVIDIA ~80% discrete GPU share, DRAM leaders Samsung/SK Hynix/Micron ~43%/31%/26%. ESG audits and export controls in 2024 narrowed eligible vendors; Wistron uses multi‑sourcing, long‑term contracts and regional diversification to Vietnam/Mexico/India to mitigate risk.
| Factor | 2024 metric |
|---|---|
| Foundry | TSMC ~54% |
| Discrete GPU | NVIDIA ~80% |
| DRAM leaders | Samsung/SK Hynix/Micron ~43%/31%/26% |
What is included in the product
Detailed Word Document
Concise Porter's Five Forces analysis of Wistron highlighting competitive rivalry, supplier and buyer power, threats from new entrants and substitutes, and disruptive technologies—identifying strategic risks and opportunities to inform investor decks, internal strategy, or academic reports.
Customizable Excel Spreadsheet
A one-sheet Wistron Porter’s Five Forces summary that instantly highlights strategic pressures and relieves decision-making pain—customizable scores, ready-to-use radar chart, and clean layout for decks or dashboards.
Customers Bargaining Power
Large OEMs with scale and options
Large OEMs—top five PC vendors holding roughly 75% of global shipments in 2024 (IDC)—run high-volume, competitive bids across EMS/ODM peers, forcing aggressive pricing and extended payment terms. Rigorous vendor scorecards prioritize cost, quality, and on-time delivery, increasing margin pressure. High customer concentration amplifies this bargaining power over Wistron.
Design co-development lock-in
Design co-development lock-in via joint engineering, NPI and custom fixtures raises switching costs and tempers pure price bargaining, and as of 2024 many OEMs still dual-source key programs to mitigate risk. Wistron leverages early engagement to embed value beyond unit cost through design ownership and tooling. Post-launch sustaining and after-sales services deepen ties and reduce churn.
Demand cyclicality and forecasting
Demand cyclicality in PC, server and enterprise capex forces lead buyers to push Wistron for flexible capacity and short lead times; in downturns buyers extract price concessions while upcycles shift negotiations toward allocation priority. VMI, consignment and forecast accuracy are used as bargaining levers to manage inventory risk. Wistron’s global footprint helps buffer regional variability and smooths capacity reallocation.
Stringent quality and ESG requirements
Buyers impose tight DPPM (<50 for tier-1 OEMs), reliability, security (ISO/IEC 27001) and sustainability metrics; missing targets risks penalties and rebids, boosting buyer leverage. Wistron invests in certifications, traceability and RBA-aligned processes to meet thresholds. Superior compliance can modestly offset pricing pressure, protecting margins.
- Buyers: DPPM <50, ISO/IEC 27001
- Risk: penalties, rebids
- Wistron: certifications, traceability, RBA alignment
- Benefit: modest price resilience
Total cost and lifecycle expectations
Customers benchmark not only BOM and conversion costs but yield, scrap, RMA and warranty; typical RMA benchmarks in contract manufacturing run 1–3% and scrap can add 5–10% to per-unit cost (2024 industry data). After-sales repair and recycling can add 10–25% to TCO and sway awards. Wistron’s end-to-end services allow competing on lifecycle value, though buyers often monetize gains into tougher commercial terms.
- RMA benchmark: 1–3% (2024)
- Scrap/TCO impact: +5–25% (2024)
- Buyers convert lifecycle gains into stricter commercial terms
Top5 OEMs ≈75%; DPPM <50, RMA 1–3%
Large OEM concentration (top5≈75% global PC shipments, IDC 2024) gives buyers strong price and terms leverage; scorecards and DPPM <50 drive penalties. Wistron offsets via co‑development, tooling lock‑in, ISO/IEC 27001 and RBA compliance and global footprint for capacity flexibility. RMA 1–3%; scrap +5–10%; lifecycle value +10–25% TCO.
| Metric | 2024 |
|---|---|
| Top5 share | ≈75% |
| DPPM target | <50 |
| RMA | 1–3% |
| Scrap/TCO | +5–25% |
Full Version Awaits
Wistron Porter's Five Forces Analysis
This preview displays the full Wistron Porter's Five Forces Analysis — the exact document you'll receive after purchase, with no placeholders or samples. It is professionally formatted, comprehensive, and ready for immediate download and use the moment you buy. What you see here is the final deliverable, complete and identical to the file provided upon payment.











