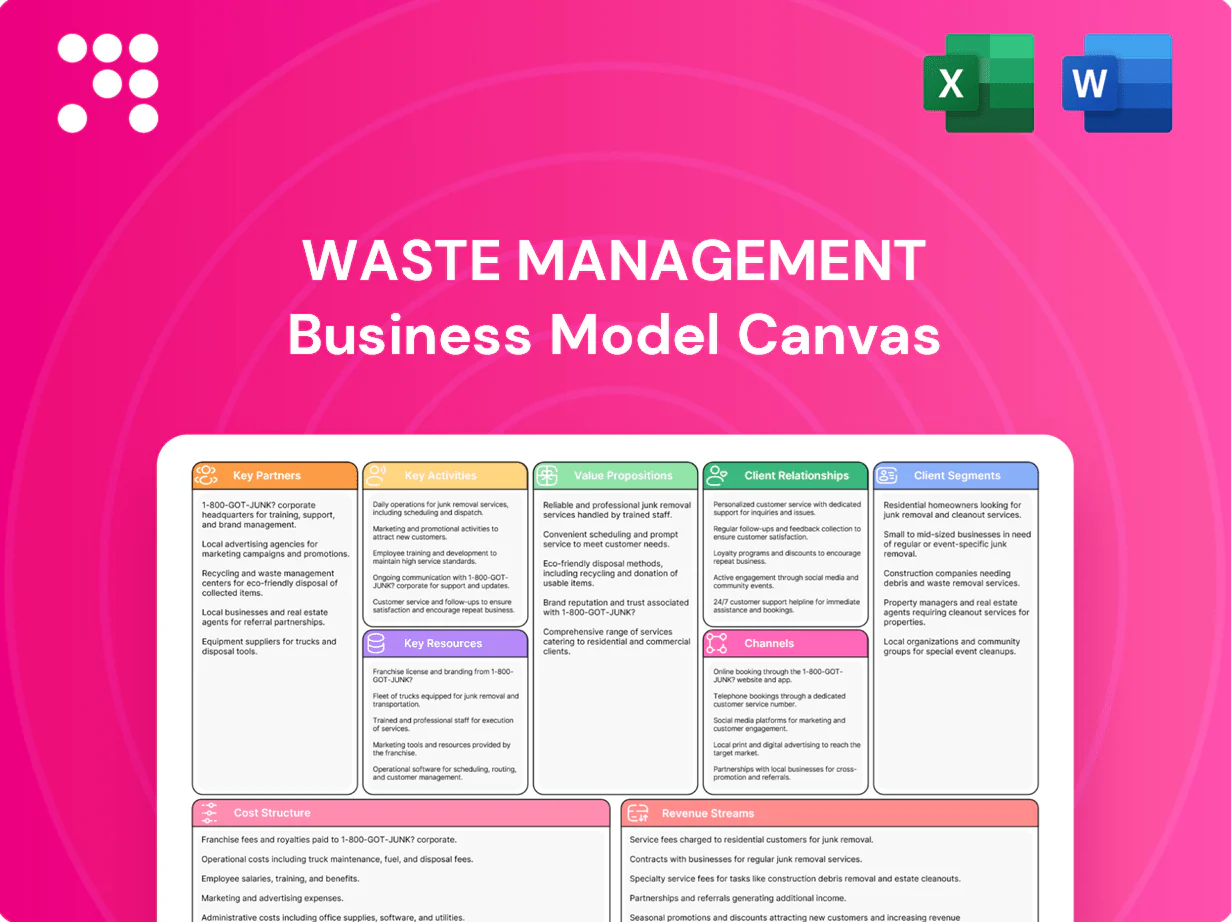
Waste Management Business Model Canvas

Business Model Canvas for Waste Services: value drivers, partners, and revenue levers
Explore Waste Management's Business Model Canvas to see how its value propositions, key partners, and revenue streams power scale and margin in a regulated industry. This concise snapshot highlights competitive advantages and operational levers. Ready to apply these insights? Purchase the full, editable Canvas for detailed, section-by-section strategy and templates.
Partnerships

Municipal and public sector contracts
City and county governments award long-term collection, recycling and disposal agreements that anchor route density and lower unit costs, with contract durations commonly 5–15 years. Public-private partnerships enable siting and capital investment certainty for MRFs and landfills. Collaboration ensures compliance with local ordinances and municipal zero-waste targets. Multi-year terms stabilize revenue visibility for operators and investors.
Equipment and fleet suppliers
OEMs (Volvo, Mack, BYD, Autocar) provide trucks, containers, automation and safety tech essential for reliable operations, with electric refuse models widely available by 2024.
Service and parts partners reduce downtime and lifecycle costs through certified maintenance networks and warranty programs tied to OEMs.
Fuel and charging partners support CNG and EV transitions; EVs produce zero tailpipe CO2, and these partnerships lower total cost of ownership and operational emissions.

Recycling and processing partners
Recycling and processing partners—MRFs, organics processors and specialty recyclers—expand recovery options by boosting capture of paper, metals, plastics, glass and compost; modern MRFs routinely recover 60–90% of target recyclables. Partnerships secure offtake contracts for commodities and compost, while joint investments in optical sorters and anaerobic digestion can cut contamination and residue rates by up to 30%, raising yield and commodity revenues and strengthening circular-economy outcomes.

Energy and utility offtakers
Power utilities and energy marketers buy landfill-gas-to-energy output and environmental attributes; LMOP reported roughly 600 operational LFG projects by 2024, creating scalable offtake volumes. Interconnection partners enable grid delivery and reliability, with typical interconnection timelines of 12–24 months. Long-term PPAs (commonly 10–15 years) stabilize cash flows and finance upgrades, while contracts and RNG sales (market pricing ~8–15 USD/MMBtu in 2024) monetize renewable generation and RNG pathways.
- offtakers: utilities, energy marketers
- scale: ~600 LFG projects (2024)
- PPAs: 10–15 year terms
- interconnection: 12–24 month timelines
- RNG pricing: ~8–15 USD/MMBtu (2024)
Technology and data providers
Technology and data providers drive efficiency through route optimization, telematics, IoT sensors and integrated billing platforms that cut mileage and labor and improve invoice accuracy. Analytics partners enable precise diversion tracking and ESG reporting from sensor and route data. Cybersecurity and cloud vendors guarantee uptime and regulatory compliance, while co-development accelerates digitization and customer self-service.
- Route optimization: up to 20% lower mileage
- Telematics/IoT: real-time route & fill-level data
- Analytics: diversion & ESG metrics
- Cyber/cloud: uptime, compliance
- Co-development: faster customer self-service
Long-term municipal deals and ~600 LFG projects boost MRF/RNG value
Long-term municipal contracts (5–15 yrs) and PPPs anchor route density and capital for MRFs/landfills. OEMs, service networks and fuel/charging partners cut downtime and TCO; EVs available broadly by 2024. MRFs recover 60–90% of recyclables; ~600 LFG projects in 2024 enable PPAs (10–15 yrs) and RNG sales (~8–15 USD/MMBtu).
| Metric | Value (2024) |
|---|---|
| MRF recovery | 60–90% |
| LFG projects | ~600 |
| Contract terms | 5–15 yrs |
| PPA terms | 10–15 yrs |
| RNG price | 8–15 USD/MMBtu |
What is included in the product
 Detailed Word Document
A comprehensive Waste Management Business Model Canvas detailing customer segments, channels, value propositions, key activities, partners, resources, cost and revenue structures across the 9 BMC blocks, reflecting real-world operations, competitive advantages and linked SWOT insights—ideal for investor presentations and strategic decision-making.

 Customizable Excel Spreadsheet
High-level view of the Waste Management Business Model Canvas with editable cells, helping teams quickly pinpoint operational bottlenecks, optimize routes and reduce disposal costs.
Activities

Waste and recycling collection
Route planning and dispatch optimize thousands of residential, commercial, and industrial pickups daily, with route optimization cutting mileage and fuel use by up to 15% and lowering operating costs accordingly. Curb-side contamination checks and onsite education aim to reduce contamination (often averaging ~20% in mixed recycling streams) and improve material value. Operations target >95% on-time service while enforcing safety protocols to prevent incidents, and systems scale to handle seasonal or event surges of up to 25–30% in volume.
Transfer, sorting, and processing
Consolidating loads at transfer stations reduces trip counts and improves route efficiency, cutting haul costs and emissions per ton; industry practice targets 20–40% fewer long-haul trips. Running MRFs yields 50–75% material recovery with bale contamination commonly 10–15%, requiring QA to protect commodity value. Operating organics and C&D lines achieves 70–90% recovery for C&D and steady organics throughput; continuous improvement focuses on lowering residue toward <10% and boosting recovery rates.

Landfill and disposal operations
Cell development, daily cover and permitted leachate management follow strict state/federal permits with continuous monitoring and treated discharge limits; daily cover reduces odors and vectors under operational KPIs. Landfill gas systems capture roughly 60–85% of methane for flaring or energy recovery, with monitoring and controls to meet emissions standards. Closure and post-closure financial assurance and care are mandated for 30 years under US federal rules. Community engagement programs, odor mitigation and impact monitoring are budgeted into operating and closure plans.

Energy capture and monetization
Landfill gas collection, compression and conversion to electricity or RNG drive revenue streams; projects typically execute 10-20 year PPAs and require active interconnection management to meet grid specs. Compliance with RINs, RECs and state renewable standards is mandatory, while maintenance regimes target >95% uptime to protect output quality and cash flows.
- landfill-gas
- compression-to-rng
- ppa-10-20yr
- rins-recs-compliance
- maintenance-95%+uptime
Sustainability consulting and reporting
Sustainability consulting delivers zero-waste roadmaps and diversion programs that in practice achieve 60–80% diversion in pilots, plus ESG data aggregation, audits and regulatory guidance to meet 2024 reporting standards and Scope 3 requirements; training and behavior-change campaigns increase on-site compliance to ~90–95%, while performance dashboards link KPIs to SLAs and client goals for continuous improvement.
- Zero-waste roadmaps: 60–80% diversion
- ESG aggregation & audits: 2024 Scope 3 alignment
- Training: 90–95% compliance uplift
- Dashboards: KPI-to-SLA tracking
Cut costs: ~15% fuel, 60–85% landfill gas capture
Route planning cuts mileage/fuel ~15% and targets >95% on-time service; curb-side checks reduce ~20% contamination. MRFs recover 50–75% of recyclables; organics/C&D recoveries 70–90% with residue <10%. Landfill gas captures 60–85% methane, supporting 10–20 year PPAs and >95% uptime; sustainability pilots deliver 60–80% diversion and 90–95% training compliance.
| Metric | 2024 Range |
|---|---|
| Route fuel reduction | ~15% |
| MRF recovery | 50–75% |
| Landfill gas capture | 60–85% |
Preview Before You Purchase
Business Model Canvas
The document you're previewing is the actual Waste Management Business Model Canvas, not a mockup—it's a direct extract from the final file you'll receive after purchase. When you complete your order, you'll get this exact, fully editable document in Word and Excel formats, structured and ready to use for planning, pitching, or implementing your waste management strategy.

Business Model Canvas for Waste Services: value drivers, partners, and revenue levers
Explore Waste Management's Business Model Canvas to see how its value propositions, key partners, and revenue streams power scale and margin in a regulated industry. This concise snapshot highlights competitive advantages and operational levers. Ready to apply these insights? Purchase the full, editable Canvas for detailed, section-by-section strategy and templates.
Partnerships
Municipal and public sector contracts
City and county governments award long-term collection, recycling and disposal agreements that anchor route density and lower unit costs, with contract durations commonly 5–15 years. Public-private partnerships enable siting and capital investment certainty for MRFs and landfills. Collaboration ensures compliance with local ordinances and municipal zero-waste targets. Multi-year terms stabilize revenue visibility for operators and investors.
Equipment and fleet suppliers
OEMs (Volvo, Mack, BYD, Autocar) provide trucks, containers, automation and safety tech essential for reliable operations, with electric refuse models widely available by 2024.
Service and parts partners reduce downtime and lifecycle costs through certified maintenance networks and warranty programs tied to OEMs.
Fuel and charging partners support CNG and EV transitions; EVs produce zero tailpipe CO2, and these partnerships lower total cost of ownership and operational emissions.
Recycling and processing partners
Recycling and processing partners—MRFs, organics processors and specialty recyclers—expand recovery options by boosting capture of paper, metals, plastics, glass and compost; modern MRFs routinely recover 60–90% of target recyclables. Partnerships secure offtake contracts for commodities and compost, while joint investments in optical sorters and anaerobic digestion can cut contamination and residue rates by up to 30%, raising yield and commodity revenues and strengthening circular-economy outcomes.
Energy and utility offtakers
Power utilities and energy marketers buy landfill-gas-to-energy output and environmental attributes; LMOP reported roughly 600 operational LFG projects by 2024, creating scalable offtake volumes. Interconnection partners enable grid delivery and reliability, with typical interconnection timelines of 12–24 months. Long-term PPAs (commonly 10–15 years) stabilize cash flows and finance upgrades, while contracts and RNG sales (market pricing ~8–15 USD/MMBtu in 2024) monetize renewable generation and RNG pathways.
- offtakers: utilities, energy marketers
- scale: ~600 LFG projects (2024)
- PPAs: 10–15 year terms
- interconnection: 12–24 month timelines
- RNG pricing: ~8–15 USD/MMBtu (2024)
Technology and data providers
Technology and data providers drive efficiency through route optimization, telematics, IoT sensors and integrated billing platforms that cut mileage and labor and improve invoice accuracy. Analytics partners enable precise diversion tracking and ESG reporting from sensor and route data. Cybersecurity and cloud vendors guarantee uptime and regulatory compliance, while co-development accelerates digitization and customer self-service.
- Route optimization: up to 20% lower mileage
- Telematics/IoT: real-time route & fill-level data
- Analytics: diversion & ESG metrics
- Cyber/cloud: uptime, compliance
- Co-development: faster customer self-service
Long-term municipal deals and ~600 LFG projects boost MRF/RNG value
Long-term municipal contracts (5–15 yrs) and PPPs anchor route density and capital for MRFs/landfills. OEMs, service networks and fuel/charging partners cut downtime and TCO; EVs available broadly by 2024. MRFs recover 60–90% of recyclables; ~600 LFG projects in 2024 enable PPAs (10–15 yrs) and RNG sales (~8–15 USD/MMBtu).
| Metric | Value (2024) |
|---|---|
| MRF recovery | 60–90% |
| LFG projects | ~600 |
| Contract terms | 5–15 yrs |
| PPA terms | 10–15 yrs |
| RNG price | 8–15 USD/MMBtu |
What is included in the product
Detailed Word Document
A comprehensive Waste Management Business Model Canvas detailing customer segments, channels, value propositions, key activities, partners, resources, cost and revenue structures across the 9 BMC blocks, reflecting real-world operations, competitive advantages and linked SWOT insights—ideal for investor presentations and strategic decision-making.
Customizable Excel Spreadsheet
High-level view of the Waste Management Business Model Canvas with editable cells, helping teams quickly pinpoint operational bottlenecks, optimize routes and reduce disposal costs.
Activities
Waste and recycling collection
Route planning and dispatch optimize thousands of residential, commercial, and industrial pickups daily, with route optimization cutting mileage and fuel use by up to 15% and lowering operating costs accordingly. Curb-side contamination checks and onsite education aim to reduce contamination (often averaging ~20% in mixed recycling streams) and improve material value. Operations target >95% on-time service while enforcing safety protocols to prevent incidents, and systems scale to handle seasonal or event surges of up to 25–30% in volume.
Transfer, sorting, and processing
Consolidating loads at transfer stations reduces trip counts and improves route efficiency, cutting haul costs and emissions per ton; industry practice targets 20–40% fewer long-haul trips. Running MRFs yields 50–75% material recovery with bale contamination commonly 10–15%, requiring QA to protect commodity value. Operating organics and C&D lines achieves 70–90% recovery for C&D and steady organics throughput; continuous improvement focuses on lowering residue toward <10% and boosting recovery rates.
Landfill and disposal operations
Cell development, daily cover and permitted leachate management follow strict state/federal permits with continuous monitoring and treated discharge limits; daily cover reduces odors and vectors under operational KPIs. Landfill gas systems capture roughly 60–85% of methane for flaring or energy recovery, with monitoring and controls to meet emissions standards. Closure and post-closure financial assurance and care are mandated for 30 years under US federal rules. Community engagement programs, odor mitigation and impact monitoring are budgeted into operating and closure plans.
Energy capture and monetization
Landfill gas collection, compression and conversion to electricity or RNG drive revenue streams; projects typically execute 10-20 year PPAs and require active interconnection management to meet grid specs. Compliance with RINs, RECs and state renewable standards is mandatory, while maintenance regimes target >95% uptime to protect output quality and cash flows.
- landfill-gas
- compression-to-rng
- ppa-10-20yr
- rins-recs-compliance
- maintenance-95%+uptime
Sustainability consulting and reporting
Sustainability consulting delivers zero-waste roadmaps and diversion programs that in practice achieve 60–80% diversion in pilots, plus ESG data aggregation, audits and regulatory guidance to meet 2024 reporting standards and Scope 3 requirements; training and behavior-change campaigns increase on-site compliance to ~90–95%, while performance dashboards link KPIs to SLAs and client goals for continuous improvement.
- Zero-waste roadmaps: 60–80% diversion
- ESG aggregation & audits: 2024 Scope 3 alignment
- Training: 90–95% compliance uplift
- Dashboards: KPI-to-SLA tracking
Cut costs: ~15% fuel, 60–85% landfill gas capture
Route planning cuts mileage/fuel ~15% and targets >95% on-time service; curb-side checks reduce ~20% contamination. MRFs recover 50–75% of recyclables; organics/C&D recoveries 70–90% with residue <10%. Landfill gas captures 60–85% methane, supporting 10–20 year PPAs and >95% uptime; sustainability pilots deliver 60–80% diversion and 90–95% training compliance.
| Metric | 2024 Range |
|---|---|
| Route fuel reduction | ~15% |
| MRF recovery | 50–75% |
| Landfill gas capture | 60–85% |
Preview Before You Purchase
Business Model Canvas
The document you're previewing is the actual Waste Management Business Model Canvas, not a mockup—it's a direct extract from the final file you'll receive after purchase. When you complete your order, you'll get this exact, fully editable document in Word and Excel formats, structured and ready to use for planning, pitching, or implementing your waste management strategy.
Original: $10.00
-65%$10.00
$3.50Description
Business Model Canvas for Waste Services: value drivers, partners, and revenue levers
Explore Waste Management's Business Model Canvas to see how its value propositions, key partners, and revenue streams power scale and margin in a regulated industry. This concise snapshot highlights competitive advantages and operational levers. Ready to apply these insights? Purchase the full, editable Canvas for detailed, section-by-section strategy and templates.
Partnerships
Municipal and public sector contracts
City and county governments award long-term collection, recycling and disposal agreements that anchor route density and lower unit costs, with contract durations commonly 5–15 years. Public-private partnerships enable siting and capital investment certainty for MRFs and landfills. Collaboration ensures compliance with local ordinances and municipal zero-waste targets. Multi-year terms stabilize revenue visibility for operators and investors.
Equipment and fleet suppliers
OEMs (Volvo, Mack, BYD, Autocar) provide trucks, containers, automation and safety tech essential for reliable operations, with electric refuse models widely available by 2024.
Service and parts partners reduce downtime and lifecycle costs through certified maintenance networks and warranty programs tied to OEMs.
Fuel and charging partners support CNG and EV transitions; EVs produce zero tailpipe CO2, and these partnerships lower total cost of ownership and operational emissions.
Recycling and processing partners
Recycling and processing partners—MRFs, organics processors and specialty recyclers—expand recovery options by boosting capture of paper, metals, plastics, glass and compost; modern MRFs routinely recover 60–90% of target recyclables. Partnerships secure offtake contracts for commodities and compost, while joint investments in optical sorters and anaerobic digestion can cut contamination and residue rates by up to 30%, raising yield and commodity revenues and strengthening circular-economy outcomes.
Energy and utility offtakers
Power utilities and energy marketers buy landfill-gas-to-energy output and environmental attributes; LMOP reported roughly 600 operational LFG projects by 2024, creating scalable offtake volumes. Interconnection partners enable grid delivery and reliability, with typical interconnection timelines of 12–24 months. Long-term PPAs (commonly 10–15 years) stabilize cash flows and finance upgrades, while contracts and RNG sales (market pricing ~8–15 USD/MMBtu in 2024) monetize renewable generation and RNG pathways.
- offtakers: utilities, energy marketers
- scale: ~600 LFG projects (2024)
- PPAs: 10–15 year terms
- interconnection: 12–24 month timelines
- RNG pricing: ~8–15 USD/MMBtu (2024)
Technology and data providers
Technology and data providers drive efficiency through route optimization, telematics, IoT sensors and integrated billing platforms that cut mileage and labor and improve invoice accuracy. Analytics partners enable precise diversion tracking and ESG reporting from sensor and route data. Cybersecurity and cloud vendors guarantee uptime and regulatory compliance, while co-development accelerates digitization and customer self-service.
- Route optimization: up to 20% lower mileage
- Telematics/IoT: real-time route & fill-level data
- Analytics: diversion & ESG metrics
- Cyber/cloud: uptime, compliance
- Co-development: faster customer self-service
Long-term municipal deals and ~600 LFG projects boost MRF/RNG value
Long-term municipal contracts (5–15 yrs) and PPPs anchor route density and capital for MRFs/landfills. OEMs, service networks and fuel/charging partners cut downtime and TCO; EVs available broadly by 2024. MRFs recover 60–90% of recyclables; ~600 LFG projects in 2024 enable PPAs (10–15 yrs) and RNG sales (~8–15 USD/MMBtu).
| Metric | Value (2024) |
|---|---|
| MRF recovery | 60–90% |
| LFG projects | ~600 |
| Contract terms | 5–15 yrs |
| PPA terms | 10–15 yrs |
| RNG price | 8–15 USD/MMBtu |
What is included in the product
Detailed Word Document
A comprehensive Waste Management Business Model Canvas detailing customer segments, channels, value propositions, key activities, partners, resources, cost and revenue structures across the 9 BMC blocks, reflecting real-world operations, competitive advantages and linked SWOT insights—ideal for investor presentations and strategic decision-making.
Customizable Excel Spreadsheet
High-level view of the Waste Management Business Model Canvas with editable cells, helping teams quickly pinpoint operational bottlenecks, optimize routes and reduce disposal costs.
Activities
Waste and recycling collection
Route planning and dispatch optimize thousands of residential, commercial, and industrial pickups daily, with route optimization cutting mileage and fuel use by up to 15% and lowering operating costs accordingly. Curb-side contamination checks and onsite education aim to reduce contamination (often averaging ~20% in mixed recycling streams) and improve material value. Operations target >95% on-time service while enforcing safety protocols to prevent incidents, and systems scale to handle seasonal or event surges of up to 25–30% in volume.
Transfer, sorting, and processing
Consolidating loads at transfer stations reduces trip counts and improves route efficiency, cutting haul costs and emissions per ton; industry practice targets 20–40% fewer long-haul trips. Running MRFs yields 50–75% material recovery with bale contamination commonly 10–15%, requiring QA to protect commodity value. Operating organics and C&D lines achieves 70–90% recovery for C&D and steady organics throughput; continuous improvement focuses on lowering residue toward <10% and boosting recovery rates.
Landfill and disposal operations
Cell development, daily cover and permitted leachate management follow strict state/federal permits with continuous monitoring and treated discharge limits; daily cover reduces odors and vectors under operational KPIs. Landfill gas systems capture roughly 60–85% of methane for flaring or energy recovery, with monitoring and controls to meet emissions standards. Closure and post-closure financial assurance and care are mandated for 30 years under US federal rules. Community engagement programs, odor mitigation and impact monitoring are budgeted into operating and closure plans.
Energy capture and monetization
Landfill gas collection, compression and conversion to electricity or RNG drive revenue streams; projects typically execute 10-20 year PPAs and require active interconnection management to meet grid specs. Compliance with RINs, RECs and state renewable standards is mandatory, while maintenance regimes target >95% uptime to protect output quality and cash flows.
- landfill-gas
- compression-to-rng
- ppa-10-20yr
- rins-recs-compliance
- maintenance-95%+uptime
Sustainability consulting and reporting
Sustainability consulting delivers zero-waste roadmaps and diversion programs that in practice achieve 60–80% diversion in pilots, plus ESG data aggregation, audits and regulatory guidance to meet 2024 reporting standards and Scope 3 requirements; training and behavior-change campaigns increase on-site compliance to ~90–95%, while performance dashboards link KPIs to SLAs and client goals for continuous improvement.
- Zero-waste roadmaps: 60–80% diversion
- ESG aggregation & audits: 2024 Scope 3 alignment
- Training: 90–95% compliance uplift
- Dashboards: KPI-to-SLA tracking
Cut costs: ~15% fuel, 60–85% landfill gas capture
Route planning cuts mileage/fuel ~15% and targets >95% on-time service; curb-side checks reduce ~20% contamination. MRFs recover 50–75% of recyclables; organics/C&D recoveries 70–90% with residue <10%. Landfill gas captures 60–85% methane, supporting 10–20 year PPAs and >95% uptime; sustainability pilots deliver 60–80% diversion and 90–95% training compliance.
| Metric | 2024 Range |
|---|---|
| Route fuel reduction | ~15% |
| MRF recovery | 50–75% |
| Landfill gas capture | 60–85% |
Preview Before You Purchase
Business Model Canvas
The document you're previewing is the actual Waste Management Business Model Canvas, not a mockup—it's a direct extract from the final file you'll receive after purchase. When you complete your order, you'll get this exact, fully editable document in Word and Excel formats, structured and ready to use for planning, pitching, or implementing your waste management strategy.











