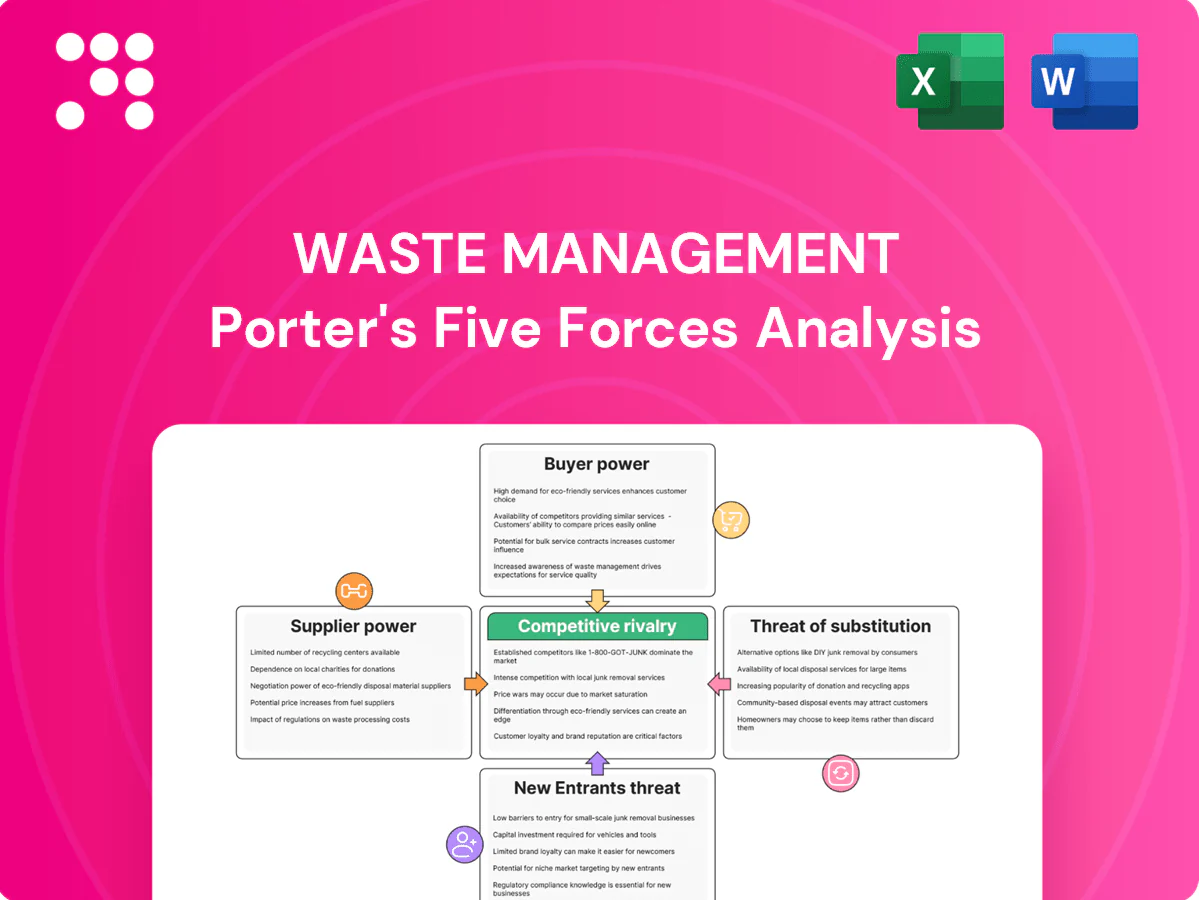
Waste Management Porter's Five Forces Analysis

From Overview to Strategy Blueprint
Waste Management faces moderate supplier power, high entry barriers, intense local rivalry, rising buyer demand for sustainable services, and limited substitutes due to heavy infrastructure needs. This snapshot highlights key strategic levers and risks. Unlock the full Porter's Five Forces Analysis for force-by-force ratings, visuals, and actionable implications.
Suppliers Bargaining Power

Fuel and energy suppliers
WM’s fleet and landfill ops depend heavily on diesel and electricity, giving fuel utilities moderate leverage; U.S. on‑highway diesel averaged about $3.90/gal in 2024 (EIA), creating margin pressure. Volatile energy costs are partly offset by hedging programs and fuel surcharges. Scale purchasing and multi‑year contracts materially reduce supplier power across many regions.
Vehicle and heavy equipment OEMs
Garbage trucks, compactors and yellow iron come from a concentrated set of OEMs (Mack, Volvo/Freightliner, Peterbilt), raising supplier dependence. OEM chassis and parts experienced lead times of 12 months or more in 2022–24, constraining uptime and increasing maintenance capital. WM’s North American scale (over 20,000 collection vehicles), standardized specs and multi-vendor sourcing mitigate OEM bargaining power.

Technology and software vendors
Route optimization, telematics, and MRF automation create switching costs for software providers as fleets and facilities embed specific data schemas and APIs, and in 2024 WM continued building in-house integration teams to manage these connections.
Many solutions remain modular and competitive in 2024, with third-party vendors offering interoperable modules that constrain pricing power.
WM’s internal capabilities and systems-integration expertise reduce vendor lock-in, enabling multi-vendor strategies and negotiating leverage.

Landfill liner, chemical, and container suppliers
Safety-critical landfill liners, chemicals, and containers are governed by regulatory standards (eg, EPA Subtitle D composite liner requirements), limiting viable substitutes; however multiple qualified regional suppliers keep price power in check. Waste Management's scale (2024 revenue reported at $20.4 billion) and centralized procurement enable bulk contracting that compresses supplier margins and raises switching leverage.
- Regulatory constraints: limits substitutes
- Supplier base: multiple regional vendors
- Scale effect: 2024 revenue $20.4B—bulk purchasing lowers margins
Labor and specialized contractors
Skilled drivers, mechanics, and environmental engineers are scarce in tight 2024 U.S. labor markets (U.S. unemployment ~3.7%), elevating wage pressure for waste services; union presence (overall union membership ~10.1% in 2024) in some locales can further influence terms. WM’s training pipelines and retention programs reduce churn and moderate supplier power by improving internal supply of qualified labor.
Scale and contracts offset supplier pressure despite diesel, labor and OEM constraints
Suppliers have moderate power: fuel (U.S. diesel ~$3.90/gal in 2024) and OEMs (12+ month lead times) pressure margins, but WM scale (2024 revenue $20.4B; >20,000 collection vehicles) and multi‑year contracts cut leverage. Labor tightness (unemployment ~3.7%; union ~10.1%) raises wage cost; in‑house systems and procurement lower supplier lock‑in.
| Metric | 2024 |
|---|---|
| Revenue | $20.4B |
| Diesel | $3.90/gal |
| Fleet | >20,000 vehicles |
| Unemployment | 3.7% |
What is included in the product
 Detailed Word Document
Analyzes competitive rivalry, supplier and buyer power, threats of new entrants and substitutes, and regulatory dynamics shaping Waste Management’s pricing, margins, and growth. Highlights disruptive technologies, emerging threats, and market barriers that sustain incumbency.

 Customizable Excel Spreadsheet
One-sheet Porter's Five Forces for Waste Management instantly highlights competitive pressures with a clean spider chart and editable scores—perfect for quick boardroom decisions and scenario comparisons.
Customers Bargaining Power

Municipal contracts
Cities issue RFPs with multi-year terms, typically 3–10 years, concentrating buying power and driving competitive bidding that pressures prices. Long contract lengths and high switching frictions for routes, equipment and regulatory compliance materially soften buyers’ leverage. Performance-based renewals and bundled collection, disposal and recycling services strengthen Waste Management’s renewal rates and margin protection.
Commercial and industrial clients
Large retail and C&I chains negotiate regional or national pricing, increasing buyer leverage and pressuring margins. Small businesses have less clout but frequently switch to local haulers, keeping price sensitivity high. As of 2024 WM serves over 25 million customers, and its route density plus value-added services (recycling, compactors, single-source billing) create sticky contracts that reduce churn.

Price sensitivity and fee visibility
Surcharges and index-linked escalators faced customer pushback during 2024 as U.S. inflation averaged about 3.4%, compressing discretionary budgets and increasing disputes over pass-through costs. Heightened transparency demands from customers and regulators—reflected in rising disclosure rules in 2024—constrain pricing flexibility and force clearer fee breakdowns. Demonstrated reliability and measurable ESG benefits (recycling rates, emissions reductions) enabled operators to sustain premium rates with lower churn.

Service differentiation and bundling
Service differentiation — recycling, organics collection and sustainability consulting — reduces direct price comparisons and shifts competition to value-added services; as of 2024 Waste Management serves over 25 million customers in North America, amplifying bundle reach. Bundles raise switching costs and perceived value, while data reporting and zero-waste programs deepen buyer dependence and stickiness.
- 2024: >25 million customers
- Bundles = higher switching costs
- Data + zero-waste = increased buyer dependence
Contractual switching costs
Contractual switching costs in waste management—cart ownership, route reconfiguration, and regulatory approvals—create meaningful friction that limits buyer mobility. Termination penalties and transition logistics (equipment, permits, labor) deter rapid changes, with major firms like Waste Management reporting FY2024 revenue near $22.1B, reflecting entrenched contract value. These factors lower effective buyer power despite apparent vendor choices.
- Cart ownership: municipal/contracted assets retain switching costs
- Route reconfiguration: rerouting adds operational expense/time
- Regulatory approvals: permits delay provider changes
- Termination/transition: penalties and logistics deter churn
Municipal RFPs lock 3–10 yr contracts; >25M customers raise stickiness
Customers concentrate buying via municipal RFPs (3–10 yr), driving bids but long terms and switching frictions limit leverage.
Large chains negotiate regionally, pushing prices, while >25M WM customers and route density increase stickiness; WM FY2024 revenue ~$22.1B.
Index escalators saw pushback amid 2024 US inflation ~3.4%, yet bundles and ESG services sustain premium pricing.
| Metric | 2024 |
|---|---|
| Customers | >25M |
| Revenue | $22.1B |
| Contract length | 3–10 yrs |
| US inflation | 3.4% |
Preview the Actual Deliverable
Waste Management Porter's Five Forces Analysis
This preview shows the exact Waste Management Porter’s Five Forces analysis you'll receive after purchase—no placeholders or mockups. The full, professionally formatted document is ready for immediate download and use the moment you buy, covering competitive rivalry, supplier and buyer power, threats of entry and substitution, and strategic implications. What you see here is the deliverable you'll get instantly.

From Overview to Strategy Blueprint
Waste Management faces moderate supplier power, high entry barriers, intense local rivalry, rising buyer demand for sustainable services, and limited substitutes due to heavy infrastructure needs. This snapshot highlights key strategic levers and risks. Unlock the full Porter's Five Forces Analysis for force-by-force ratings, visuals, and actionable implications.
Suppliers Bargaining Power
Fuel and energy suppliers
WM’s fleet and landfill ops depend heavily on diesel and electricity, giving fuel utilities moderate leverage; U.S. on‑highway diesel averaged about $3.90/gal in 2024 (EIA), creating margin pressure. Volatile energy costs are partly offset by hedging programs and fuel surcharges. Scale purchasing and multi‑year contracts materially reduce supplier power across many regions.
Vehicle and heavy equipment OEMs
Garbage trucks, compactors and yellow iron come from a concentrated set of OEMs (Mack, Volvo/Freightliner, Peterbilt), raising supplier dependence. OEM chassis and parts experienced lead times of 12 months or more in 2022–24, constraining uptime and increasing maintenance capital. WM’s North American scale (over 20,000 collection vehicles), standardized specs and multi-vendor sourcing mitigate OEM bargaining power.
Technology and software vendors
Route optimization, telematics, and MRF automation create switching costs for software providers as fleets and facilities embed specific data schemas and APIs, and in 2024 WM continued building in-house integration teams to manage these connections.
Many solutions remain modular and competitive in 2024, with third-party vendors offering interoperable modules that constrain pricing power.
WM’s internal capabilities and systems-integration expertise reduce vendor lock-in, enabling multi-vendor strategies and negotiating leverage.
Landfill liner, chemical, and container suppliers
Safety-critical landfill liners, chemicals, and containers are governed by regulatory standards (eg, EPA Subtitle D composite liner requirements), limiting viable substitutes; however multiple qualified regional suppliers keep price power in check. Waste Management's scale (2024 revenue reported at $20.4 billion) and centralized procurement enable bulk contracting that compresses supplier margins and raises switching leverage.
- Regulatory constraints: limits substitutes
- Supplier base: multiple regional vendors
- Scale effect: 2024 revenue $20.4B—bulk purchasing lowers margins
Labor and specialized contractors
Skilled drivers, mechanics, and environmental engineers are scarce in tight 2024 U.S. labor markets (U.S. unemployment ~3.7%), elevating wage pressure for waste services; union presence (overall union membership ~10.1% in 2024) in some locales can further influence terms. WM’s training pipelines and retention programs reduce churn and moderate supplier power by improving internal supply of qualified labor.
Scale and contracts offset supplier pressure despite diesel, labor and OEM constraints
Suppliers have moderate power: fuel (U.S. diesel ~$3.90/gal in 2024) and OEMs (12+ month lead times) pressure margins, but WM scale (2024 revenue $20.4B; >20,000 collection vehicles) and multi‑year contracts cut leverage. Labor tightness (unemployment ~3.7%; union ~10.1%) raises wage cost; in‑house systems and procurement lower supplier lock‑in.
| Metric | 2024 |
|---|---|
| Revenue | $20.4B |
| Diesel | $3.90/gal |
| Fleet | >20,000 vehicles |
| Unemployment | 3.7% |
What is included in the product
Detailed Word Document
Analyzes competitive rivalry, supplier and buyer power, threats of new entrants and substitutes, and regulatory dynamics shaping Waste Management’s pricing, margins, and growth. Highlights disruptive technologies, emerging threats, and market barriers that sustain incumbency.
Customizable Excel Spreadsheet
One-sheet Porter's Five Forces for Waste Management instantly highlights competitive pressures with a clean spider chart and editable scores—perfect for quick boardroom decisions and scenario comparisons.
Customers Bargaining Power
Municipal contracts
Cities issue RFPs with multi-year terms, typically 3–10 years, concentrating buying power and driving competitive bidding that pressures prices. Long contract lengths and high switching frictions for routes, equipment and regulatory compliance materially soften buyers’ leverage. Performance-based renewals and bundled collection, disposal and recycling services strengthen Waste Management’s renewal rates and margin protection.
Commercial and industrial clients
Large retail and C&I chains negotiate regional or national pricing, increasing buyer leverage and pressuring margins. Small businesses have less clout but frequently switch to local haulers, keeping price sensitivity high. As of 2024 WM serves over 25 million customers, and its route density plus value-added services (recycling, compactors, single-source billing) create sticky contracts that reduce churn.
Price sensitivity and fee visibility
Surcharges and index-linked escalators faced customer pushback during 2024 as U.S. inflation averaged about 3.4%, compressing discretionary budgets and increasing disputes over pass-through costs. Heightened transparency demands from customers and regulators—reflected in rising disclosure rules in 2024—constrain pricing flexibility and force clearer fee breakdowns. Demonstrated reliability and measurable ESG benefits (recycling rates, emissions reductions) enabled operators to sustain premium rates with lower churn.
Service differentiation and bundling
Service differentiation — recycling, organics collection and sustainability consulting — reduces direct price comparisons and shifts competition to value-added services; as of 2024 Waste Management serves over 25 million customers in North America, amplifying bundle reach. Bundles raise switching costs and perceived value, while data reporting and zero-waste programs deepen buyer dependence and stickiness.
- 2024: >25 million customers
- Bundles = higher switching costs
- Data + zero-waste = increased buyer dependence
Contractual switching costs
Contractual switching costs in waste management—cart ownership, route reconfiguration, and regulatory approvals—create meaningful friction that limits buyer mobility. Termination penalties and transition logistics (equipment, permits, labor) deter rapid changes, with major firms like Waste Management reporting FY2024 revenue near $22.1B, reflecting entrenched contract value. These factors lower effective buyer power despite apparent vendor choices.
- Cart ownership: municipal/contracted assets retain switching costs
- Route reconfiguration: rerouting adds operational expense/time
- Regulatory approvals: permits delay provider changes
- Termination/transition: penalties and logistics deter churn
Municipal RFPs lock 3–10 yr contracts; >25M customers raise stickiness
Customers concentrate buying via municipal RFPs (3–10 yr), driving bids but long terms and switching frictions limit leverage.
Large chains negotiate regionally, pushing prices, while >25M WM customers and route density increase stickiness; WM FY2024 revenue ~$22.1B.
Index escalators saw pushback amid 2024 US inflation ~3.4%, yet bundles and ESG services sustain premium pricing.
| Metric | 2024 |
|---|---|
| Customers | >25M |
| Revenue | $22.1B |
| Contract length | 3–10 yrs |
| US inflation | 3.4% |
Preview the Actual Deliverable
Waste Management Porter's Five Forces Analysis
This preview shows the exact Waste Management Porter’s Five Forces analysis you'll receive after purchase—no placeholders or mockups. The full, professionally formatted document is ready for immediate download and use the moment you buy, covering competitive rivalry, supplier and buyer power, threats of entry and substitution, and strategic implications. What you see here is the deliverable you'll get instantly.
Description
From Overview to Strategy Blueprint
Waste Management faces moderate supplier power, high entry barriers, intense local rivalry, rising buyer demand for sustainable services, and limited substitutes due to heavy infrastructure needs. This snapshot highlights key strategic levers and risks. Unlock the full Porter's Five Forces Analysis for force-by-force ratings, visuals, and actionable implications.
Suppliers Bargaining Power
Fuel and energy suppliers
WM’s fleet and landfill ops depend heavily on diesel and electricity, giving fuel utilities moderate leverage; U.S. on‑highway diesel averaged about $3.90/gal in 2024 (EIA), creating margin pressure. Volatile energy costs are partly offset by hedging programs and fuel surcharges. Scale purchasing and multi‑year contracts materially reduce supplier power across many regions.
Vehicle and heavy equipment OEMs
Garbage trucks, compactors and yellow iron come from a concentrated set of OEMs (Mack, Volvo/Freightliner, Peterbilt), raising supplier dependence. OEM chassis and parts experienced lead times of 12 months or more in 2022–24, constraining uptime and increasing maintenance capital. WM’s North American scale (over 20,000 collection vehicles), standardized specs and multi-vendor sourcing mitigate OEM bargaining power.
Technology and software vendors
Route optimization, telematics, and MRF automation create switching costs for software providers as fleets and facilities embed specific data schemas and APIs, and in 2024 WM continued building in-house integration teams to manage these connections.
Many solutions remain modular and competitive in 2024, with third-party vendors offering interoperable modules that constrain pricing power.
WM’s internal capabilities and systems-integration expertise reduce vendor lock-in, enabling multi-vendor strategies and negotiating leverage.
Landfill liner, chemical, and container suppliers
Safety-critical landfill liners, chemicals, and containers are governed by regulatory standards (eg, EPA Subtitle D composite liner requirements), limiting viable substitutes; however multiple qualified regional suppliers keep price power in check. Waste Management's scale (2024 revenue reported at $20.4 billion) and centralized procurement enable bulk contracting that compresses supplier margins and raises switching leverage.
- Regulatory constraints: limits substitutes
- Supplier base: multiple regional vendors
- Scale effect: 2024 revenue $20.4B—bulk purchasing lowers margins
Labor and specialized contractors
Skilled drivers, mechanics, and environmental engineers are scarce in tight 2024 U.S. labor markets (U.S. unemployment ~3.7%), elevating wage pressure for waste services; union presence (overall union membership ~10.1% in 2024) in some locales can further influence terms. WM’s training pipelines and retention programs reduce churn and moderate supplier power by improving internal supply of qualified labor.
Scale and contracts offset supplier pressure despite diesel, labor and OEM constraints
Suppliers have moderate power: fuel (U.S. diesel ~$3.90/gal in 2024) and OEMs (12+ month lead times) pressure margins, but WM scale (2024 revenue $20.4B; >20,000 collection vehicles) and multi‑year contracts cut leverage. Labor tightness (unemployment ~3.7%; union ~10.1%) raises wage cost; in‑house systems and procurement lower supplier lock‑in.
| Metric | 2024 |
|---|---|
| Revenue | $20.4B |
| Diesel | $3.90/gal |
| Fleet | >20,000 vehicles |
| Unemployment | 3.7% |
What is included in the product
Detailed Word Document
Analyzes competitive rivalry, supplier and buyer power, threats of new entrants and substitutes, and regulatory dynamics shaping Waste Management’s pricing, margins, and growth. Highlights disruptive technologies, emerging threats, and market barriers that sustain incumbency.
Customizable Excel Spreadsheet
One-sheet Porter's Five Forces for Waste Management instantly highlights competitive pressures with a clean spider chart and editable scores—perfect for quick boardroom decisions and scenario comparisons.
Customers Bargaining Power
Municipal contracts
Cities issue RFPs with multi-year terms, typically 3–10 years, concentrating buying power and driving competitive bidding that pressures prices. Long contract lengths and high switching frictions for routes, equipment and regulatory compliance materially soften buyers’ leverage. Performance-based renewals and bundled collection, disposal and recycling services strengthen Waste Management’s renewal rates and margin protection.
Commercial and industrial clients
Large retail and C&I chains negotiate regional or national pricing, increasing buyer leverage and pressuring margins. Small businesses have less clout but frequently switch to local haulers, keeping price sensitivity high. As of 2024 WM serves over 25 million customers, and its route density plus value-added services (recycling, compactors, single-source billing) create sticky contracts that reduce churn.
Price sensitivity and fee visibility
Surcharges and index-linked escalators faced customer pushback during 2024 as U.S. inflation averaged about 3.4%, compressing discretionary budgets and increasing disputes over pass-through costs. Heightened transparency demands from customers and regulators—reflected in rising disclosure rules in 2024—constrain pricing flexibility and force clearer fee breakdowns. Demonstrated reliability and measurable ESG benefits (recycling rates, emissions reductions) enabled operators to sustain premium rates with lower churn.
Service differentiation and bundling
Service differentiation — recycling, organics collection and sustainability consulting — reduces direct price comparisons and shifts competition to value-added services; as of 2024 Waste Management serves over 25 million customers in North America, amplifying bundle reach. Bundles raise switching costs and perceived value, while data reporting and zero-waste programs deepen buyer dependence and stickiness.
- 2024: >25 million customers
- Bundles = higher switching costs
- Data + zero-waste = increased buyer dependence
Contractual switching costs
Contractual switching costs in waste management—cart ownership, route reconfiguration, and regulatory approvals—create meaningful friction that limits buyer mobility. Termination penalties and transition logistics (equipment, permits, labor) deter rapid changes, with major firms like Waste Management reporting FY2024 revenue near $22.1B, reflecting entrenched contract value. These factors lower effective buyer power despite apparent vendor choices.
- Cart ownership: municipal/contracted assets retain switching costs
- Route reconfiguration: rerouting adds operational expense/time
- Regulatory approvals: permits delay provider changes
- Termination/transition: penalties and logistics deter churn
Municipal RFPs lock 3–10 yr contracts; >25M customers raise stickiness
Customers concentrate buying via municipal RFPs (3–10 yr), driving bids but long terms and switching frictions limit leverage.
Large chains negotiate regionally, pushing prices, while >25M WM customers and route density increase stickiness; WM FY2024 revenue ~$22.1B.
Index escalators saw pushback amid 2024 US inflation ~3.4%, yet bundles and ESG services sustain premium pricing.
| Metric | 2024 |
|---|---|
| Customers | >25M |
| Revenue | $22.1B |
| Contract length | 3–10 yrs |
| US inflation | 3.4% |
Preview the Actual Deliverable
Waste Management Porter's Five Forces Analysis
This preview shows the exact Waste Management Porter’s Five Forces analysis you'll receive after purchase—no placeholders or mockups. The full, professionally formatted document is ready for immediate download and use the moment you buy, covering competitive rivalry, supplier and buyer power, threats of entry and substitution, and strategic implications. What you see here is the deliverable you'll get instantly.











