Waste Management Marketing Mix

Ready-Made Marketing Analysis, Ready to Use
Discover how Waste Management’s product offerings, pricing tiers, distribution networks, and promotional tactics combine to secure market leadership—this preview only scratches the surface. Purchase the full, editable 4Ps Marketing Mix Analysis for actionable insights, real-world data, and slide-ready content to save time and sharpen strategy.
Product

Integrated waste collection services
Integrated end-to-end pickup serves residential, commercial, industrial and municipal customers with container sizes and frequencies matched to demand; global MSW totaled about 2.24 billion tonnes in 2022 (World Bank) and the US generated 292.4 million tons in 2022 (EPA). Options include curbside, roll-off, compactors and specialty streams; service reliability, safety and route optimization drive measurable efficiency, while add-ons like contamination audits and extra pickups increase flexibility.
Recycling and materials recovery
Single-stream and source-separated recycling routed through modern MRFs commonly yield 75–90% recovery, maximizing diversion. Active commodity marketing for paper, plastics, metals and OCC captures the bulk of material revenue and circular value. Contamination-reduction programs measurably boost yield and lower customer disposal costs. Reporting dashboards present diversion rates and environmental impact metrics (tons diverted, GHG savings).

Landfill and disposal operations
Engineered landfills with liners, leachate collection and gas controls dominate new permits and handle large volumes—US landfills received about 146.1 million tons MSW (EPA, 2023) ensuring safe, compliant disposal. Transfer stations and logistics optimize haul distance and capacity to cut trucking costs. Specialized handling for industrial and C&D waste boosts throughput and recovery rates. Robust post-closure care and compliance management secure long-term stewardship.

Renewable energy from landfill gas
Landfill gas-to-energy projects capture methane and convert it to electricity or renewable natural gas, with the EPA LMOP reporting 526 operational projects in the U.S. that support corporate ESG targets and generate renewable energy credits. Co-development can provide onsite energy or grid supply, and revenue is monetized via PPAs and market mechanisms including RINs, LCFS credits, and utility partnerships.
- 526 operational LFG projects (EPA LMOP)
- Revenue: PPAs, RINs, LCFS, utility agreements
- Use cases: onsite power, RNG injection to grid
Sustainability consulting and services
Sustainability consulting offers waste audits that typically reveal 10–30% cost savings, zero-waste roadmaps and circularity strategies converting up to 30% of waste streams into revenue; compliance guidance supports ESG/CSRD reporting (CSRD covers ~50,000 firms by 2026). Custom organics, reuse and take-back programs plus training drive measurable behavior change and diversion gains.
- Waste audits: 10–30% cost reduction
- Organics: ~30% of MSW
- CSRD: ~50,000 firms by 2026
- Training: measurable diversion & ROI
Waste value chain: global MSW 2.24B t, US 292.4M t — recycling 75–90%, 526 LFG projects
Integrated services span curbside to industrial; global MSW 2.24B t (2022), US 292.4M t (2022). Recycling via MRFs yields 75–90% recovery; US landfills received 146.1M t (2023). 526 LFG projects (EPA LMOP) generate PPAs/RINs/LCFS revenue; waste audits reduce costs 10–30% and CSRD impacts ~50,000 firms by 2026.
| Metric | Value | Source |
|---|---|---|
| Global MSW | 2.24B t (2022) | World Bank |
| US MSW | 292.4M t (2022) | EPA |
| US landfill | 146.1M t (2023) | EPA |
| LFG projects | 526 | EPA LMOP |
| Recycling yield | 75–90% | MRF data |
| Audit savings | 10–30% | Industry studies |
What is included in the product
 Detailed Word Document
Delivers a concise, company-specific deep dive into Waste Management’s Product, Price, Place, and Promotion strategies, using actual brand practices and market context to inform actionable positioning and competitive implications—ideal for managers, consultants, and marketers.

 Customizable Excel Spreadsheet
Condenses Waste Management’s 4Ps into a concise, customizable one‑pager that relieves briefing fatigue, speeds leadership alignment, and helps non‑marketing stakeholders quickly grasp strategic positioning for meetings or decks.
Place

Nationwide collection network
Nationwide collection network leverages a large fleet to serve about 25 million customers across 48 US states and Canada, enabling consistent urban and rural service. Dynamic routing and regional hubs cut transit time and lower costs, improving route efficiency for thousands of accounts. Local operations teams align with municipal and enterprise requirements, and scalability supports multi-site national accounts spanning thousands of locations.
Transfer stations and MRF footprint
Strategic transfer stations consolidate loads and can cut haul distances, improving cost per ton and fleet utilization; industry practice shows centralized hubs reduce transport miles by double-digit percentages. MRFs expand recycling access and commodities recovery, supporting a US municipal recycling rate near 32%. Proximity to landfills shortens turnaround and aids capacity planning, while site redundancy bolsters resilience during peak volumes or disruptions.

Digital portals and APIs
Self-service portals handle ordering, scheduling, billing and reporting, reducing administrative calls and accelerating service requests; adopters report up to 60% faster transaction workflows. APIs integrate with ERP/CMMS for automated work orders and seamless data flow, aligning with the 2024 MuleSoft benchmark where 89% of IT leaders call APIs critical. Real-time alerts and service confirmations boost transparency and SLA adherence, while diversion dashboards centralize ESG metrics for stakeholders and simplify regulatory reporting.

On-site customer solutions
On-site customer solutions place embedded containers, compactors and balers at facilities with right-sized equipment and pickup cadences aligned to generation patterns, reducing haul trips by up to 70% and lowering transportation costs; onsite training cuts contamination and safety incidents by as much as 50%, while mobile response teams scale for seasonal or project-based surges in volume.
- Embedded equipment: compactors, balers, containers
- Right-sizing: cadence matches generation patterns
- Training: reduces contamination & safety risks (~50%)
- Mobile teams: support seasonal/project needs
Municipal and enterprise channels
- Long-term contracts = stable volumes
- Enterprise teams = SLA-driven revenue
- Brokers/haulers = extended coverage
- Drop-off/events = community access, incremental income
Nationwide fleet: ~25M customers in 48 states + Canada; digital ops speed transactions ~60%
Nationwide fleet serves ~25M customers across 48 US states plus Canada, enabling urban/rural coverage and scalable multi-site accounts. Regional hubs, transfer stations and MRFs cut haul distances and raise recycling recovery (US municipal recycling ~32% in 2024). Digital portals/APIs accelerate transactions (~60% faster) and SLA compliance; on-site compactors/balers cut haul trips up to 70% and contamination ~50%.
| Metric | Value |
|---|---|
| Customers served | ~25M |
| Geography | 48 US states + Canada |
| US recycling rate (2024) | ~32% |
| Global MSW (2024) | ~2.2B tonnes |
| Faster transactions | ~60% |
| Haul trip reduction | up to 70% |
Preview the Actual Deliverable
Waste Management 4P's Marketing Mix Analysis
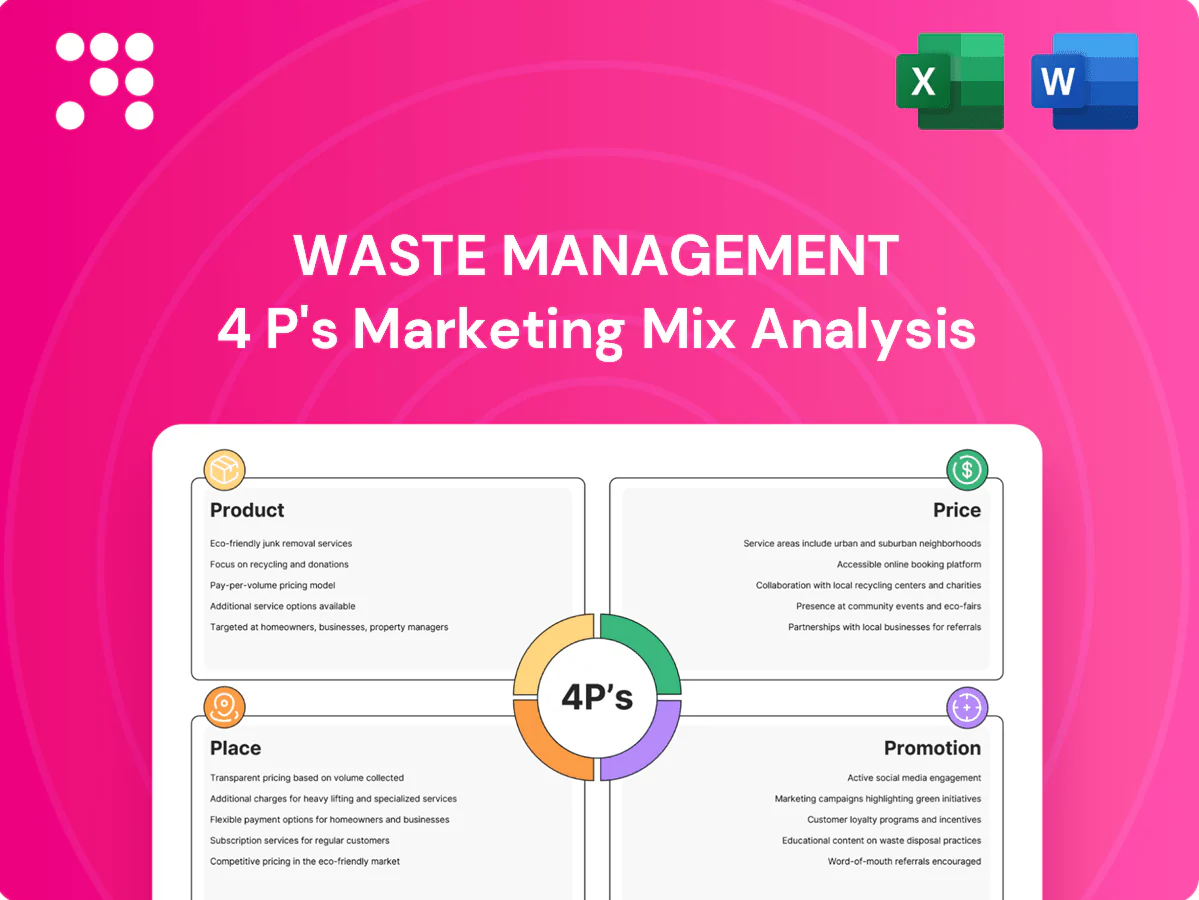
The preview shown here is the actual Waste Management 4P's Marketing Mix Analysis you'll receive instantly after purchase—no surprises. This comprehensive, editable document covers Product, Price, Place and Promotion in full. You're viewing the exact final file ready for immediate use.

Ready-Made Marketing Analysis, Ready to Use
Discover how Waste Management’s product offerings, pricing tiers, distribution networks, and promotional tactics combine to secure market leadership—this preview only scratches the surface. Purchase the full, editable 4Ps Marketing Mix Analysis for actionable insights, real-world data, and slide-ready content to save time and sharpen strategy.
Product
Integrated waste collection services
Integrated end-to-end pickup serves residential, commercial, industrial and municipal customers with container sizes and frequencies matched to demand; global MSW totaled about 2.24 billion tonnes in 2022 (World Bank) and the US generated 292.4 million tons in 2022 (EPA). Options include curbside, roll-off, compactors and specialty streams; service reliability, safety and route optimization drive measurable efficiency, while add-ons like contamination audits and extra pickups increase flexibility.
Recycling and materials recovery
Single-stream and source-separated recycling routed through modern MRFs commonly yield 75–90% recovery, maximizing diversion. Active commodity marketing for paper, plastics, metals and OCC captures the bulk of material revenue and circular value. Contamination-reduction programs measurably boost yield and lower customer disposal costs. Reporting dashboards present diversion rates and environmental impact metrics (tons diverted, GHG savings).
Landfill and disposal operations
Engineered landfills with liners, leachate collection and gas controls dominate new permits and handle large volumes—US landfills received about 146.1 million tons MSW (EPA, 2023) ensuring safe, compliant disposal. Transfer stations and logistics optimize haul distance and capacity to cut trucking costs. Specialized handling for industrial and C&D waste boosts throughput and recovery rates. Robust post-closure care and compliance management secure long-term stewardship.
Renewable energy from landfill gas
Landfill gas-to-energy projects capture methane and convert it to electricity or renewable natural gas, with the EPA LMOP reporting 526 operational projects in the U.S. that support corporate ESG targets and generate renewable energy credits. Co-development can provide onsite energy or grid supply, and revenue is monetized via PPAs and market mechanisms including RINs, LCFS credits, and utility partnerships.
- 526 operational LFG projects (EPA LMOP)
- Revenue: PPAs, RINs, LCFS, utility agreements
- Use cases: onsite power, RNG injection to grid
Sustainability consulting and services
Sustainability consulting offers waste audits that typically reveal 10–30% cost savings, zero-waste roadmaps and circularity strategies converting up to 30% of waste streams into revenue; compliance guidance supports ESG/CSRD reporting (CSRD covers ~50,000 firms by 2026). Custom organics, reuse and take-back programs plus training drive measurable behavior change and diversion gains.
- Waste audits: 10–30% cost reduction
- Organics: ~30% of MSW
- CSRD: ~50,000 firms by 2026
- Training: measurable diversion & ROI
Waste value chain: global MSW 2.24B t, US 292.4M t — recycling 75–90%, 526 LFG projects
Integrated services span curbside to industrial; global MSW 2.24B t (2022), US 292.4M t (2022). Recycling via MRFs yields 75–90% recovery; US landfills received 146.1M t (2023). 526 LFG projects (EPA LMOP) generate PPAs/RINs/LCFS revenue; waste audits reduce costs 10–30% and CSRD impacts ~50,000 firms by 2026.
| Metric | Value | Source |
|---|---|---|
| Global MSW | 2.24B t (2022) | World Bank |
| US MSW | 292.4M t (2022) | EPA |
| US landfill | 146.1M t (2023) | EPA |
| LFG projects | 526 | EPA LMOP |
| Recycling yield | 75–90% | MRF data |
| Audit savings | 10–30% | Industry studies |
What is included in the product
Detailed Word Document
Delivers a concise, company-specific deep dive into Waste Management’s Product, Price, Place, and Promotion strategies, using actual brand practices and market context to inform actionable positioning and competitive implications—ideal for managers, consultants, and marketers.
Customizable Excel Spreadsheet
Condenses Waste Management’s 4Ps into a concise, customizable one‑pager that relieves briefing fatigue, speeds leadership alignment, and helps non‑marketing stakeholders quickly grasp strategic positioning for meetings or decks.
Place
Nationwide collection network
Nationwide collection network leverages a large fleet to serve about 25 million customers across 48 US states and Canada, enabling consistent urban and rural service. Dynamic routing and regional hubs cut transit time and lower costs, improving route efficiency for thousands of accounts. Local operations teams align with municipal and enterprise requirements, and scalability supports multi-site national accounts spanning thousands of locations.
Transfer stations and MRF footprint
Strategic transfer stations consolidate loads and can cut haul distances, improving cost per ton and fleet utilization; industry practice shows centralized hubs reduce transport miles by double-digit percentages. MRFs expand recycling access and commodities recovery, supporting a US municipal recycling rate near 32%. Proximity to landfills shortens turnaround and aids capacity planning, while site redundancy bolsters resilience during peak volumes or disruptions.
Digital portals and APIs
Self-service portals handle ordering, scheduling, billing and reporting, reducing administrative calls and accelerating service requests; adopters report up to 60% faster transaction workflows. APIs integrate with ERP/CMMS for automated work orders and seamless data flow, aligning with the 2024 MuleSoft benchmark where 89% of IT leaders call APIs critical. Real-time alerts and service confirmations boost transparency and SLA adherence, while diversion dashboards centralize ESG metrics for stakeholders and simplify regulatory reporting.
On-site customer solutions
On-site customer solutions place embedded containers, compactors and balers at facilities with right-sized equipment and pickup cadences aligned to generation patterns, reducing haul trips by up to 70% and lowering transportation costs; onsite training cuts contamination and safety incidents by as much as 50%, while mobile response teams scale for seasonal or project-based surges in volume.
- Embedded equipment: compactors, balers, containers
- Right-sizing: cadence matches generation patterns
- Training: reduces contamination & safety risks (~50%)
- Mobile teams: support seasonal/project needs
Municipal and enterprise channels
- Long-term contracts = stable volumes
- Enterprise teams = SLA-driven revenue
- Brokers/haulers = extended coverage
- Drop-off/events = community access, incremental income
Nationwide fleet: ~25M customers in 48 states + Canada; digital ops speed transactions ~60%
Nationwide fleet serves ~25M customers across 48 US states plus Canada, enabling urban/rural coverage and scalable multi-site accounts. Regional hubs, transfer stations and MRFs cut haul distances and raise recycling recovery (US municipal recycling ~32% in 2024). Digital portals/APIs accelerate transactions (~60% faster) and SLA compliance; on-site compactors/balers cut haul trips up to 70% and contamination ~50%.
| Metric | Value |
|---|---|
| Customers served | ~25M |
| Geography | 48 US states + Canada |
| US recycling rate (2024) | ~32% |
| Global MSW (2024) | ~2.2B tonnes |
| Faster transactions | ~60% |
| Haul trip reduction | up to 70% |
Preview the Actual Deliverable
Waste Management 4P's Marketing Mix Analysis
The preview shown here is the actual Waste Management 4P's Marketing Mix Analysis you'll receive instantly after purchase—no surprises. This comprehensive, editable document covers Product, Price, Place and Promotion in full. You're viewing the exact final file ready for immediate use.
Original: $10.00
-65%$10.00
$3.50Description
Ready-Made Marketing Analysis, Ready to Use
Discover how Waste Management’s product offerings, pricing tiers, distribution networks, and promotional tactics combine to secure market leadership—this preview only scratches the surface. Purchase the full, editable 4Ps Marketing Mix Analysis for actionable insights, real-world data, and slide-ready content to save time and sharpen strategy.
Product
Integrated waste collection services
Integrated end-to-end pickup serves residential, commercial, industrial and municipal customers with container sizes and frequencies matched to demand; global MSW totaled about 2.24 billion tonnes in 2022 (World Bank) and the US generated 292.4 million tons in 2022 (EPA). Options include curbside, roll-off, compactors and specialty streams; service reliability, safety and route optimization drive measurable efficiency, while add-ons like contamination audits and extra pickups increase flexibility.
Recycling and materials recovery
Single-stream and source-separated recycling routed through modern MRFs commonly yield 75–90% recovery, maximizing diversion. Active commodity marketing for paper, plastics, metals and OCC captures the bulk of material revenue and circular value. Contamination-reduction programs measurably boost yield and lower customer disposal costs. Reporting dashboards present diversion rates and environmental impact metrics (tons diverted, GHG savings).
Landfill and disposal operations
Engineered landfills with liners, leachate collection and gas controls dominate new permits and handle large volumes—US landfills received about 146.1 million tons MSW (EPA, 2023) ensuring safe, compliant disposal. Transfer stations and logistics optimize haul distance and capacity to cut trucking costs. Specialized handling for industrial and C&D waste boosts throughput and recovery rates. Robust post-closure care and compliance management secure long-term stewardship.
Renewable energy from landfill gas
Landfill gas-to-energy projects capture methane and convert it to electricity or renewable natural gas, with the EPA LMOP reporting 526 operational projects in the U.S. that support corporate ESG targets and generate renewable energy credits. Co-development can provide onsite energy or grid supply, and revenue is monetized via PPAs and market mechanisms including RINs, LCFS credits, and utility partnerships.
- 526 operational LFG projects (EPA LMOP)
- Revenue: PPAs, RINs, LCFS, utility agreements
- Use cases: onsite power, RNG injection to grid
Sustainability consulting and services
Sustainability consulting offers waste audits that typically reveal 10–30% cost savings, zero-waste roadmaps and circularity strategies converting up to 30% of waste streams into revenue; compliance guidance supports ESG/CSRD reporting (CSRD covers ~50,000 firms by 2026). Custom organics, reuse and take-back programs plus training drive measurable behavior change and diversion gains.
- Waste audits: 10–30% cost reduction
- Organics: ~30% of MSW
- CSRD: ~50,000 firms by 2026
- Training: measurable diversion & ROI
Waste value chain: global MSW 2.24B t, US 292.4M t — recycling 75–90%, 526 LFG projects
Integrated services span curbside to industrial; global MSW 2.24B t (2022), US 292.4M t (2022). Recycling via MRFs yields 75–90% recovery; US landfills received 146.1M t (2023). 526 LFG projects (EPA LMOP) generate PPAs/RINs/LCFS revenue; waste audits reduce costs 10–30% and CSRD impacts ~50,000 firms by 2026.
| Metric | Value | Source |
|---|---|---|
| Global MSW | 2.24B t (2022) | World Bank |
| US MSW | 292.4M t (2022) | EPA |
| US landfill | 146.1M t (2023) | EPA |
| LFG projects | 526 | EPA LMOP |
| Recycling yield | 75–90% | MRF data |
| Audit savings | 10–30% | Industry studies |
What is included in the product
Detailed Word Document
Delivers a concise, company-specific deep dive into Waste Management’s Product, Price, Place, and Promotion strategies, using actual brand practices and market context to inform actionable positioning and competitive implications—ideal for managers, consultants, and marketers.
Customizable Excel Spreadsheet
Condenses Waste Management’s 4Ps into a concise, customizable one‑pager that relieves briefing fatigue, speeds leadership alignment, and helps non‑marketing stakeholders quickly grasp strategic positioning for meetings or decks.
Place
Nationwide collection network
Nationwide collection network leverages a large fleet to serve about 25 million customers across 48 US states and Canada, enabling consistent urban and rural service. Dynamic routing and regional hubs cut transit time and lower costs, improving route efficiency for thousands of accounts. Local operations teams align with municipal and enterprise requirements, and scalability supports multi-site national accounts spanning thousands of locations.
Transfer stations and MRF footprint
Strategic transfer stations consolidate loads and can cut haul distances, improving cost per ton and fleet utilization; industry practice shows centralized hubs reduce transport miles by double-digit percentages. MRFs expand recycling access and commodities recovery, supporting a US municipal recycling rate near 32%. Proximity to landfills shortens turnaround and aids capacity planning, while site redundancy bolsters resilience during peak volumes or disruptions.
Digital portals and APIs
Self-service portals handle ordering, scheduling, billing and reporting, reducing administrative calls and accelerating service requests; adopters report up to 60% faster transaction workflows. APIs integrate with ERP/CMMS for automated work orders and seamless data flow, aligning with the 2024 MuleSoft benchmark where 89% of IT leaders call APIs critical. Real-time alerts and service confirmations boost transparency and SLA adherence, while diversion dashboards centralize ESG metrics for stakeholders and simplify regulatory reporting.
On-site customer solutions
On-site customer solutions place embedded containers, compactors and balers at facilities with right-sized equipment and pickup cadences aligned to generation patterns, reducing haul trips by up to 70% and lowering transportation costs; onsite training cuts contamination and safety incidents by as much as 50%, while mobile response teams scale for seasonal or project-based surges in volume.
- Embedded equipment: compactors, balers, containers
- Right-sizing: cadence matches generation patterns
- Training: reduces contamination & safety risks (~50%)
- Mobile teams: support seasonal/project needs
Municipal and enterprise channels
- Long-term contracts = stable volumes
- Enterprise teams = SLA-driven revenue
- Brokers/haulers = extended coverage
- Drop-off/events = community access, incremental income
Nationwide fleet: ~25M customers in 48 states + Canada; digital ops speed transactions ~60%
Nationwide fleet serves ~25M customers across 48 US states plus Canada, enabling urban/rural coverage and scalable multi-site accounts. Regional hubs, transfer stations and MRFs cut haul distances and raise recycling recovery (US municipal recycling ~32% in 2024). Digital portals/APIs accelerate transactions (~60% faster) and SLA compliance; on-site compactors/balers cut haul trips up to 70% and contamination ~50%.
| Metric | Value |
|---|---|
| Customers served | ~25M |
| Geography | 48 US states + Canada |
| US recycling rate (2024) | ~32% |
| Global MSW (2024) | ~2.2B tonnes |
| Faster transactions | ~60% |
| Haul trip reduction | up to 70% |
Preview the Actual Deliverable
Waste Management 4P's Marketing Mix Analysis
The preview shown here is the actual Waste Management 4P's Marketing Mix Analysis you'll receive instantly after purchase—no surprises. This comprehensive, editable document covers Product, Price, Place and Promotion in full. You're viewing the exact final file ready for immediate use.











