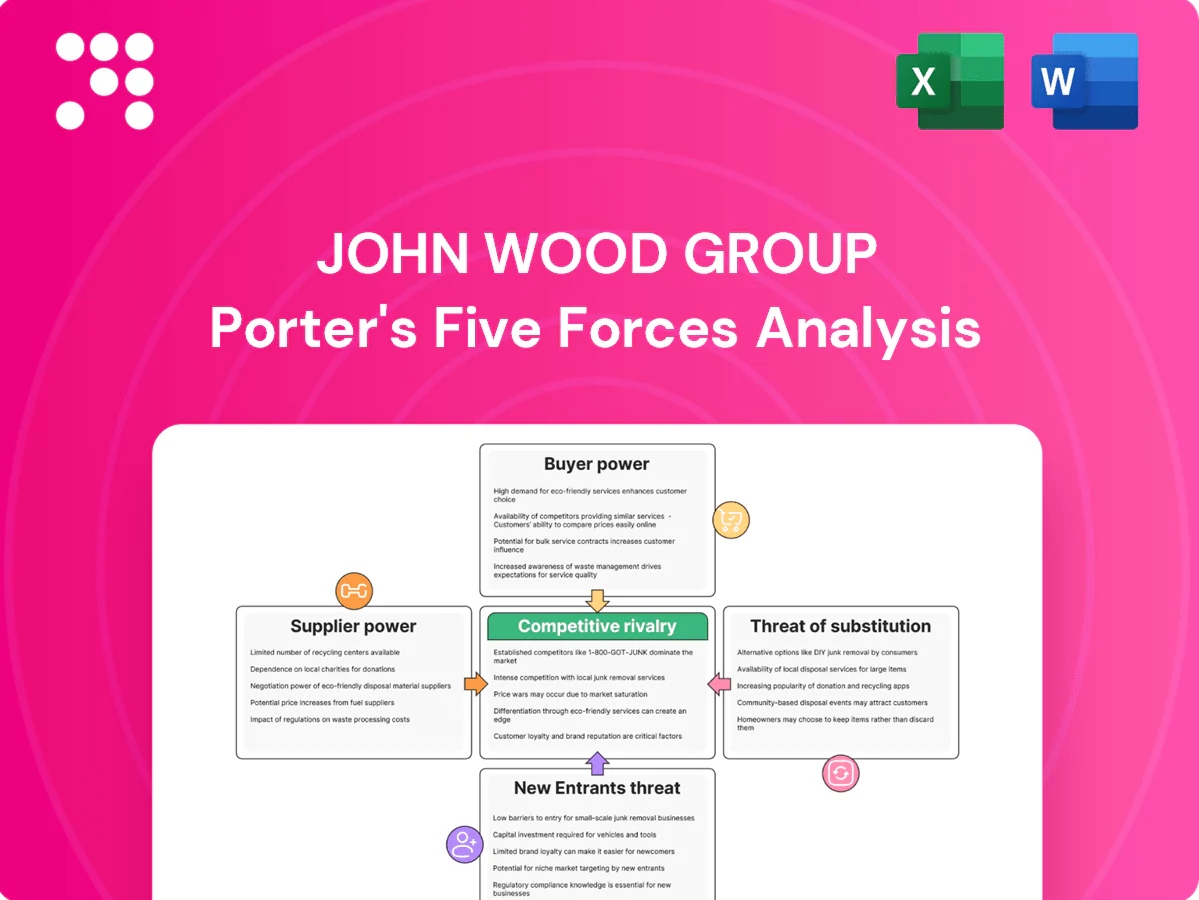
John Wood Group Porter's Five Forces Analysis

A Must-Have Tool for Decision-Makers
John Wood Group faces moderate supplier power, project-driven buyer bargaining and cyclical demand that heighten rivalry across oilfield services and energy transition segments; threat of new entrants is limited by scale and technical barriers while substitutes pressure rises with renewables. This snapshot highlights key tensions and strategic levers. Unlock the full Porter's Five Forces Analysis for detailed ratings, visuals, and actionable insights to inform investment or strategy.
Suppliers Bargaining Power

Specialized talent scarcity
Wood relies on highly skilled engineers, project managers and domain experts whose supply is constrained in energy and low-carbon niches, with Wood reporting roughly 35,000 employees in 2024 and a rising share in low‑carbon roles. Tight labor markets and certification requirements drove wage inflation and higher retention costs, especially when multiple mega‑projects peak concurrently, increasing supplier power; offshoring and graduate pipelines mitigate but do not remove scarcity.
Critical software and data vendors
Dependence on licensed design, simulation and digital twin platforms concentrates power with a handful of vendors—2024 industry reports estimate the top suppliers control ~70% of the market. Switching tools mid-project is costly and risky, often leading to schedule slips and integration costs. Bundled ecosystems and data lock-in further elevate switching costs. Volume discounts and enterprise agreements can cut effective license costs by 15–30%.

OEM equipment and technology licensors
Process technology owners and OEMs for turbines, compressors, CCUS and hydrogen units are concentrated—typically three to five major licensors dominate project bids—raising supplier leverage. Project specs often reference specific licensors, limiting alternatives and increasing switching costs. Large turbomachinery lead times rose to about 18–30 months in 2023–24, while delivery schedules and warranty terms strengthen supplier negotiation power. Early engagement and multi-sourcing can materially rebalance terms and reduce procurement risk.

Specialist subcontractors and local content
Construction, inspection and niche services for Wood face local content and permitting limits that concentrate supplier leverage; 2024 industry reports indicate regional subcontractor premiums commonly rise 10–25% where scarcity or regulation binds. Performance-risk transfer via warranties and insurances drives higher margins and premiums, while frameworks and prequalified panels (reducing bid variability) cut exposure and contracting cost volatility.
- Regional scarcity: 10–25% premium (2024 industry reports)
- Performance-risk transfer: higher insurance/premium pressure
- Frameworks/prequalified panels: lower exposure and bidding cost
Sustainability and materials volatility
Low-carbon materials and specialty steels face supply bottlenecks and price swings, with low-carbon premiums reaching up to 20% in 2024, raising costs for John Wood Group projects. Suppliers can pass through costs via lump-sum or hybrid contracts, while certification for sustainable inputs adds compliance and administrative burden. Hedging and index-linked contracts have been used to moderate volatility and protect margins.
- Supply tightness: low-carbon premium ~20% (2024)
- Contract risk: lump-sum vs hybrid cost pass-through
- Compliance: certification increases CAPEX/OPEX
- Mitigation: hedging/index-linked contracts
High supplier power: 35,000 skilled staff, ~70% software control, 18–30mo turbine lead times
Supplier power is high: skilled labor tightness (35,000 employees, rising low‑carbon roles) and regional premiums (10–25%) raise costs; software vendors control ~70% market and raise switching costs; turbomachinery lead times 18–30 months increase leverage; low‑carbon material premiums ~20% with 15–30% license discounts available.
| Metric | 2023–24 |
|---|---|
| Employees | ~35,000 |
| Software share | ~70% |
| Turbine lead time | 18–30 months |
| Regional premium | 10–25% |
| Low‑carbon premium | ~20% |
| License discounts | 15–30% |
What is included in the product
 Detailed Word Document
Tailored Porter's Five Forces analysis for John Wood Group, uncovering key drivers of competition, customer bargaining power, supplier influence, and threat of new entrants and substitutes. Highlights disruptive forces and market dynamics that affect pricing, profitability, and strategic positioning to inform investor materials and internal strategy.

 Customizable Excel Spreadsheet
A clear, one-sheet Porter's Five Forces snapshot for John Wood Group—perfect for quick decision-making and boardroom use; swap in your own data or duplicate tabs for different market scenarios without macros.
Customers Bargaining Power

Concentrated blue-chip clients
Concentrated blue-chip clients—IOCs, NOCs, utilities and majors in chemicals/mining—drive the majority of John Wood Group’s addressable spend and run competitive tenders. Their scale and procurement rigor, with combined capex among top oil majors exceeding $200bn in 2024, gives them significant pricing leverage. Buyers push for global consistency via rate cards and rebates, compressing margins on commoditized services. Strategic accounts still pay premiums for differentiated technical and project delivery expertise.
Competitive bidding and framework deals
Multi-year frameworks often compress margins by 100–300 basis points through pre-agreed rates and KPIs, with competitive rebids driving average price pressure of 5–15% year-on-year in 2024. Mini-tenders within frameworks expand buyer choice by adding 2–5 compliant vendors per lot, while demonstrable past delivery can boost call-off volumes and scope by 20–40% on subsequent renewals.

Switching costs are project-phase dependent
During early design clients can switch providers with relative ease, while later engineering, procurement and construction phases create higher lock-in as bespoke assets and integrations accumulate. Clear documentation and client-held data rights materially reduce stickiness and facilitate exit. Outcome-based models increasingly shift leverage to clients demanding performance guarantees. Deep integration with client systems and controls raises tangible exit barriers.

ESG and decarbonization expectations
Major clients in 2024 demanded measurable emissions reductions and local‑content outcomes; failure to meet ESG KPIs risks fee reductions or loss of scope. Buyers increasingly use sustainability scoring to renegotiate commercial terms. Providers with proven low‑carbon track records command premiums but face strict accountability.
- 2024: ESG KPIs tied to fees
- sustainability scoring drives terms
- low‑carbon track record = premium + accountability
Risk allocation and payment terms
In 2024 clients pressed for tighter SLAs, liquidated damages and extended payment cycles, raising working-capital strain on Wood; under lump-sum EPC increased risk transfer boosts buyer price leverage, while reimbursable models see rigorous scrutiny of rates and utilization; balanced risk-sharing remains critical to defend margins.
- Typical LDs: 1–5% of contract value
- Payment cycles seen: 60–120 days
- Buyer price leverage: 3–8% negotiation pressure
- Key defense: balanced risk-sharing and clear rate clauses
Majors capex >$200bn drives 5-15% price squeeze, 100-300bps margin hit
Large blue‑chip clients (IOCs/NOCs/utilities) wield strong pricing power—top oil majors capex >$200bn in 2024—driving 5–15% price pressure and 100–300bps margin compression on frameworks. ESG KPIs tied to fees and sustainability scoring shift leverage to buyers; LDs (1–5%) and 60–120 day payments increase working‑capital strain.
| Metric | 2024 | Impact |
|---|---|---|
| Majors capex | >$200bn | Higher buyer leverage |
| Price pressure | 5–15% | Revenue down |
| Margin hit | 100–300bps | Profitability squeeze |
Preview Before You Purchase
John Wood Group Porter's Five Forces Analysis
This preview shows the exact John Wood Group Porter's Five Forces analysis you'll receive immediately after purchase—no placeholders or mockups. The document displayed is the professionally written, fully formatted file ready for download and use the moment you buy. You're viewing the same final deliverable available to you instantly after payment.

A Must-Have Tool for Decision-Makers
John Wood Group faces moderate supplier power, project-driven buyer bargaining and cyclical demand that heighten rivalry across oilfield services and energy transition segments; threat of new entrants is limited by scale and technical barriers while substitutes pressure rises with renewables. This snapshot highlights key tensions and strategic levers. Unlock the full Porter's Five Forces Analysis for detailed ratings, visuals, and actionable insights to inform investment or strategy.
Suppliers Bargaining Power
Specialized talent scarcity
Wood relies on highly skilled engineers, project managers and domain experts whose supply is constrained in energy and low-carbon niches, with Wood reporting roughly 35,000 employees in 2024 and a rising share in low‑carbon roles. Tight labor markets and certification requirements drove wage inflation and higher retention costs, especially when multiple mega‑projects peak concurrently, increasing supplier power; offshoring and graduate pipelines mitigate but do not remove scarcity.
Critical software and data vendors
Dependence on licensed design, simulation and digital twin platforms concentrates power with a handful of vendors—2024 industry reports estimate the top suppliers control ~70% of the market. Switching tools mid-project is costly and risky, often leading to schedule slips and integration costs. Bundled ecosystems and data lock-in further elevate switching costs. Volume discounts and enterprise agreements can cut effective license costs by 15–30%.
OEM equipment and technology licensors
Process technology owners and OEMs for turbines, compressors, CCUS and hydrogen units are concentrated—typically three to five major licensors dominate project bids—raising supplier leverage. Project specs often reference specific licensors, limiting alternatives and increasing switching costs. Large turbomachinery lead times rose to about 18–30 months in 2023–24, while delivery schedules and warranty terms strengthen supplier negotiation power. Early engagement and multi-sourcing can materially rebalance terms and reduce procurement risk.
Specialist subcontractors and local content
Construction, inspection and niche services for Wood face local content and permitting limits that concentrate supplier leverage; 2024 industry reports indicate regional subcontractor premiums commonly rise 10–25% where scarcity or regulation binds. Performance-risk transfer via warranties and insurances drives higher margins and premiums, while frameworks and prequalified panels (reducing bid variability) cut exposure and contracting cost volatility.
- Regional scarcity: 10–25% premium (2024 industry reports)
- Performance-risk transfer: higher insurance/premium pressure
- Frameworks/prequalified panels: lower exposure and bidding cost
Sustainability and materials volatility
Low-carbon materials and specialty steels face supply bottlenecks and price swings, with low-carbon premiums reaching up to 20% in 2024, raising costs for John Wood Group projects. Suppliers can pass through costs via lump-sum or hybrid contracts, while certification for sustainable inputs adds compliance and administrative burden. Hedging and index-linked contracts have been used to moderate volatility and protect margins.
- Supply tightness: low-carbon premium ~20% (2024)
- Contract risk: lump-sum vs hybrid cost pass-through
- Compliance: certification increases CAPEX/OPEX
- Mitigation: hedging/index-linked contracts
High supplier power: 35,000 skilled staff, ~70% software control, 18–30mo turbine lead times
Supplier power is high: skilled labor tightness (35,000 employees, rising low‑carbon roles) and regional premiums (10–25%) raise costs; software vendors control ~70% market and raise switching costs; turbomachinery lead times 18–30 months increase leverage; low‑carbon material premiums ~20% with 15–30% license discounts available.
| Metric | 2023–24 |
|---|---|
| Employees | ~35,000 |
| Software share | ~70% |
| Turbine lead time | 18–30 months |
| Regional premium | 10–25% |
| Low‑carbon premium | ~20% |
| License discounts | 15–30% |
What is included in the product
Detailed Word Document
Tailored Porter's Five Forces analysis for John Wood Group, uncovering key drivers of competition, customer bargaining power, supplier influence, and threat of new entrants and substitutes. Highlights disruptive forces and market dynamics that affect pricing, profitability, and strategic positioning to inform investor materials and internal strategy.
Customizable Excel Spreadsheet
A clear, one-sheet Porter's Five Forces snapshot for John Wood Group—perfect for quick decision-making and boardroom use; swap in your own data or duplicate tabs for different market scenarios without macros.
Customers Bargaining Power
Concentrated blue-chip clients
Concentrated blue-chip clients—IOCs, NOCs, utilities and majors in chemicals/mining—drive the majority of John Wood Group’s addressable spend and run competitive tenders. Their scale and procurement rigor, with combined capex among top oil majors exceeding $200bn in 2024, gives them significant pricing leverage. Buyers push for global consistency via rate cards and rebates, compressing margins on commoditized services. Strategic accounts still pay premiums for differentiated technical and project delivery expertise.
Competitive bidding and framework deals
Multi-year frameworks often compress margins by 100–300 basis points through pre-agreed rates and KPIs, with competitive rebids driving average price pressure of 5–15% year-on-year in 2024. Mini-tenders within frameworks expand buyer choice by adding 2–5 compliant vendors per lot, while demonstrable past delivery can boost call-off volumes and scope by 20–40% on subsequent renewals.
Switching costs are project-phase dependent
During early design clients can switch providers with relative ease, while later engineering, procurement and construction phases create higher lock-in as bespoke assets and integrations accumulate. Clear documentation and client-held data rights materially reduce stickiness and facilitate exit. Outcome-based models increasingly shift leverage to clients demanding performance guarantees. Deep integration with client systems and controls raises tangible exit barriers.
ESG and decarbonization expectations
Major clients in 2024 demanded measurable emissions reductions and local‑content outcomes; failure to meet ESG KPIs risks fee reductions or loss of scope. Buyers increasingly use sustainability scoring to renegotiate commercial terms. Providers with proven low‑carbon track records command premiums but face strict accountability.
- 2024: ESG KPIs tied to fees
- sustainability scoring drives terms
- low‑carbon track record = premium + accountability
Risk allocation and payment terms
In 2024 clients pressed for tighter SLAs, liquidated damages and extended payment cycles, raising working-capital strain on Wood; under lump-sum EPC increased risk transfer boosts buyer price leverage, while reimbursable models see rigorous scrutiny of rates and utilization; balanced risk-sharing remains critical to defend margins.
- Typical LDs: 1–5% of contract value
- Payment cycles seen: 60–120 days
- Buyer price leverage: 3–8% negotiation pressure
- Key defense: balanced risk-sharing and clear rate clauses
Majors capex >$200bn drives 5-15% price squeeze, 100-300bps margin hit
Large blue‑chip clients (IOCs/NOCs/utilities) wield strong pricing power—top oil majors capex >$200bn in 2024—driving 5–15% price pressure and 100–300bps margin compression on frameworks. ESG KPIs tied to fees and sustainability scoring shift leverage to buyers; LDs (1–5%) and 60–120 day payments increase working‑capital strain.
| Metric | 2024 | Impact |
|---|---|---|
| Majors capex | >$200bn | Higher buyer leverage |
| Price pressure | 5–15% | Revenue down |
| Margin hit | 100–300bps | Profitability squeeze |
Preview Before You Purchase
John Wood Group Porter's Five Forces Analysis
This preview shows the exact John Wood Group Porter's Five Forces analysis you'll receive immediately after purchase—no placeholders or mockups. The document displayed is the professionally written, fully formatted file ready for download and use the moment you buy. You're viewing the same final deliverable available to you instantly after payment.
Original: $10.00
-65%$10.00
$3.50Description
A Must-Have Tool for Decision-Makers
John Wood Group faces moderate supplier power, project-driven buyer bargaining and cyclical demand that heighten rivalry across oilfield services and energy transition segments; threat of new entrants is limited by scale and technical barriers while substitutes pressure rises with renewables. This snapshot highlights key tensions and strategic levers. Unlock the full Porter's Five Forces Analysis for detailed ratings, visuals, and actionable insights to inform investment or strategy.
Suppliers Bargaining Power
Specialized talent scarcity
Wood relies on highly skilled engineers, project managers and domain experts whose supply is constrained in energy and low-carbon niches, with Wood reporting roughly 35,000 employees in 2024 and a rising share in low‑carbon roles. Tight labor markets and certification requirements drove wage inflation and higher retention costs, especially when multiple mega‑projects peak concurrently, increasing supplier power; offshoring and graduate pipelines mitigate but do not remove scarcity.
Critical software and data vendors
Dependence on licensed design, simulation and digital twin platforms concentrates power with a handful of vendors—2024 industry reports estimate the top suppliers control ~70% of the market. Switching tools mid-project is costly and risky, often leading to schedule slips and integration costs. Bundled ecosystems and data lock-in further elevate switching costs. Volume discounts and enterprise agreements can cut effective license costs by 15–30%.
OEM equipment and technology licensors
Process technology owners and OEMs for turbines, compressors, CCUS and hydrogen units are concentrated—typically three to five major licensors dominate project bids—raising supplier leverage. Project specs often reference specific licensors, limiting alternatives and increasing switching costs. Large turbomachinery lead times rose to about 18–30 months in 2023–24, while delivery schedules and warranty terms strengthen supplier negotiation power. Early engagement and multi-sourcing can materially rebalance terms and reduce procurement risk.
Specialist subcontractors and local content
Construction, inspection and niche services for Wood face local content and permitting limits that concentrate supplier leverage; 2024 industry reports indicate regional subcontractor premiums commonly rise 10–25% where scarcity or regulation binds. Performance-risk transfer via warranties and insurances drives higher margins and premiums, while frameworks and prequalified panels (reducing bid variability) cut exposure and contracting cost volatility.
- Regional scarcity: 10–25% premium (2024 industry reports)
- Performance-risk transfer: higher insurance/premium pressure
- Frameworks/prequalified panels: lower exposure and bidding cost
Sustainability and materials volatility
Low-carbon materials and specialty steels face supply bottlenecks and price swings, with low-carbon premiums reaching up to 20% in 2024, raising costs for John Wood Group projects. Suppliers can pass through costs via lump-sum or hybrid contracts, while certification for sustainable inputs adds compliance and administrative burden. Hedging and index-linked contracts have been used to moderate volatility and protect margins.
- Supply tightness: low-carbon premium ~20% (2024)
- Contract risk: lump-sum vs hybrid cost pass-through
- Compliance: certification increases CAPEX/OPEX
- Mitigation: hedging/index-linked contracts
High supplier power: 35,000 skilled staff, ~70% software control, 18–30mo turbine lead times
Supplier power is high: skilled labor tightness (35,000 employees, rising low‑carbon roles) and regional premiums (10–25%) raise costs; software vendors control ~70% market and raise switching costs; turbomachinery lead times 18–30 months increase leverage; low‑carbon material premiums ~20% with 15–30% license discounts available.
| Metric | 2023–24 |
|---|---|
| Employees | ~35,000 |
| Software share | ~70% |
| Turbine lead time | 18–30 months |
| Regional premium | 10–25% |
| Low‑carbon premium | ~20% |
| License discounts | 15–30% |
What is included in the product
Detailed Word Document
Tailored Porter's Five Forces analysis for John Wood Group, uncovering key drivers of competition, customer bargaining power, supplier influence, and threat of new entrants and substitutes. Highlights disruptive forces and market dynamics that affect pricing, profitability, and strategic positioning to inform investor materials and internal strategy.
Customizable Excel Spreadsheet
A clear, one-sheet Porter's Five Forces snapshot for John Wood Group—perfect for quick decision-making and boardroom use; swap in your own data or duplicate tabs for different market scenarios without macros.
Customers Bargaining Power
Concentrated blue-chip clients
Concentrated blue-chip clients—IOCs, NOCs, utilities and majors in chemicals/mining—drive the majority of John Wood Group’s addressable spend and run competitive tenders. Their scale and procurement rigor, with combined capex among top oil majors exceeding $200bn in 2024, gives them significant pricing leverage. Buyers push for global consistency via rate cards and rebates, compressing margins on commoditized services. Strategic accounts still pay premiums for differentiated technical and project delivery expertise.
Competitive bidding and framework deals
Multi-year frameworks often compress margins by 100–300 basis points through pre-agreed rates and KPIs, with competitive rebids driving average price pressure of 5–15% year-on-year in 2024. Mini-tenders within frameworks expand buyer choice by adding 2–5 compliant vendors per lot, while demonstrable past delivery can boost call-off volumes and scope by 20–40% on subsequent renewals.
Switching costs are project-phase dependent
During early design clients can switch providers with relative ease, while later engineering, procurement and construction phases create higher lock-in as bespoke assets and integrations accumulate. Clear documentation and client-held data rights materially reduce stickiness and facilitate exit. Outcome-based models increasingly shift leverage to clients demanding performance guarantees. Deep integration with client systems and controls raises tangible exit barriers.
ESG and decarbonization expectations
Major clients in 2024 demanded measurable emissions reductions and local‑content outcomes; failure to meet ESG KPIs risks fee reductions or loss of scope. Buyers increasingly use sustainability scoring to renegotiate commercial terms. Providers with proven low‑carbon track records command premiums but face strict accountability.
- 2024: ESG KPIs tied to fees
- sustainability scoring drives terms
- low‑carbon track record = premium + accountability
Risk allocation and payment terms
In 2024 clients pressed for tighter SLAs, liquidated damages and extended payment cycles, raising working-capital strain on Wood; under lump-sum EPC increased risk transfer boosts buyer price leverage, while reimbursable models see rigorous scrutiny of rates and utilization; balanced risk-sharing remains critical to defend margins.
- Typical LDs: 1–5% of contract value
- Payment cycles seen: 60–120 days
- Buyer price leverage: 3–8% negotiation pressure
- Key defense: balanced risk-sharing and clear rate clauses
Majors capex >$200bn drives 5-15% price squeeze, 100-300bps margin hit
Large blue‑chip clients (IOCs/NOCs/utilities) wield strong pricing power—top oil majors capex >$200bn in 2024—driving 5–15% price pressure and 100–300bps margin compression on frameworks. ESG KPIs tied to fees and sustainability scoring shift leverage to buyers; LDs (1–5%) and 60–120 day payments increase working‑capital strain.
| Metric | 2024 | Impact |
|---|---|---|
| Majors capex | >$200bn | Higher buyer leverage |
| Price pressure | 5–15% | Revenue down |
| Margin hit | 100–300bps | Profitability squeeze |
Preview Before You Purchase
John Wood Group Porter's Five Forces Analysis
This preview shows the exact John Wood Group Porter's Five Forces analysis you'll receive immediately after purchase—no placeholders or mockups. The document displayed is the professionally written, fully formatted file ready for download and use the moment you buy. You're viewing the same final deliverable available to you instantly after payment.











