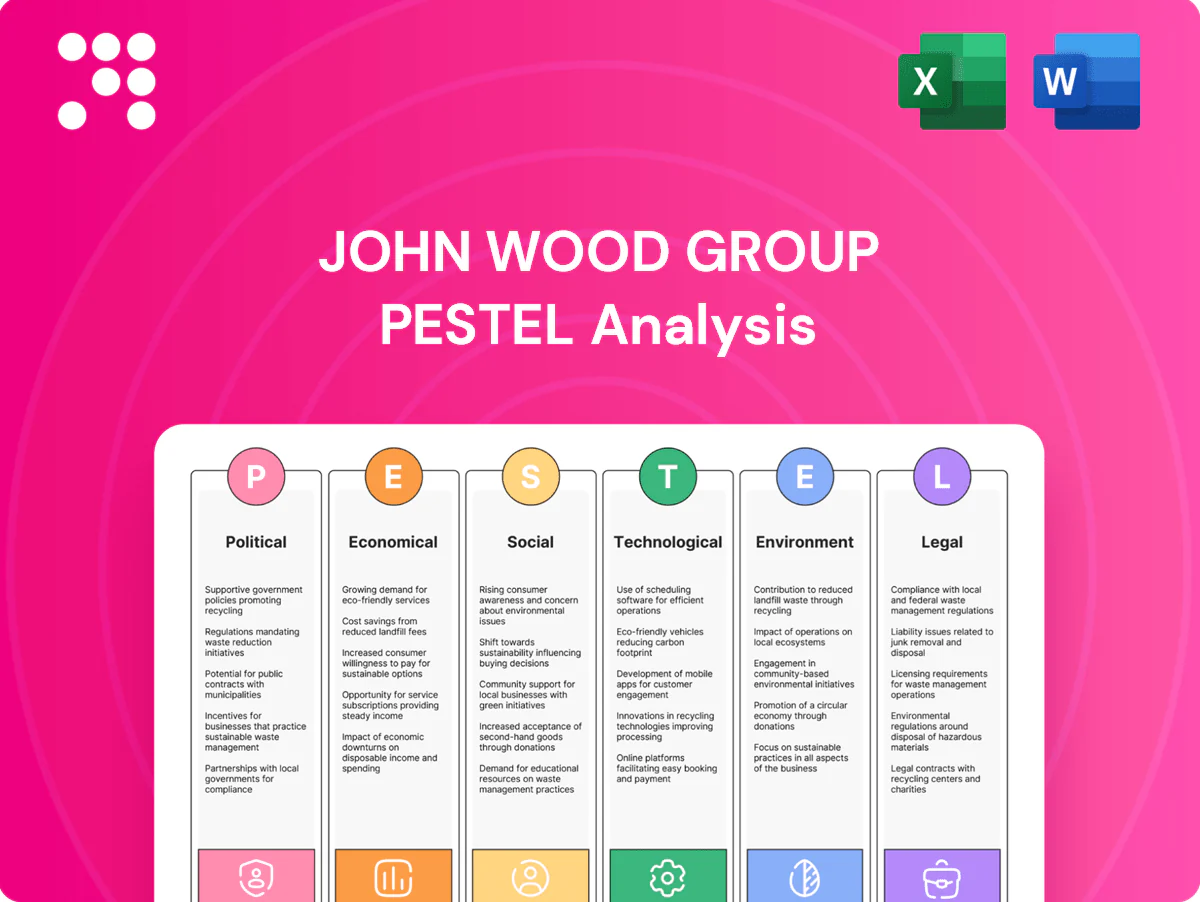
John Wood Group PESTLE Analysis

Plan Smarter. Present Sharper. Compete Stronger.
Discover how political shifts, economic cycles, social expectations, technological advances, legal changes, and environmental pressures are shaping John Wood Group’s strategy and risk profile. This PESTLE snapshot highlights the external forces investors and strategists must watch. Buy the full analysis for a complete, editable report with actionable insights and immediate download.
Political factors

Energy policy shifts and net-zero commitments
Government decarbonization targets such as the UK net-zero by 2050 and the US Inflation Reduction Act driving $369bn in clean energy incentives steer funding toward renewables, CCUS and hydrogen, reshaping Wood’s project mix. Sudden policy reversals or subsidy cuts can stall project pipelines and increase bid risk. Aligning proposals with national transition plans measurably improves win rates. Regional policy fragmentation raises delivery complexity and compliance costs.
Geopolitical risk and supply security
Conflicts and sanctions—illustrated by the EU cutting Russian gas imports by roughly 80% between 2021 and 2023—have disrupted energy trade flows and EPC logistics, pushing clients to reprioritize projects toward lower‑risk jurisdictions and shifting demand patterns. Wood must emphasize resiliency, localization and dual sourcing in project design and supply chains. Political risk insurance uptake and rigorous scenario planning are becoming essential risk‑management tools.

Permitting and local content requirements
Lengthy permitting can stall large-scale energy and materials projects, often adding 12–36 months to schedules in many jurisdictions. Local content rules commonly require 30–70% regional sourcing or hiring, pressuring margins and supply chains. Early stakeholder mapping reduces approval delays and rework. Robust compliance frameworks safeguard contract eligibility and access to incentives.

Public infrastructure and stimulus spending
Green industrial policies such as the US Inflation Reduction Act (≈$369bn) and NextGenerationEU (€723.8bn) are directing capital into grids, storage and low‑carbon fuels, creating scopes where Wood can capture engineering and programme‑management roles; budget cycles and elections create timing risk, while demonstrated cost control strengthens bids for public tenders.
- Policy funding: IRA $369bn, NextGenerationEU €723.8bn
- Opportunity: engineering & programme management
- Risk: timing from budget cycles/elections
- Competitive edge: proven cost control wins tenders
Trade policy, tariffs, and standards harmonization
Tariffs such as the US Section 232 25% steel duty (in place since 2018) and equipment/technology levies lift project input costs for Wood, squeezing margins on EPCI contracts; divergent technical codes (ASME, EN, ISO) force multi‑standard engineering teams and increase design complexity. Proactive specification management reduces costly rework, while strategic supplier agreements and long‑term purchase contracts hedge trade shocks and input-price volatility.
- Tariff: US Section 232 steel 25% (since 2018)
- Standards: ASME, EN, ISO — multi‑code competence required
- Mitigation: specification control lowers rework risk
- Hedge: strategic supplier/long‑term contracts reduce trade shock exposure
Green funds and supply shocks reshape projects: IRA $369bn, NextGenEU €723.8bn
Government decarbonization targets (UK net‑zero 2050), IRA $369bn and NextGenerationEU €723.8bn redirect capital to renewables, CCUS and hydrogen, boosting Wood’s project pipeline but exposing it to subsidy/policy timing risk. Geopolitical shocks (EU cut Russian gas ~80% 2021–23) and tariffs (US Section 232 steel 25%) raise input costs and delivery complexity; permitting delays (12–36 months) and 30–70% local‑content rules pressure margins.
| Factor | Metric | Impact |
|---|---|---|
| Green funding | IRA $369bn / NextGenEU €723.8bn | Project growth |
| Gas disruption | EU −80% Russian gas | Supply shifts |
| Permitting | 12–36 months | Schedule risk |
| Tariff | Steel 25% | Cost pressure |
What is included in the product
 Detailed Word Document
Explores how external macro-environmental factors uniquely affect the John Wood Group across Political, Economic, Social, Technological, Environmental and Legal dimensions; each section is data-backed, regionally and industry-specific, includes detailed subpoints and forward-looking insights to support executives, consultants and investors in scenario planning, risk mitigation and opportunity identification.

 Customizable Excel Spreadsheet
A concise, PESTLE-segmented summary of John Wood Group’s external risks and opportunities, ready to drop into presentations, share across teams, and support faster strategic alignment during planning and client engagements.
Economic factors

Commodity price cycles and client capex
Commodity cycles—Brent crude averaging about $85/bbl in 2024 and copper near $9,000/t—directly time upstream, midstream and materials capex, with higher prices unlocking brownfield debottlenecking and new builds. Downturns shift client spend toward OPEX, efficiency and life‑extension work; Wood plc’s diversified services mix helps capture both capex and higher-margin sustainment. A balanced portfolio smooths revenue volatility, reducing exposure to swings that can exceed ±20% annually.
Interest rates, financing costs, and project viability
Higher policy rates (10-year US Treasury ~4.2% and many corporate borrowing spreads elevated in mid‑2025) push required hurdle IRRs up, delaying FIDs on capital‑intensive Wood projects; strategic financing partnerships have shortened bankability timelines for several recent FPSO and hydrogen bids. Rigorous value engineering has lifted project NPVs by reducing capex and schedule risk, while any sustained rate cuts would likely revive deferred EPC and renewables pipelines.

Inflation and supply chain constraints
Input cost volatility strains Wood plc’s fixed-price contracts as UK CPI eased to about 3.9% in 2024 while global container rates fell roughly 60% from 2021 peaks, pressuring margins; indexation, hedging and collaborative contracting are used to reduce exposure. Early procurement and vendor diversification stabilize deliveries, and digital procurement platforms enhance spend visibility and supplier transparency.

Foreign exchange movements
Global delivery creates material currency mismatches between revenues billed in client currencies and costs incurred in local currencies, forcing Wood to rely on formal hedging policies and natural offsets from geographically balanced operations. FX volatility can erode margins on long-duration engineering and EPC contracts, making contract re-pricing and indexation critical. Pricing in client currency reduces disputes and shifts FX risk back to clients.
- FX exposure: revenues vs costs
- Mitigation: hedging policies, natural offsets
- Risk: margin erosion on long contracts
- Solution: price in client currency
Labor market tightness and productivity
Skilled engineering talent remains scarce in several regions, pressuring John Wood Group’s delivery as global headcount stands at about 40,000 employees (2024) and demand for niche engineers outpaces supply.
Wage inflation has eroded bid competitiveness, with contractor premiums and salary increases rising notably in 2023–24.
Investment in training, automation and global delivery centres has raised productivity and retention, cutting onboarding time and quality risks.
- skill-shortage: regional gaps
- wage-inflation: bid pressure
- productivity: training+automation
- retention: lower onboarding risk
Green funds and supply shocks reshape projects: IRA $369bn, NextGenEU €723.8bn
Commodity-driven capex swings (Brent ~$85/bbl; copper ~$9,000/t in 2024) cause ±20% revenue volatility; higher rates (10y US ~4.2% mid‑2025) delay FIDs while wage inflation and a 40,000 global headcount raise bid costs; procurement indexation, hedging and training/automation mitigate margin and delivery risk.
| Metric | 2024/2025 | Impact |
|---|---|---|
| Brent | $85/bbl | Drives capex |
| 10y US | ~4.2% | Raises hurdle rates |
| Headcount | ~40,000 | Wage pressure |
What You See Is What You Get
John Wood Group PESTLE Analysis
The John Wood Group PESTLE Analysis preview shown here is the exact document you’ll receive after purchase—fully formatted and ready to use. This is a real screenshot of the product you’re buying, delivered exactly as shown with no placeholders or surprises. The layout, content, and structure visible here are exactly what you’ll be able to download immediately after buying.

Plan Smarter. Present Sharper. Compete Stronger.
Discover how political shifts, economic cycles, social expectations, technological advances, legal changes, and environmental pressures are shaping John Wood Group’s strategy and risk profile. This PESTLE snapshot highlights the external forces investors and strategists must watch. Buy the full analysis for a complete, editable report with actionable insights and immediate download.
Political factors
Energy policy shifts and net-zero commitments
Government decarbonization targets such as the UK net-zero by 2050 and the US Inflation Reduction Act driving $369bn in clean energy incentives steer funding toward renewables, CCUS and hydrogen, reshaping Wood’s project mix. Sudden policy reversals or subsidy cuts can stall project pipelines and increase bid risk. Aligning proposals with national transition plans measurably improves win rates. Regional policy fragmentation raises delivery complexity and compliance costs.
Geopolitical risk and supply security
Conflicts and sanctions—illustrated by the EU cutting Russian gas imports by roughly 80% between 2021 and 2023—have disrupted energy trade flows and EPC logistics, pushing clients to reprioritize projects toward lower‑risk jurisdictions and shifting demand patterns. Wood must emphasize resiliency, localization and dual sourcing in project design and supply chains. Political risk insurance uptake and rigorous scenario planning are becoming essential risk‑management tools.
Permitting and local content requirements
Lengthy permitting can stall large-scale energy and materials projects, often adding 12–36 months to schedules in many jurisdictions. Local content rules commonly require 30–70% regional sourcing or hiring, pressuring margins and supply chains. Early stakeholder mapping reduces approval delays and rework. Robust compliance frameworks safeguard contract eligibility and access to incentives.
Public infrastructure and stimulus spending
Green industrial policies such as the US Inflation Reduction Act (≈$369bn) and NextGenerationEU (€723.8bn) are directing capital into grids, storage and low‑carbon fuels, creating scopes where Wood can capture engineering and programme‑management roles; budget cycles and elections create timing risk, while demonstrated cost control strengthens bids for public tenders.
- Policy funding: IRA $369bn, NextGenerationEU €723.8bn
- Opportunity: engineering & programme management
- Risk: timing from budget cycles/elections
- Competitive edge: proven cost control wins tenders
Trade policy, tariffs, and standards harmonization
Tariffs such as the US Section 232 25% steel duty (in place since 2018) and equipment/technology levies lift project input costs for Wood, squeezing margins on EPCI contracts; divergent technical codes (ASME, EN, ISO) force multi‑standard engineering teams and increase design complexity. Proactive specification management reduces costly rework, while strategic supplier agreements and long‑term purchase contracts hedge trade shocks and input-price volatility.
- Tariff: US Section 232 steel 25% (since 2018)
- Standards: ASME, EN, ISO — multi‑code competence required
- Mitigation: specification control lowers rework risk
- Hedge: strategic supplier/long‑term contracts reduce trade shock exposure
Green funds and supply shocks reshape projects: IRA $369bn, NextGenEU €723.8bn
Government decarbonization targets (UK net‑zero 2050), IRA $369bn and NextGenerationEU €723.8bn redirect capital to renewables, CCUS and hydrogen, boosting Wood’s project pipeline but exposing it to subsidy/policy timing risk. Geopolitical shocks (EU cut Russian gas ~80% 2021–23) and tariffs (US Section 232 steel 25%) raise input costs and delivery complexity; permitting delays (12–36 months) and 30–70% local‑content rules pressure margins.
| Factor | Metric | Impact |
|---|---|---|
| Green funding | IRA $369bn / NextGenEU €723.8bn | Project growth |
| Gas disruption | EU −80% Russian gas | Supply shifts |
| Permitting | 12–36 months | Schedule risk |
| Tariff | Steel 25% | Cost pressure |
What is included in the product
Detailed Word Document
Explores how external macro-environmental factors uniquely affect the John Wood Group across Political, Economic, Social, Technological, Environmental and Legal dimensions; each section is data-backed, regionally and industry-specific, includes detailed subpoints and forward-looking insights to support executives, consultants and investors in scenario planning, risk mitigation and opportunity identification.
Customizable Excel Spreadsheet
A concise, PESTLE-segmented summary of John Wood Group’s external risks and opportunities, ready to drop into presentations, share across teams, and support faster strategic alignment during planning and client engagements.
Economic factors
Commodity price cycles and client capex
Commodity cycles—Brent crude averaging about $85/bbl in 2024 and copper near $9,000/t—directly time upstream, midstream and materials capex, with higher prices unlocking brownfield debottlenecking and new builds. Downturns shift client spend toward OPEX, efficiency and life‑extension work; Wood plc’s diversified services mix helps capture both capex and higher-margin sustainment. A balanced portfolio smooths revenue volatility, reducing exposure to swings that can exceed ±20% annually.
Interest rates, financing costs, and project viability
Higher policy rates (10-year US Treasury ~4.2% and many corporate borrowing spreads elevated in mid‑2025) push required hurdle IRRs up, delaying FIDs on capital‑intensive Wood projects; strategic financing partnerships have shortened bankability timelines for several recent FPSO and hydrogen bids. Rigorous value engineering has lifted project NPVs by reducing capex and schedule risk, while any sustained rate cuts would likely revive deferred EPC and renewables pipelines.
Inflation and supply chain constraints
Input cost volatility strains Wood plc’s fixed-price contracts as UK CPI eased to about 3.9% in 2024 while global container rates fell roughly 60% from 2021 peaks, pressuring margins; indexation, hedging and collaborative contracting are used to reduce exposure. Early procurement and vendor diversification stabilize deliveries, and digital procurement platforms enhance spend visibility and supplier transparency.
Foreign exchange movements
Global delivery creates material currency mismatches between revenues billed in client currencies and costs incurred in local currencies, forcing Wood to rely on formal hedging policies and natural offsets from geographically balanced operations. FX volatility can erode margins on long-duration engineering and EPC contracts, making contract re-pricing and indexation critical. Pricing in client currency reduces disputes and shifts FX risk back to clients.
- FX exposure: revenues vs costs
- Mitigation: hedging policies, natural offsets
- Risk: margin erosion on long contracts
- Solution: price in client currency
Labor market tightness and productivity
Skilled engineering talent remains scarce in several regions, pressuring John Wood Group’s delivery as global headcount stands at about 40,000 employees (2024) and demand for niche engineers outpaces supply.
Wage inflation has eroded bid competitiveness, with contractor premiums and salary increases rising notably in 2023–24.
Investment in training, automation and global delivery centres has raised productivity and retention, cutting onboarding time and quality risks.
- skill-shortage: regional gaps
- wage-inflation: bid pressure
- productivity: training+automation
- retention: lower onboarding risk
Green funds and supply shocks reshape projects: IRA $369bn, NextGenEU €723.8bn
Commodity-driven capex swings (Brent ~$85/bbl; copper ~$9,000/t in 2024) cause ±20% revenue volatility; higher rates (10y US ~4.2% mid‑2025) delay FIDs while wage inflation and a 40,000 global headcount raise bid costs; procurement indexation, hedging and training/automation mitigate margin and delivery risk.
| Metric | 2024/2025 | Impact |
|---|---|---|
| Brent | $85/bbl | Drives capex |
| 10y US | ~4.2% | Raises hurdle rates |
| Headcount | ~40,000 | Wage pressure |
What You See Is What You Get
John Wood Group PESTLE Analysis
The John Wood Group PESTLE Analysis preview shown here is the exact document you’ll receive after purchase—fully formatted and ready to use. This is a real screenshot of the product you’re buying, delivered exactly as shown with no placeholders or surprises. The layout, content, and structure visible here are exactly what you’ll be able to download immediately after buying.
Original: $10.00
-65%$10.00
$3.50Description
Plan Smarter. Present Sharper. Compete Stronger.
Discover how political shifts, economic cycles, social expectations, technological advances, legal changes, and environmental pressures are shaping John Wood Group’s strategy and risk profile. This PESTLE snapshot highlights the external forces investors and strategists must watch. Buy the full analysis for a complete, editable report with actionable insights and immediate download.
Political factors
Energy policy shifts and net-zero commitments
Government decarbonization targets such as the UK net-zero by 2050 and the US Inflation Reduction Act driving $369bn in clean energy incentives steer funding toward renewables, CCUS and hydrogen, reshaping Wood’s project mix. Sudden policy reversals or subsidy cuts can stall project pipelines and increase bid risk. Aligning proposals with national transition plans measurably improves win rates. Regional policy fragmentation raises delivery complexity and compliance costs.
Geopolitical risk and supply security
Conflicts and sanctions—illustrated by the EU cutting Russian gas imports by roughly 80% between 2021 and 2023—have disrupted energy trade flows and EPC logistics, pushing clients to reprioritize projects toward lower‑risk jurisdictions and shifting demand patterns. Wood must emphasize resiliency, localization and dual sourcing in project design and supply chains. Political risk insurance uptake and rigorous scenario planning are becoming essential risk‑management tools.
Permitting and local content requirements
Lengthy permitting can stall large-scale energy and materials projects, often adding 12–36 months to schedules in many jurisdictions. Local content rules commonly require 30–70% regional sourcing or hiring, pressuring margins and supply chains. Early stakeholder mapping reduces approval delays and rework. Robust compliance frameworks safeguard contract eligibility and access to incentives.
Public infrastructure and stimulus spending
Green industrial policies such as the US Inflation Reduction Act (≈$369bn) and NextGenerationEU (€723.8bn) are directing capital into grids, storage and low‑carbon fuels, creating scopes where Wood can capture engineering and programme‑management roles; budget cycles and elections create timing risk, while demonstrated cost control strengthens bids for public tenders.
- Policy funding: IRA $369bn, NextGenerationEU €723.8bn
- Opportunity: engineering & programme management
- Risk: timing from budget cycles/elections
- Competitive edge: proven cost control wins tenders
Trade policy, tariffs, and standards harmonization
Tariffs such as the US Section 232 25% steel duty (in place since 2018) and equipment/technology levies lift project input costs for Wood, squeezing margins on EPCI contracts; divergent technical codes (ASME, EN, ISO) force multi‑standard engineering teams and increase design complexity. Proactive specification management reduces costly rework, while strategic supplier agreements and long‑term purchase contracts hedge trade shocks and input-price volatility.
- Tariff: US Section 232 steel 25% (since 2018)
- Standards: ASME, EN, ISO — multi‑code competence required
- Mitigation: specification control lowers rework risk
- Hedge: strategic supplier/long‑term contracts reduce trade shock exposure
Green funds and supply shocks reshape projects: IRA $369bn, NextGenEU €723.8bn
Government decarbonization targets (UK net‑zero 2050), IRA $369bn and NextGenerationEU €723.8bn redirect capital to renewables, CCUS and hydrogen, boosting Wood’s project pipeline but exposing it to subsidy/policy timing risk. Geopolitical shocks (EU cut Russian gas ~80% 2021–23) and tariffs (US Section 232 steel 25%) raise input costs and delivery complexity; permitting delays (12–36 months) and 30–70% local‑content rules pressure margins.
| Factor | Metric | Impact |
|---|---|---|
| Green funding | IRA $369bn / NextGenEU €723.8bn | Project growth |
| Gas disruption | EU −80% Russian gas | Supply shifts |
| Permitting | 12–36 months | Schedule risk |
| Tariff | Steel 25% | Cost pressure |
What is included in the product
Detailed Word Document
Explores how external macro-environmental factors uniquely affect the John Wood Group across Political, Economic, Social, Technological, Environmental and Legal dimensions; each section is data-backed, regionally and industry-specific, includes detailed subpoints and forward-looking insights to support executives, consultants and investors in scenario planning, risk mitigation and opportunity identification.
Customizable Excel Spreadsheet
A concise, PESTLE-segmented summary of John Wood Group’s external risks and opportunities, ready to drop into presentations, share across teams, and support faster strategic alignment during planning and client engagements.
Economic factors
Commodity price cycles and client capex
Commodity cycles—Brent crude averaging about $85/bbl in 2024 and copper near $9,000/t—directly time upstream, midstream and materials capex, with higher prices unlocking brownfield debottlenecking and new builds. Downturns shift client spend toward OPEX, efficiency and life‑extension work; Wood plc’s diversified services mix helps capture both capex and higher-margin sustainment. A balanced portfolio smooths revenue volatility, reducing exposure to swings that can exceed ±20% annually.
Interest rates, financing costs, and project viability
Higher policy rates (10-year US Treasury ~4.2% and many corporate borrowing spreads elevated in mid‑2025) push required hurdle IRRs up, delaying FIDs on capital‑intensive Wood projects; strategic financing partnerships have shortened bankability timelines for several recent FPSO and hydrogen bids. Rigorous value engineering has lifted project NPVs by reducing capex and schedule risk, while any sustained rate cuts would likely revive deferred EPC and renewables pipelines.
Inflation and supply chain constraints
Input cost volatility strains Wood plc’s fixed-price contracts as UK CPI eased to about 3.9% in 2024 while global container rates fell roughly 60% from 2021 peaks, pressuring margins; indexation, hedging and collaborative contracting are used to reduce exposure. Early procurement and vendor diversification stabilize deliveries, and digital procurement platforms enhance spend visibility and supplier transparency.
Foreign exchange movements
Global delivery creates material currency mismatches between revenues billed in client currencies and costs incurred in local currencies, forcing Wood to rely on formal hedging policies and natural offsets from geographically balanced operations. FX volatility can erode margins on long-duration engineering and EPC contracts, making contract re-pricing and indexation critical. Pricing in client currency reduces disputes and shifts FX risk back to clients.
- FX exposure: revenues vs costs
- Mitigation: hedging policies, natural offsets
- Risk: margin erosion on long contracts
- Solution: price in client currency
Labor market tightness and productivity
Skilled engineering talent remains scarce in several regions, pressuring John Wood Group’s delivery as global headcount stands at about 40,000 employees (2024) and demand for niche engineers outpaces supply.
Wage inflation has eroded bid competitiveness, with contractor premiums and salary increases rising notably in 2023–24.
Investment in training, automation and global delivery centres has raised productivity and retention, cutting onboarding time and quality risks.
- skill-shortage: regional gaps
- wage-inflation: bid pressure
- productivity: training+automation
- retention: lower onboarding risk
Green funds and supply shocks reshape projects: IRA $369bn, NextGenEU €723.8bn
Commodity-driven capex swings (Brent ~$85/bbl; copper ~$9,000/t in 2024) cause ±20% revenue volatility; higher rates (10y US ~4.2% mid‑2025) delay FIDs while wage inflation and a 40,000 global headcount raise bid costs; procurement indexation, hedging and training/automation mitigate margin and delivery risk.
| Metric | 2024/2025 | Impact |
|---|---|---|
| Brent | $85/bbl | Drives capex |
| 10y US | ~4.2% | Raises hurdle rates |
| Headcount | ~40,000 | Wage pressure |
What You See Is What You Get
John Wood Group PESTLE Analysis
The John Wood Group PESTLE Analysis preview shown here is the exact document you’ll receive after purchase—fully formatted and ready to use. This is a real screenshot of the product you’re buying, delivered exactly as shown with no placeholders or surprises. The layout, content, and structure visible here are exactly what you’ll be able to download immediately after buying.











